ACPD
14, 18905–18942, 2014Technical Note: Reanalysis of upper troposphere humidity
data from the MOZAIC
H. Smit et al.
Title Page
Abstract Introduction
Conclusions References
Tables Figures
◭ ◮
◭ ◮
Back Close
Full Screen / Esc
Printer-friendly Version
Interactive Discussion
Discussion
P
a
per
|
Discus
sion
P
a
per
|
Discussion
P
a
per
|
Discussion
P
a
per
|
Atmos. Chem. Phys. Discuss., 14, 18905–18942, 2014 www.atmos-chem-phys-discuss.net/14/18905/2014/ doi:10.5194/acpd-14-18905-2014
© Author(s) 2014. CC Attribution 3.0 License.
This discussion paper is/has been under review for the journal Atmospheric Chemistry and Physics (ACP). Please refer to the corresponding final paper in ACP if available.
Technical Note: Reanalysis of upper
troposphere humidity data from the
MOZAIC programme for the period 1994
to 2009
H. G. J. Smit1, S. Rohs1, P. Neis1, D. Boulanger2, M. Krämer3, A. Wahner1, and A. Petzold1
1
Forschungszentrum Jülich GmbH, Institut für Energie- und Klimaforschung, IEK-8 Troposphere, 52425 Jülich, Germany
2
Laboratoire d’Aérologie, UMR5560, CNRS and Université de Toulouse, Toulouse, France
3
Forschungszentrum Jülich GmbH, Institut für Energie- und Klimaforschung, IEK-7 Stratosphere, 52425 Jülich, Germany
Received: 24 June 2014 – Accepted: 30 June 2014 – Published: 18 July 2014 Correspondence to: A. Petzold ([email protected])
ACPD
14, 18905–18942, 2014Technical Note: Reanalysis of upper troposphere humidity
data from the MOZAIC
H. Smit et al.
Title Page
Abstract Introduction
Conclusions References
Tables Figures
◭ ◮
◭ ◮
Back Close
Full Screen / Esc
Printer-friendly Version
Interactive Discussion
Discussion
P
a
per
|
Discus
sion
P
a
per
|
Discussion
P
a
per
|
Discussion
P
a
per
|
Abstract
In-situ observational data on the relative humidity (RH) in the upper troposphere and lowermost stratosphere (UT/LS), or tropopause region, respectively, collected aboard civil passenger aircraft in the MOZAIC (Measurements of OZone, water vapour, carbon monoxide and nitrogen oxides by in-service AIrbus airCraft) programme were reanal-5
ysed for the period 2000 to 2009. Previous analyses of probability distribution functions (PDF) of upper troposphere humidity (UTH) data from MOZAIC observations from year 2000 and later indicated a bias of UTH data towards higher RH values compared to data of the period 1994 to 1999. As a result, PDF of UTH data show a substantial frac-tion of observafrac-tions above 100 % relative humidity with respect to liquid water (RHliquid), 10
which is not possible from thermodynamical principles. An in-depth reanalysis of the data set recovered a calibration artefact from year 2000 on, while data of the previous period from 1994 to 1999 were found to be correct. The full data set for 2000–2009 was reanalysed applying the adjusted calibration procedure. Applied correction schemes and a revised error analysis are presented along with the reanalysed PDF of RHliquid
15
and RHice.
1 Introduction
Upper troposphere humidity (UTH) is one of the still poorly understood climate vari-ables, although its role in the global climate system is considered essential (Solomon et al., 2010; Gettelman et al., 2011; Riese et al., 2012). The latest IPCC report (IPCC, 20
2013) states that the knowledge about potential trends and feedback mechanisms of upper tropospheric water vapour is low because of the large variability of observa-tions and relatively short data records. Although balloon-borne data (Hurst et al., 2011) collected over Boulder, CO, and data from satellite–borne instruments like the AURA Microwave Limb Sounder (MLS; Read et al., 2007) or the High-Resolution Infrared Ra-25
ACPD
14, 18905–18942, 2014Technical Note: Reanalysis of upper troposphere humidity
data from the MOZAIC
H. Smit et al.
Title Page
Abstract Introduction
Conclusions References
Tables Figures
◭ ◮
◭ ◮
Back Close
Full Screen / Esc
Printer-friendly Version
Interactive Discussion
Discussion
P
a
per
|
Discus
sion
P
a
per
|
Discussion
P
a
per
|
Discussion
P
a
per
|
specific regions, there is still an urgent need for in-situ observation of UTH on a global scale.
In-situ data on meteorological quantities like temperature and pressure as well as data on atmospheric composition (O3, CO) and UTH are collected regularly in the framework of the European research programme MOZAIC (Marenco et al., 1998). In 5
2011 MOZAIC was transformed into its successor programme IAGOS (Petzold et al., 2012) which aims at the continuation of measurements for another two decades (see http://www.iagos.org for further information).
From the start of the programme in 1994 autonomous instruments for measuring meteorological quantities and atmospheric chemical composition are installed aboard 10
in-service aircraft of several internationally operating airlines. Measurements are con-ducted during scheduled flights of the equipped long-haul passenger aircraft. Using the existing infrastructure of the international air transport system permits the continu-ous collection of high-quality in-situ observation data of excellent spatial and temporal resolution. However, the data base is restricted to the major global flight routes and 15
to the cruising altitude band of 9–13 km, i.e. the data refer to a large extent to the upper troposphere and lowermost stratosphere (UT/LS). In addition, vertical profiles of atmospheric composition (O3, CO) collected during ascents after take-offand
de-scent into airports are of increasing importance for satellite validation (e.g., Cooper et al., 2011; Zbinden et al., 2013) and regional air quality studies including the impact 20
of trans-boundary long-range transport of air pollutants (Cooper et al., 2010; Solazzo et al., 2013).
Atmospheric relative humidity (RH) is measured in the framework of MOZAIC by means of a compact airborne humidity sensing device using capacitive sensors (MOZAIC Capacitive Hygrometer MCH). The sensor itself and applied calibration tech-25
niques are described in detail by Helten et al. (1998). The sensor is calibrated for relative humidity with respect to liquid water (RHliquid) and values of relative
humid-ity with respect to ice (RHice) are then calculated from respective RHliquid data (e.g.,
ACPD
14, 18905–18942, 2014Technical Note: Reanalysis of upper troposphere humidity
data from the MOZAIC
H. Smit et al.
Title Page
Abstract Introduction
Conclusions References
Tables Figures
◭ ◮
◭ ◮
Back Close
Full Screen / Esc
Printer-friendly Version
Interactive Discussion
Discussion
P
a
per
|
Discus
sion
P
a
per
|
Discussion
P
a
per
|
Discussion
P
a
per
|
First sensor validation studies from wing-by-wing flights of a MOZAIC aircraft and a research aircraft are reported by Helten et al. (1999), while Smit et al. (2008) has presented an approach for a potential in-flight calibration method.
Relative humidity data from the MOZAIC programme have been used for various sci-entific studies which include the distribution of RHice (Gierens et al., 1997, 1999, 2007;
5
Stohl et al., 2001; Spichtinger et al., 2002; Kunz et al., 2008) and ice-supersaturation regions (Gierens et al., 2000; Gierens and Spichtinger, 2000; Spichtinger et al., 2002, 2003) in the upper troposphere. The distribution of upper troposphere humidity was investigated in tropical (Bortz et al., 2006; Kley et al., 2007; Luo et al., 2007, 2008; Sahu et al., 2009, 2011) and polar (Nedoluha et al., 2002) regions. MOZAIC RH data 10
were also used for the validation of satellite instruments (e.g., Ekstroem et al., 2008), global chemistry transport models (e.g., Law et al., 2000) and ECMWF models (e.g., Oikonomou and O’Neill, 2006).
The reanalysis period for atmospheric RH data presented here focuses on the first 15 years of MOZAIC observations. As is reported by Lamquin et al. (2012), the prob-15
ability distribution functions (PDF) of RHice as calculated from the MCH data show
a significant shift in RHice towards higher values for data since 2000 while data are in agreement with theoretical expectations and experimental findings for the period 1994 to 1999 (e.g., Gierens et al., 1999; Spichtinger et al., 2004).
The reason for this bias towards higher humidity values is identified as an artefact in 20
the pre- and post-flight calibration regularly conducted in the environmental simulation chamber at Jülich (Helten et al., 1998; Smit et al., 2000) from year 2000 onward. Here we report the procedures followed to reanalyse the calibrations and to reprocess the MOZAIC RH data. An in-depth evaluation of the RH data before and after the repro-cessing of calibrations and flight data since year 2000 is presented and compared to 25
ACPD
14, 18905–18942, 2014Technical Note: Reanalysis of upper troposphere humidity
data from the MOZAIC
H. Smit et al.
Title Page
Abstract Introduction
Conclusions References
Tables Figures
◭ ◮
◭ ◮
Back Close
Full Screen / Esc
Printer-friendly Version
Interactive Discussion
Discussion
P
a
per
|
Discus
sion
P
a
per
|
Discussion
P
a
per
|
Discussion
P
a
per
|
2 MOZAIC dataset 1994 to 2009
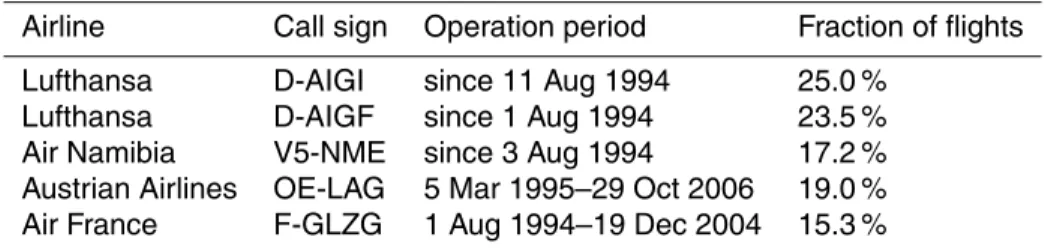
In the first 15 years of MOZAIC between the start of the programme in August 1994 and the end of the reanalysis period in December 2009, in total 32 678 flights were conducted. Table 1 summarises the airlines contributing to the MOZAIC programme and the fraction of flights conducted by the respective aircraft. The global distribution of 5
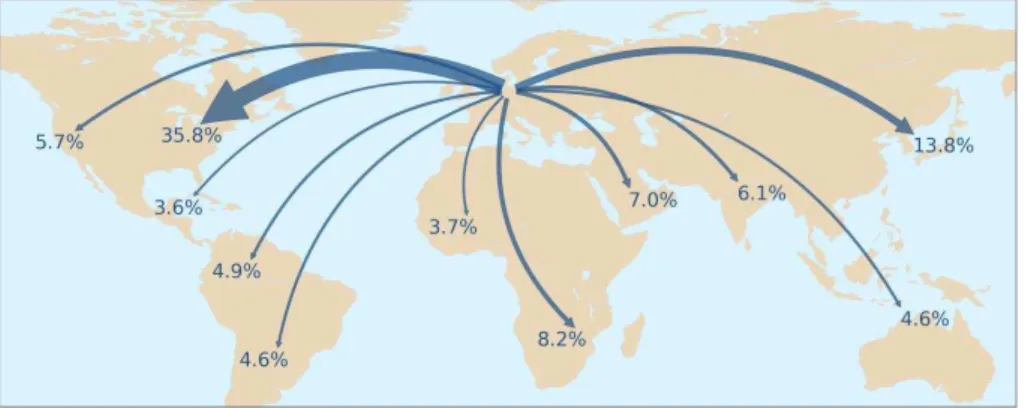
flights in the period 1994–2009 is shown in Fig. 1. The vast majority of 93 % of flights is confined to the Northern Hemisphere and there between Europe and North America. Major gaps of the MOZAIC data set exist for the Pacific region (no flights) and for flights to the Southern Hemisphere across the Equator (7 % of all flights).
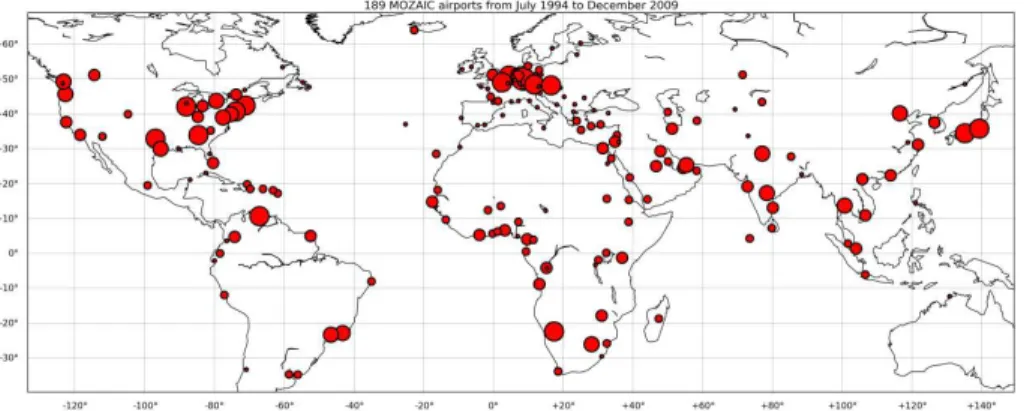
In addition to the global distribution of flights shown in Fig. 1, the worldwide distribu-10
tion of airports visited by MOZAIC aircraft is presented in Fig. 2. The larger the symbols shown in this graph the more frequently the airport was visited, and in turn the more vertical profiles of the atmospheric composition are available for these regions. Par-ticularly, only for those airports being visited continuously over the entire period, the investigation of seasonal variations of atmospheric chemical composition is meaning-15
ful; see e.g. Zbinden et al. (2013).
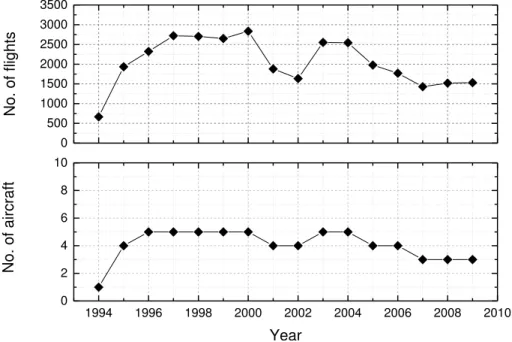
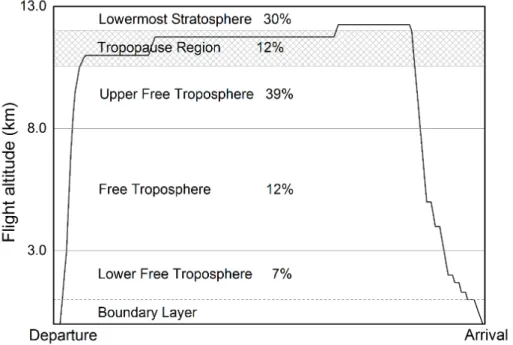
From experience gained in MOZAIC, each aircraft contributes approximately 500 flights per year to the data set. The distribution of flights and aircraft in operation over the considered period is shown in Fig. 3 whereas Fig. 4 illustrates the distribution of observations over altitude. As is clearly visible, the majority of observations (>80 %) 20
is bound to the UT/LS region. For this analysis, the tropopause is defined according to Thouret et al. (2006) as the altitude band from pressure level at potential vorticity 2.0 PVU±15 hPa.
In addition, observed vertical profiles from ascent and descent phases during the flights provide relevant information for the vertical distribution of measured species 25
ACPD
14, 18905–18942, 2014Technical Note: Reanalysis of upper troposphere humidity
data from the MOZAIC
H. Smit et al.
Title Page
Abstract Introduction
Conclusions References
Tables Figures
◭ ◮
◭ ◮
Back Close
Full Screen / Esc
Printer-friendly Version
Interactive Discussion
Discussion
P
a
per
|
Discus
sion
P
a
per
|
Discussion
P
a
per
|
Discussion
P
a
per
|
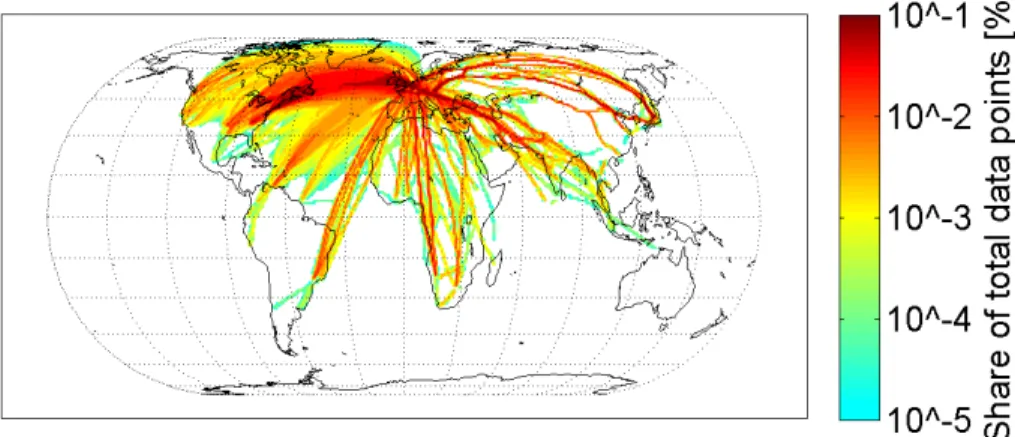
The fractional coverage of MOZAIC upper troposphere humidity data is shown in Fig. 5. for the period 1994 to 2009. Boundary conditions for selecting UTH data only are (1) a temperature range ofT <−40◦C to exclude liquid water clouds and to restrict the altitude range to appox. 9 to 12 km altitude, and (2) potential vorticity below 2.0 PVU in order to exclude stratospheric air masses. The densest coverage is obtained for 5
the entire North Atlantic region. Few main air traffic routes to the Middle East region, Far East and South America are also well covered, whereas the Pacific region and in particular Australia are completely missing in this data set.
3 Artefacts in the MOZAIC RH version 0 data set and corrective measures
3.1 Description of artefacts 10
UTH data confined to air temperatures below−40◦C (threshold for spontaneous freez-ing of supercooled liquid water) should show only values below the homogeneous freezing threshold, which is below water saturation. This feature is confirmed for a large set of UTH data from research aircraft observations (Krämer et al., 2009). However, analysing MOZAIC RH Version 0 data (before recalibration and reprocessing) yields 15
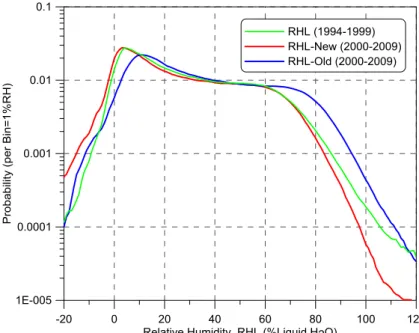
a significant fraction of observations above 100 % RHliquid; see blue line in Fig. 6.
When analysing the UT distribution of RHice, the PDF exhibits a steep decrease at
RHice≥100 % (RHliquid≥60 %) towards ice-supersaturation, and maximum values of
RHiceof approx. 160 % (e.g., Ovarlez et al., 2002; Spichtinger et al., 2004; Krämer et al.,
2009). Analysing the MOZAIC RH Version 0 data set in a similar manner yields PDF 20
which deviate strongly from the observations reported for research-type field studies. Lamquin et al. (2012) report a significant difference in PDF behaviour for MOZAIC RH data between the period 1994 to 1999 and data from year 2000 and later. The modification appears as a significant shift in RHice towards higher values by 10–20 % RHice for data since 2000.
ACPD
14, 18905–18942, 2014Technical Note: Reanalysis of upper troposphere humidity
data from the MOZAIC
H. Smit et al.
Title Page
Abstract Introduction
Conclusions References
Tables Figures
◭ ◮
◭ ◮
Back Close
Full Screen / Esc
Printer-friendly Version
Interactive Discussion
Discussion
P
a
per
|
Discus
sion
P
a
per
|
Discussion
P
a
per
|
Discussion
P
a
per
|
The bias of MCH data towards higher values for the period starting in year 2000 could not be explained by physical reasons but is related to an artefact in sensor handling. An in-depth analysis of the calibration and data processing procedures indicated a change in the sensor calibration at the end of 1999. The identification of this artefact and re-spective corrective measures are described in the following sections. As a brief but 5
anticipated summary of the reprocessing effort, the average PDF of reanalysed data is shown in Fig. 6 (red line) together with the PDF of MOZAIC data from the period 1994 to 1999 (green line) which were found to be correct. Apparently, the reprocessed data set agrees well with the data from the first period and shows only a small and sta-tistically insignificant fraction of data above 100 % RHliquid which, however, fall within 10
the limit of uncertainty of the MCH of ±5 % RHliquid (Helten et al., 1998). Thus, data
reprocessing based on the reanalysis of MCH calibrations have solved the problem of wet-biased MCH data for the period 2000 to 2009.
3.2 Error identification and correction
3.2.1 Pre- and post-flight calibration procedure 15
In the MOZAIC programme the humidity sensors in operation aboard the in-service aircraft are regularly changed every 1–2 months and calibrated in an environmental simulation chamber under typical atmospheric flight conditions for pressure, tempera-ture and RH.
In the test chamber, a Lyman(α) fluorescence hygrometer (LAH; Kley and Stone, 20
1978) is installed as reference instrument for the measurement of low water vapour mixing ratios (1–1000 ppmv) with a relative accuracy of ±4 % (Helten et al., 1998).
At water vapour mixing ratios above 1000 ppmv a dew/frost point hygrometer (DFH; General Eastern, Type D1311R) with an accuracy of ±0.5 K serves as a reference method. Up to three water vapour sensors can be simultaneously calibrated. They are 25
ACPD
14, 18905–18942, 2014Technical Note: Reanalysis of upper troposphere humidity
data from the MOZAIC
H. Smit et al.
Title Page
Abstract Introduction
Conclusions References
Tables Figures
◭ ◮
◭ ◮
Back Close
Full Screen / Esc
Printer-friendly Version
Interactive Discussion
Discussion
P
a
per
|
Discus
sion
P
a
per
|
Discussion
P
a
per
|
Discussion
P
a
per
|
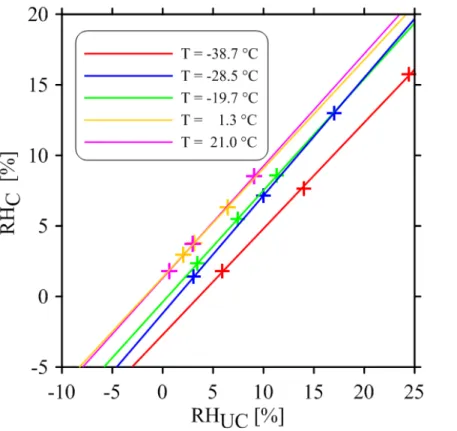
The calibration procedures are described in detail by Helten et al. (1998). The cali-brations revealed that the relative humidity of a calibrated sensor (RHC) for a constant
temperatureTi (with subscript i indicating the ith temperature level of the calibration procedure) can be expressed by a linear relation
RHC(Ti)=a(Ti)+b(Ti)· RHUC(Ti), (1) 5
where RHUC is the uncalibrated output from an individual sensor, while offset a and
slopeb are determined as functions of temperature. At a fixed sensor temperatureTi, three different levels of humidity are set which correspond to typical conditions encoun-tered at the sensing element during in-flight operation in the troposphere.
10
In order to derive the coefficients a and b as function of temperature, calibrations have been performed at three temperature levels of −20, −30, and −40◦C, while at
higher temperatures an extrapolation of the calibration to the nominal calibration of the manufacturer at 20◦C has been applied. However, since late 1999 additional calibra-tions at 0 and 20◦C have become standard in the calibration process to improve the 15
accuracy of the measurements made in the corresponding altitude region between 0 and 5 km. From investigations made at constant temperature but at different pressures between 100 and 1000 hPa, no significant pressure dependence of the sensitivity of the humidity sensor had been observed.
A typical behaviour of the temperature measured at different locations inside the en-20
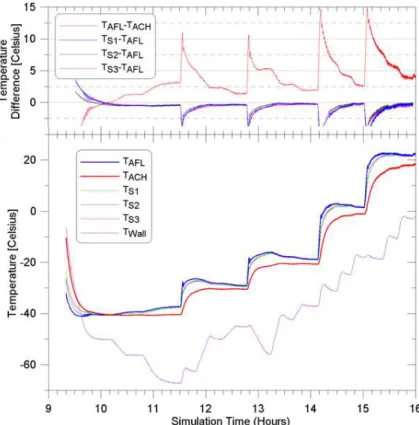
vironmental simulation chamber as a function of time during a calibration run is shown in Fig. 7. The following temperatures are measured with different sensors: (i)TAFLand
TACH=temperature of the air flow and at the wall inside the flow duct of the LAH; (ii)
TS1,TS2and TS3=temperatures of three different MCH units which are subject to cali-bration; (iii)TWall=temperature of the wall inside the simulation chamber.
25
Figure 8 shows the results of the uncalibrated sensor (RHUC) at five sensor
ACPD
14, 18905–18942, 2014Technical Note: Reanalysis of upper troposphere humidity
data from the MOZAIC
H. Smit et al.
Title Page
Abstract Introduction
Conclusions References
Tables Figures
◭ ◮
◭ ◮
Back Close
Full Screen / Esc
Printer-friendly Version
Interactive Discussion
Discussion
P
a
per
|
Discus
sion
P
a
per
|
Discussion
P
a
per
|
Discussion
P
a
per
|
3.2.2 Artefact in the calibration procedure
As pointed out in the previous section, the sudden jump of MCH data towards higher RH values is caused by an artefact introduced in the sensor calibration since fall 1999 after (1) the calibration procedure was expanded by two additional temperature lev-els at 0 and+20◦C, and (2) the data acquisition software was switched from Pascal-5
to LabView-programming language.
In the new data acquisition software the air flow temperature (TAFL) was no longer used but instead, by mistake, the wall temperature (TACH) of the flow duct of the LAH reference instrument. Since calibration was and is conducted at a variety of tempera-tures, adjustment of the wall temperatureTACH of the LAH to the changed air temper-10
ature (lower panel of Fig. 7) requires time. Because a standard calibration run always starts at the lowest air temperature level of−40◦C and then increases in steps of 10– 20◦C towards higher temperature levels,TACHvalues are systematically 1–3◦C, or even more, lower than the air flow temperature TAFL or the three sensor temperatures TS1,
TS2andTS3(upper panel of Fig. 7). However,TSiare all very close toTAFL. 15
To derive relative humidity RHC, either from the measured water vapour volume mix-ing ratio of LAH, or from the measured dew/frost temperature fromTDF, in both cases the temperature of the air flow has to be applied, according to
RHLAH(T)=µLAH· pAir
eS(T) (2)
20
whereµLAHis the water vapour volume mixing ratio as measured by LAH,eS(T) is the saturation water vapour pressure at temperatureT andpair is air pressure; or
RHDFH(T)=
eS(TDF)
eS(T) (3)
whereTDF is dew/frost point temperature as measured by DFH. 25
Due to the erroneous use of the lower TACH instead of TAFL all RHC values were
ACPD
14, 18905–18942, 2014Technical Note: Reanalysis of upper troposphere humidity
data from the MOZAIC
H. Smit et al.
Title Page
Abstract Introduction
Conclusions References
Tables Figures
◭ ◮
◭ ◮
Back Close
Full Screen / Esc
Printer-friendly Version
Interactive Discussion
Discussion
P
a
per
|
Discus
sion
P
a
per
|
Discussion
P
a
per
|
Discussion
P
a
per
|
values) in the offseta(Ti) and slopeb(Ti) as derived from Eqs. (2) and (3) at five different air temperature (Ti) levels of the calibration (Figs. 7 and 8).
There are no indications that the temperature sensors used have changed their per-formance over time. Thus, calibration coefficients for offset a and slope b (i.e. sensi-tivity) are affected by this systematic temperature bias of 1–3 K. Because saturation 5
water vapour pressureeS(T) is a strong function of temperature and decreases almost exponentially with temperature (6 % K−1at 300 K and 10 % K−1at 200 K), it is obvious that the systematic temperature bias of 1–3 K can introduce systematic effects of 10 % or more in RHLAHor RHDFHand thus an impact of similar magnitude on the offsetaand
slopebof the calibration function (Eq. 1). 10
Consequently, this bias in the calibration function will have a quantitative impact of equal magnitude on the RH flight data and thus requires: (1) reprocessing of all pre-post flight calibrations made since 1999 by applying the right temperature; (2) applying the corrected offset and slope as a function of the sensor temperature. Since all cali-bration records includingTAFL and TACH since fall 1999 were archived, all calibrations 15
and in consequence all MOZAIC RH flight data could have been fully reprocessed.
4 Quality assurance of calibration
The error analysis and the resulting corrective measures taken for the MCH calibration as described in the previous section yielded a set of calibration functions of offset a
and slope b. In order to assure the quality of the obtained calibration functions, the 20
statistical distribution of the obtained calibration parameters and their long-term stability were analysed similar to the analysis conducted at the beginning of the MOZAIC RH measurements (Helten et al., 1998). Comparing the scatter of reanalysed calibration parameters and their long-term stability with the results from the early period of this programme will provide a measure for the quality of the reanalysed MOZAIC RH data 25
ACPD
14, 18905–18942, 2014Technical Note: Reanalysis of upper troposphere humidity
data from the MOZAIC
H. Smit et al.
Title Page
Abstract Introduction
Conclusions References
Tables Figures
◭ ◮
◭ ◮
Back Close
Full Screen / Esc
Printer-friendly Version
Interactive Discussion
Discussion
P
a
per
|
Discus
sion
P
a
per
|
Discussion
P
a
per
|
Discussion
P
a
per
|
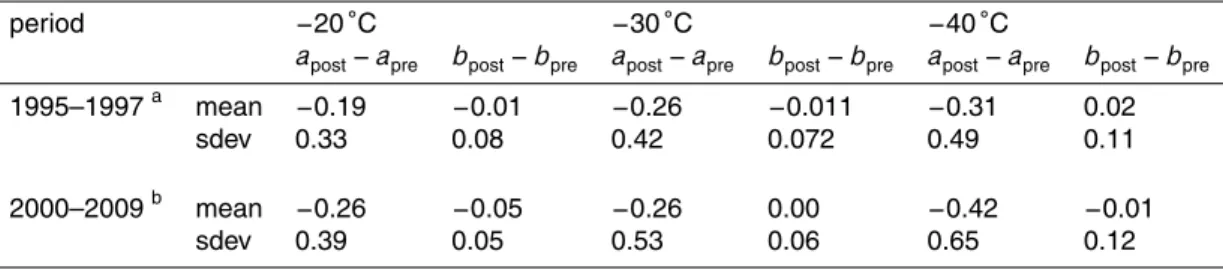
The statistical distribution of the difference in parametersa and b between calibra-tions conducted before installation on an aircraft and after exchange is shown in Fig. 9. Both frequency distributions are of Gaussian type similar to the observations reported for the first set of calibration parameters by Helten et al. (1998). The respective mean values of parametersa andband associated standard deviations are compiled in Ta-5
ble 2. Obviously, slopes b of calibration functions are of value zero, i.e., they do not change on a statistically significant level between pre-flight and post-flight calibrations. On the other hand, the offseta reduces between pre-flight and post-flight calibrations, which however is a consistent finding for the periods 1994 to 1999 and 2000 to 2009. Moreover, the quantitative values of the statistical distribution of differences (apost−apre)
10
and (bpost−bpre) are in unexpectedly close agreement for the analysed periods 1994– 1999 and 2000–2009; see Table 2 for details. Smit et al. (2008) have shown that the sensor offset drifts are the most dominating parameter in determining the uncertainty of the measurements, while the sensitivity (slope) is more stable in time. The observed consensus of data underpins the consistency of the RH data set which has emerged 15
from the MOZAIC programme.
The long-term stability of sensor calibrations was investigated by checking calibra-tion parameters of the same sensor over the entire analysed decade from 2000 to 2009. Results are shown in Fig. 10 with different colours referring to different sensor units; they agree well with previous findings reported by Helten et al. (1998). Although 20
a significant scatter of calibration factors is observed among different sensor units, the behaviour of each single sensor unit is robust. Observed changes of offsetaand slope
bbetween a postflight and the next preflight calibration are most likely caused by the cleaning procedure of the sensor in the laboratory prior to the preflight calibration (Hel-ten et al., 1998). However, it should be mentioned that despite the consis(Hel-tency of the 25
long-term sensor behaviour, only current calibration functions are used for the data analysis.
In a final assessment, the uncertainty of RHliquiddata was analysed as a function of
ACPD
14, 18905–18942, 2014Technical Note: Reanalysis of upper troposphere humidity
data from the MOZAIC
H. Smit et al.
Title Page
Abstract Introduction
Conclusions References
Tables Figures
◭ ◮
◭ ◮
Back Close
Full Screen / Esc
Printer-friendly Version
Interactive Discussion
Discussion
P
a
per
|
Discus
sion
P
a
per
|
Discussion
P
a
per
|
Discussion
P
a
per
|
(1998), the analysis of the MOZAIC RH measurement is performed with the averages of the individual pre-flight and post-flight calibration coefficientsaand bfor each interval of flight operation.
Recalling details of sensor installation and operation, the capacitive humidity sensing device is installed inside a conventional Rosemount inlet housing together with a Pt 100 5
temperature sensor. The movement of the aircraft forces airflow around the RH- and T-sensors but at a higher pressure and temperature than for the surrounding atmosphere due to adiabatic heating of the air when entering the inlet. The transformation of RH values measured by the capacitive sensor of the MCH (RHD; Helten et al., 1998) to RH values for ambient air temperature and pressure conditions (RH) requires knowledge of 10
the static air temperature (SAT) of ambient air and of the total air temperature (TAT) at the position of the capacitive sensor inside the MCH housing. Relative humidity of the ambient air (RHS; Helten et al., 1998) is then determined from the measured values for RHD, TAT, and SAT by applying the procedure described by Helten et al. (1998). The uncertainty of RH is deduced by the law of error propagation with the uncertainty of 15
these parameters.
The uncertainty of RHD is a composite of the following contributions: uncertainty of the Lyman-Alpha hygrometer calibration and half of the absolute value of the diff er-ences of the individual pre-flight and post flight calibration coefficients, a and b. To convert to the uncertainty of RH, the uncertainties of TAT (0.25 K) and SAT (0.5 K) 20
have to be included. The contribution of uncertainty of the air speed measurement by the aircraft to the uncertainty of temperature determination is below 0.01◦C and was excluded from the error propagation determination. The uncertainty of the recovery fac-tor of the Rosemount probe housing contributes to the uncertainties of the temperature measurements and thus to the uncertainty of the recovered RH (Helten et al., 1998). 25
ACPD
14, 18905–18942, 2014Technical Note: Reanalysis of upper troposphere humidity
data from the MOZAIC
H. Smit et al.
Title Page
Abstract Introduction
Conclusions References
Tables Figures
◭ ◮
◭ ◮
Back Close
Full Screen / Esc
Printer-friendly Version
Interactive Discussion
Discussion
P
a
per
|
Discus
sion
P
a
per
|
Discussion
P
a
per
|
Discussion
P
a
per
|
caused by the temperature uncertainty. The MOZAIC database contains estimates of the total uncertainty of RH for each individual humidity data point.
Since at the beginning the MOZAIC program focused on the middle and upper tropo-sphere, the pre-flight and post-flight calibrations of the humidity sensors above−20◦C
were not performed before the year 2000. This means that then the coefficients a and b 5
of the MOZAIC humidity sensors for measurements in the lower troposphere are based on the interpolation between pre-flight and post-flight calibrations at around−20◦C and
the manufacturer’s calibration at+20◦C. Also, estimates of calibration uncertainties, based on pre-flight and post-flight analyses cannot be given for the lower troposphere for the period 1994–1999. Since 2000 the calibrations were extended to two additional 10
temperature levels at 0 and+20◦C.
Figure 11 show the variations of uncertainties of the RH measurements, the mean plus standard deviation of the individual total uncertainties over all MOZAIC data of 1994–1999 and 2000–2009 period. In the middle and upper troposphere the total un-certainties obtained are very similar for both periods. In the lower troposphere the total 15
uncertainties for the first period are slightly higher compared to the second period due to the missing calibrations at temperatures larger than−20◦C.
For measurements of stratospheric humidity, where RH values below 5 % prevail, the uncertainty of the MOZAIC humidity device is insufficient for quantitative water vapour measurements, since sensor response time is too slow to equilibrate at the low relative 20
humidity and low temperatures. Thus, these data have to be considered carefully in the data analysis. However, cold and dry sequences in the lower stratosphere are used for an in-flight calibration of the sensor offset (calibration coefficienta) which is described in more detail by Smit et al. (2008).
5 Performance of MCH
25
ACPD
14, 18905–18942, 2014Technical Note: Reanalysis of upper troposphere humidity
data from the MOZAIC
H. Smit et al.
Title Page
Abstract Introduction
Conclusions References
Tables Figures
◭ ◮
◭ ◮
Back Close
Full Screen / Esc
Printer-friendly Version
Interactive Discussion
Discussion
P
a
per
|
Discus
sion
P
a
per
|
Discussion
P
a
per
|
Discussion
P
a
per
|
equipped with water vapour measurements and MOZAIC aircraft (Helten et al., 1999), the MCH was operated aboard a Learjet 35A aircraft as part of the CIRRUS-III field study; see Kunz et al. (2008) and Krämer et al. (2009) for more information. A detailed analysis of the MCH performance during CIRRUS-III is provided elsewhere (Neis et al., 2014), while we present here a brief summary of campaign details and key findings. 5
The overarching goals of CIRRUS-III were to understand the formation mechanism of cirrus clouds in different background conditions, their radiative effects and the micro-physical properties of the cirrus cloud particles. In total 6 flights have been conducted in the period between 23 and 29 November 2006 at mid-latitudes (45◦–70◦N) and at flight altitudes between 7–12 km. These flights in the upper troposphere and lowermost 10
stratosphere (UT/LS) were launched from Hohn Airforce Base in northern Germany with the Learjet 35A operated byenviscopeGmbH. CIRRUS-III provided a dataset with approx. 14 flight hours in air masses colder than−40◦C, approx. 4 flight hours in cirrus
clouds and 10 flight hours out of cloud. Furthermore, stratospherically influenced air masses have been sampled for 20 min with ozone volume mixing ratios (VMR) above 15
125 ppmv and 35 min with ozone VMR above 100 ppmv, respectively.
Part of the scientific payload of CIRRUS-III was dedicated to the measurement of water vapour and total water by one MCH for measuring relative humidity and one open path tuneable diode laser system (OJSTER; MayComm Instruments; May and Webster, 1993; Krämer et al., 2009) which delivered the water vapour VMR. Simul-20
taneously total water, i.e. gas phase and ice water, was measured by the reference instrument FISH (Fast In-Situ Hygrometer). This closed-cell Lyman(α) fluorescence hygrometer (Zöger et al., 1999) was equipped with a forward facing inlet to sample also the ice particles. To determine whether a data point was inside a cirrus cloud or not, the difference between total water and water vapour was used to define a cloud 25
index; see Krämer et al. (2009) for the detailed data analysis procedure.
For the sensor intercomparison study, data for H2O VMR>1000 ppm were excluded
ACPD
14, 18905–18942, 2014Technical Note: Reanalysis of upper troposphere humidity
data from the MOZAIC
H. Smit et al.
Title Page
Abstract Introduction
Conclusions References
Tables Figures
◭ ◮
◭ ◮
Back Close
Full Screen / Esc
Printer-friendly Version
Interactive Discussion
Discussion
P
a
per
|
Discus
sion
P
a
per
|
Discussion
P
a
per
|
Discussion
P
a
per
|
were beyond the MCH calibration limits. In order to neglect effects of warm clouds the maximum ambient air temperature of accepted data was set to the level of instanta-neous freezing of−40◦C. For a complete validation of the MCH the data set was split into a clear sky-set and a cirrus cloud-set by means of the above-described cloud in-dex. Finally, flight sequences of the Learjet 35A with strong ascents and descents were 5
excluded, since these flight conditions are not suitable for instrument intercomparison, because already small time shifts between instruments with different response times lead to large differences due to the rapidly changing H2O VMR.
For the instrument intercomparison we analysed the sensors with respect to RHliquid
since this is the measured quantity the MCH is calibrated against. The correlation be-10
tween the two sensors is shown in Fig. 12 for RHliquid values averaged for 5 % bins. The bin size was selected according to the expected uncertainty of the sensor of±5 % RHliquid. The plotted data points and errors bars per bin shown in Fig. 12 represent
the median, 25- and 75-percentile of the binned RHliquiddata from the reference instru-ments (x-axis) and MCH (y-axis), respectively.
15
The MCH agrees very well with the FISH over the entire range of values measured in the cloud-free atmosphere and with the OJSTER inside cirrus. Linear regression analysis provides a correlation coefficientR2=0.97 and a slopem=0.96±0.05 while the y-axis intercept equals zero within the limit of uncertainty (2.2±2.0 % RHliquid). The
data for RHliquid≥75 % and RHliquid≤10 % suffer from a small number of counts and
20
are not considered for the MCH performance analysis because of limited statistical significance.
The proof of validity of the MCH RHliquiddata is shown in Fig. 13. The PDF for RHliquid agree very well between MCH and the reference instrument (FISH or OJSTER, resp.) for the entire CIRRUS-III data set. An in-depth analysis of the MCH performance includ-25
ACPD
14, 18905–18942, 2014Technical Note: Reanalysis of upper troposphere humidity
data from the MOZAIC
H. Smit et al.
Title Page
Abstract Introduction
Conclusions References
Tables Figures
◭ ◮
◭ ◮
Back Close
Full Screen / Esc
Printer-friendly Version
Interactive Discussion
Discussion
P
a
per
|
Discus
sion
P
a
per
|
Discussion
P
a
per
|
Discussion
P
a
per
|
6 Discussion and conclusions
The identification of a bias of UTH data from the MCH towards more humid conditions (e.g., Lamquin et al., 2012) sparked an in-depth reanalysis of the entire MOZAIC UTH data set from year 2000 onwards, whereas MOZAIC MCH data from the pre-2000 period (Gierens et al., 1999) were found to be unbiased. The reanalysis identified an 5
error in the analysis of the instrument calibration as the source for this bias. The entire calibration data set since year 2000 was reanalysed and the MOZAIC data set was reprocessed using the corrected calibration functions.
The annually averaged PDF of reprocessed UTH data from the MCH operated aboard the MOZAIC fleet is shown in Fig. 14. The reprocessed MOZAIC MCH data 10
set exhibits the key features of physically sound UTH data, i.e., only a statistically insignificant fraction of the observations (<10−4) is above the limit of 100 % RHliquid
(Fig. 14a), and the inflection point of the PDF with respect to RHice is close to 100 % RHice (Fig. 14b).
The validity of the reprocessed MOZAIC UTH data set is further confirmed by the 15
comparison with an extensive data set collected by Krämer et al. (2009); see the solid lines in Fig. 14b. This data set is based on research flights in cirrus clouds using the Lyman-(α) Fast In-situ Hygrometer FISH (Zöger et al., 1999) and was collected during 20 measurement flights in 8 field campaigns between 1998 and 2006. The deviation of FISH RHice data from MCH RHice data for the in-cloud fraction of the observations
20
is due to the fact that the FISH instrument is usually operated for measuring total wa-ter (=water vapour plus ice water), and inside cirrus clouds the ice water from cirrus particles contributes significantly to the overall humidity above approx. 130 % RHice.
Major modifications of the MOZAIC RH data due to the reprocessing can be under-stood as a shift of single observation data towards dryer conditions, i.e., towards lower 25
ACPD
14, 18905–18942, 2014Technical Note: Reanalysis of upper troposphere humidity
data from the MOZAIC
H. Smit et al.
Title Page
Abstract Introduction
Conclusions References
Tables Figures
◭ ◮
◭ ◮
Back Close
Full Screen / Esc
Printer-friendly Version
Interactive Discussion
Discussion
P
a
per
|
Discus
sion
P
a
per
|
Discussion
P
a
per
|
Discussion
P
a
per
|
However, from a statistical point of view, major modifications of the data set are associated with the fraction of observations close to or above ice supersaturation which is significantly reduced and the inflection point of RHice data is shifted from RHice∼=
130 % to 100 %. In contrast, fractional changes in the RHliquid range between 20 and 60 % are only minor. Finally, the maximum of RHliquidvalues for dry conditions which is
5
associated to observations in the dry and cold lowermost stratosphere is shifted from RHliquid∼=10 % to 5 %.
In conclusion, the reanalysis of MOZAIC RH data should be considered for studies which have focused on the investigation of ice supersaturation in the UT and used mainly MOZAIC data from year 2000 and later. The reprocessed UTH data set from 10
measurements aboard MOZAIC aircraft will become available at the IAGOS/MOZAIC Database website http://www.iagos.fr/web/ for scientific exploration as Version No. 1.
Acknowledgements. The authors gratefully acknowledge substantial contributions by Peter
Spichtinger (Mainz Univ.) and Klaus Gierens (DLR) to the discussion of potential explanations for the observed bias in MOZAIC RH data. The support by Manfred Helten during the
15
reanalysis of the sensor calibrations and by Lukas Alteköster (RWTH Aachen/FZ Jülich) in the preparation of the global data set is also appreciated. Part of this work was funded by the German Federal Ministry for Research and Education (BMBF) in the framework of the joint programme IAGOS-D under Grant No. 01LK1223A.
20
The service charges for this open access publication have been covered by a Research Centre of the Helmholtz Association.
References
Bortz, S. E., Prather, M. J., Cammas, J. P., Thouret, V., and Smit, H.: Ozone, water vapor,
25
ACPD
14, 18905–18942, 2014Technical Note: Reanalysis of upper troposphere humidity
data from the MOZAIC
H. Smit et al.
Title Page
Abstract Introduction
Conclusions References
Tables Figures
◭ ◮
◭ ◮
Back Close
Full Screen / Esc
Printer-friendly Version
Interactive Discussion
Discussion
P
a
per
|
Discus
sion
P
a
per
|
Discussion
P
a
per
|
Discussion
P
a
per
|
Cooper, M., Martin, R. V., Sauvage, B., Boone, C. D., Walker, K. A., Bernath, P. F., McLin-den, C. A., Degenstein, D. A., Volz-Thomas, A., and Wespes, C.: Evaluation of ACE-FTS and OSIRIS Satellite retrievals of ozone and nitric acid in the tropical upper tro-posphere: application to ozone production efficiency, J. Geophys. Res., 116, D12306, doi:10.1029/2010jd015056, 2011.
5
Cooper, O. R., Parrish, D. D., Stohl, A., Trainer, M., Nedelec, P., Thouret, V., Cammas, J. P., Oltmans, S. J., Johnson, B. J., Tarasick, D., Leblanc, T., McDermid, I. S., Jaffe, D., Gao, R., Stith, J., Ryerson, T., Aikin, K., Campos, T., Weinheimer, A., and Avery, M. A.: Increasing springtime ozone mixing ratios in the free troposphere over western North America, Nature, 463, 344–348, doi:10.1038/nature08708, 2010.
10
Ekström, M., Eriksson, P., Read, W. G., Milz, M., and Murtagh, D. P.: Comparison of satellite limb-sounding humidity climatologies of the uppermost tropical troposphere, Atmos. Chem. Phys., 8, 309–320, doi:10.5194/acp-8-309-2008, 2008.
Gettelman, A., Hoor, P., Pan, L. L., Randel, W. J., Hegglin, M. I., and Birner, T.: The extratropical upper troposphere and lower stratosphere, Rev. Geophys., 49, RG3003,
15
doi:10.1029/2011rg000355, 2011.
Gierens, K. and Spichtinger, P.: On the size distribution of ice-supersaturated regions in the upper troposphere and lowermost stratosphere, Ann. Geophys., 18, 499–504, doi:10.1007/s005850050907, 2000.
Gierens, K., Schumann, U., Helten, M., Smit, H., and Marenco, A.: A distribution law for
rel-20
ative humidity in the upper troposphere and lower stratosphere derived from three years of MOZAIC measurements, Ann. Geophys., 17, 1218–1226, doi:10.1007/s005850050846, 1999.
Gierens, K., Schumann, U., Helten, M., Smit, H., and Wang, P. H.: Ice-supersaturated regions and subvisible cirrus in the northern midlatitude upper troposphere, J. Geophys. Res., 105,
25
22743–22753, doi:10.1029/2000jd900341, 2000.
Gierens, K., Kohlhepp, R., Dotzek, N., and Smit, H. G.: Instantaneous fluctuations of tem-perature and moisture in the upper troposphere and tropopause region. Part 1: Probability densities and their variability, Meteorol. Z., 16, 221–231, doi:10.1127/0941-2948/2007/0197, 2007.
30
ACPD
14, 18905–18942, 2014Technical Note: Reanalysis of upper troposphere humidity
data from the MOZAIC
H. Smit et al.
Title Page
Abstract Introduction
Conclusions References
Tables Figures
◭ ◮
◭ ◮
Back Close
Full Screen / Esc
Printer-friendly Version
Interactive Discussion
Discussion
P
a
per
|
Discus
sion
P
a
per
|
Discussion
P
a
per
|
Discussion
P
a
per
|
Gierens, K. M., Schumann, U., Smit, H. G. J., Helten, M., and Zangl, G.: Determination of humidity and temperature fluctuations based on MOZAIC data and parametrisation of per-sistent contrail coverage for general circulation models, Ann. Geophys., 15, 1057–1066, doi:10.1007/s00585-997-1057-3, 1997.
Helten, M., Smit, H. G. J., Strater, W., Kley, D., Nedelec, P., Zoger, M., and Busen, R.:
5
Calibration and performance of automatic compact instrumentation for the measure-ment of relative humidity from passenger aircraft, J. Geophys. Res., 103, 25643–25652, doi:10.1029/98jd00536, 1998.
Helten, M., Smit, H. G. J., Kley, D., Ovarlez, J., Schlager, H., Baumann, R., Schumann, U., Nedelec, P., and Marenco, A.: In-flight comparison of MOZAIC and POLINAT water vapor
10
measurements, J. Geophys. Res., 104, 26087–26096, doi:10.1029/1999jd900315, 1999. Hurst, D. F., Oltmans, S. J., Vomel, H., Rosenlof, K. H., Davis, S. M., Ray, E. A., Hall, E. G.,
and Jordan, A. F.: Stratospheric water vapor trends over Boulder, Colorado: analysis of the 30 year Boulder record, J. Geophys. Res., 116, D02306, doi:10.1029/2010jd015065, 2011. IPCC: Working Group I Contribution to the IPCC Fifth Assessment Report Climate Change
15
2013: The Physical Science Basis, Summary for Policymakers, Final Draft, IPCC, Geneva, Switzerland, 2013.
Kley, D. and Stone, E. J.: Measurement of water-vapor in the stratosphere by photo-dissociation with Lyα(1216 ) light, Rev. Sci. Instrum., 49, 691–697, doi:10.1063/1.1135596, 1978. Kley, D., Smit, H. G. J., Nawrath, S., Luo, Z., Nedelec, P., and Johnson, R. H.: Tropical Atlantic
20
convection as revealed by ozone and relative humidity measurements, J. Geophys. Res.-Atmos., 112, D23109, doi:10.1029/2007jd008599, 2007.
Krämer, M., Schiller, C., Afchine, A., Bauer, R., Gensch, I., Mangold, A., Schlicht, S., Spel-ten, N., Sitnikov, N., Borrmann, S., de Reus, M., and Spichtinger, P.: Ice supersaturations and cirrus cloud crystal numbers, Atmos. Chem. Phys., 9, 3505–3522,
doi:10.5194/acp-9-25
3505-2009, 2009.
Kunz, A., Schiller, C., Rohrer, F., Smit, H. G. J., Nedelec, P., and Spelten, N.: Statistical analysis of water vapour and ozone in the UT/LS observed during SPURT and MOZAIC, Atmos. Chem. Phys., 8, 6603–6615, doi:10.5194/acp-8-6603-2008, 2008.
Lamquin, N., Stubenrauch, C. J., Gierens, K., Burkhardt, U., and Smit, H.: A global climatology
30
ACPD
14, 18905–18942, 2014Technical Note: Reanalysis of upper troposphere humidity
data from the MOZAIC
H. Smit et al.
Title Page
Abstract Introduction
Conclusions References
Tables Figures
◭ ◮
◭ ◮
Back Close
Full Screen / Esc
Printer-friendly Version
Interactive Discussion
Discussion
P
a
per
|
Discus
sion
P
a
per
|
Discussion
P
a
per
|
Discussion
P
a
per
|
Law, K. S., Plantevin, P. H., Thouret, V., Marenco, A., Asman, W. A. H., Lawrence, M., Crutzen, P. J., Muller, J. F., Hauglustaine, D. A., and Kanakidou, M.: Comparison be-tween global chemistry transport model results and Measurement of Ozone and Water Vapor by Airbus In-Service Aircraft (MOZAIC) data, J. Geophys. Res., 105, 1503–1525, doi:10.1029/1999jd900474, 2000.
5
Luo, Z., Kley, D., Johnson, R. H., and Smit, H.: Ten years of measurements of tropical upper-tropospheric water vapor by MOZAIC. Part II: Assessing the ECMWF humidity analysis, J. Climate, 21, 1449–1466, doi:10.1175/2007jcli1887.1, 2008.
Luo, Z. Z., Kley, D., Johnson, R. H., and Smit, H.: Ten years of measurements of tropical upper-tropospheric water vapor by MOZAIC. Part I: Climatology, variability, transport, and relation
10
to deep convection, J. Climate, 20, 418–435, doi:10.1175/jcli3997.1, 2007.
Marenco, A., Thouret, V., Nedelec, P., Smit, H., Helten, M., Kley, D., Karcher, F., Simon, P., Law, K., Pyle, J., Poschmann, G., Von Wrede, R., Hume, C., and Cook, T.: Measurement of ozone and water vapor by Airbus in-service aircraft: the MOZAIC airborne program, An overview, J. Geophys. Res., 103, 25631–25642, doi:10.1029/98jd00977, 1998.
15
May, R. D. and Webster, C. R.: Data processing and calibration for tunable diode-laser har-monic absorption spectrometers, J. Quant. Spectrosc. Ra., 49, 335–347, doi:10.1016/0022-4073(93)90098-3, 1993.
Nedoluha, G. E., Bevilacqua, R. M., Hoppel, K. W., Lumpe, J. D., and Smit, H.: Polar Ozone and Aerosol Measurement III measurements of water vapor in the upper troposphere and
20
lowermost stratosphere, J. Geophys. Res.-Atmos., 107, 4103, doi:10.1029/2001jd000793, 2002.
Neis, P., Krämer, M., Spelten, N., Smit, H., and Petzold, A.: Evaluation of the MOZAIC Capaci-tive Hygrometer in airborne intercomparison studies, Atmos. Meas. Tech., in preparation for submission, 2014.
25
Oikonomou, E. K. and O’Neill, A.: Evaluation of ozone and water vapor fields from the ECMWF reanalysis ERA-40 during 1991–1999 in comparison with UARS satellite and MOZAIC air-craft observations, J. Geophys. Res., 111, D14109, doi:10.1029/2004jd005341, 2006. Ovarlez, J., Gayet, J. F., Gierens, K., Strom, J., Ovarlez, H., Auriol, F., Busen, R., and
Schu-mann, U.: Water vapour measurements inside cirrus clouds in Northern and Southern
Hemi-30
spheres during INCA, Geophys. Res. Lett., 29, 1813, doi:10.1029/2001gl014440, 2002. Petzold, A., Volz-Thomas, A., Thouret, V., Cammas, J.-P., and Brenninkmeijer, C. A. M.: IAGOS
Trans-ACPD
14, 18905–18942, 2014Technical Note: Reanalysis of upper troposphere humidity
data from the MOZAIC
H. Smit et al.
Title Page
Abstract Introduction
Conclusions References
Tables Figures
◭ ◮
◭ ◮
Back Close
Full Screen / Esc
Printer-friendly Version
Interactive Discussion
Discussion
P
a
per
|
Discus
sion
P
a
per
|
Discussion
P
a
per
|
Discussion
P
a
per
|
port, Atmosphere and Climate, Prien am Chiemsee, Germany, 25–28 June 2012, 69–76, 2013.
Pruppacher, H. R. and Klett, J. D.: Microphysics of Clouds and Precipitation, 2nd edn., Kluwer Academic Publishers, AA Dordrecht, 1997.
Read, W. G., Lambert, A., Bacmeister, J., Cofield, R. E., Christensen, L. E., Cuddy, D. T.,
5
Daffer, W. H., Drouin, B. J., Fetzer, E., Froidevaux, L., Fuller, R., Herman, R., Jarnot, R. F., Jiang, J. H., Jiang, Y. B., Kelly, K., Knosp, B. W., Kovalenko, L. J., Livesey, N. J., Liu, H. C., Manney, G. L., Pickett, H. M., Pumphrey, H. C., Rosenlof, K. H., Sabounchi, X., Santee, M. L., Schwartz, M. J., Snyder, W. V., Stek, P. C., Su, H., Takacs, L. L., Thurstans, R. P., Vomel, H., Wagner, P. A., Waters, J. W., Webster, C. R., Weinstock, E. M., and Wu, D. L.: Aura Microwave
10
Limb Sounder upper tropospheric and lower stratospheric H2O and relative humidity with respect to ice validation, J. Geophys. Res., 112, D24S35, doi:10.1029/2007jd008752, 2007. Riese, M., Ploeger, F., Rap, A., Vogel, B., Konopka, P., Dameris, M., and Forster, P.: Impact
of uncertainties in atmospheric mixing on simulated UTLS composition and related radiative effects, J. Geophys. Res.-Atmos., 117, D16305, doi:10.1029/2012jd017751, 2012.
15
Sahu, L. K., Lal, S., Thouret, V., and Smit, H. G.: Seasonality of tropospheric ozone and water vapor over Delhi, India: a study based on MOZAIC measurement data, J. Atmos. Chem., 62, 151–174, doi:10.1007/s10874-010-9146-1, 2009.
Sahu, L. K., Lal, S., Thouret, V., and Smit, H. G.: Climatology of tropospheric ozone and water vapour over Chennai: a study based on MOZAIC measurements over India, Int. J. Climatol.,
20
31, 920–936, doi:10.1002/joc.2128, 2011.
Smit, H., Sträter, W., Helten, M., and Kley, D.: Environmental Simulation Facility to Calibrate Airborne Ozone and Humidity Sensors, Berichte des Forschungszentrums Jülich; Report No. 3796, Jülich, Germany, 31 pp., 2000.
Smit, H. G. J., Volz-Thomas, A., Helten, M., Paetz, W., and Kley, D.: An in-flight calibration
25
method for near-real-time humidity measurements with the airborne MOZAIC sensor, J. At-mos. Ocean. Techn., 25, 656–666, doi:10.1175/2007jtecha975.1, 2008.
Solazzo, E., Bianconi, R., Pirovano, G., Moran, M. D., Vautard, R., Hogrefe, C., Appel, K. W., Matthias, V., Grossi, P., Bessagnet, B., Brandt, J., Chemel, C., Christensen, J. H., Forkel, R., Francis, X. V., Hansen, A. B., McKeen, S., Nopmongcol, U., Prank, M., Sartelet, K. N.,
30
ACPD
14, 18905–18942, 2014Technical Note: Reanalysis of upper troposphere humidity
data from the MOZAIC
H. Smit et al.
Title Page
Abstract Introduction
Conclusions References
Tables Figures
◭ ◮
◭ ◮
Back Close
Full Screen / Esc
Printer-friendly Version
Interactive Discussion
Discussion
P
a
per
|
Discus
sion
P
a
per
|
Discussion
P
a
per
|
Discussion
P
a
per
|
Solomon, S., Rosenlof, K. H., Portmann, R. W., Daniel, J. S., Davis, S. M., Sanford, T. J., and Plattner, G. K.: Contributions of stratospheric water vapor to decadal changes in the rate of global warming, Science, 327, 1219–1223, doi:10.1126/science.1182488, 2010.
Spichtinger, P., Gierens, K., and Read, W.: The statistical distribution law of relative humidity in the global tropopause region, Meteorol. Z., 11, 83–88,
doi:10.1127/0941-2948/2002/0011-5
0083, 2002.
Spichtinger, P., Gierens, K., Leiterer, U., and Dier, H.: Ice supersaturation in the tropopause region over Lindenberg, Germany, Meteorol. Z., 12, 143–156, doi:10.1127/0941-2948/2003/0012-0143, 2003.
Spichtinger, P., Gierens, K., Smit, H. G. J., Ovarlez, J., and Gayet, J.-F.: On the distribution of
10
relative humidity in cirrus clouds, Atmos. Chem. Phys., 4, 639–647, doi:10.5194/acp-4-639-2004, 2004.
Stohl, A., James, P., Forster, C., Spichtinger, N., Marenco, A., Thouret, V., and Smit, H. G. J.: An extension of Measurement of Ozone and Water Vapour by Airbus In-service Aircraft (MOZAIC) ozone climatologies using trajectory statistics, J. Geophys. Res., 106, 27757–
15
27768, doi:10.1029/2001jd000749, 2001.
Thouret, V., Cammas, J.-P., Sauvage, B., Athier, G., Zbinden, R., Nédélec, P., Simon, P., and Karcher, F.: Tropopause referenced ozone climatology and inter-annual variability (1994– 2003) from the MOZAIC programme, Atmos. Chem. Phys., 6, 1033–1051, doi:10.5194/acp-6-1033-2006, 2006.
20
Zbinden, R. M., Thouret, V., Ricaud, P., Carminati, F., Cammas, J.-P., and Nédélec, P.: Climatol-ogy of pure tropospheric profiles and column contents of ozone and carbon monoxide using MOZAIC in the mid-northern latitudes (24◦N to 50◦N) from 1994 to 2009, Atmos. Chem. Phys., 13, 12363–12388, doi:10.5194/acp-13-12363-2013, 2013.
Zöger, M., Afchine, A., Eicke, N., Gerhards, M. T., Klein, E., McKenna, D. S., Morschel, U.,
25
ACPD
14, 18905–18942, 2014Technical Note: Reanalysis of upper troposphere humidity
data from the MOZAIC
H. Smit et al.
Title Page
Abstract Introduction
Conclusions References
Tables Figures
◭ ◮
◭ ◮
Back Close
Full Screen / Esc
Printer-friendly Version
Interactive Discussion
Discussion
P
a
per
|
Discus
sion
P
a
per
|
Discussion
P
a
per
|
Discussion
P
a
per
|
Table 1.The MOZAIC fleet for the period 1994 to 2009.
Airline Call sign Operation period Fraction of flights
ACPD
14, 18905–18942, 2014Technical Note: Reanalysis of upper troposphere humidity
data from the MOZAIC
H. Smit et al.
Title Page
Abstract Introduction
Conclusions References
Tables Figures
◭ ◮
◭ ◮
Back Close
Full Screen / Esc
Printer-friendly Version
Interactive Discussion
Discussion
P
a
per
|
Discus
sion
P
a
per
|
Discussion
P
a
per
|
Discussion
P
a
per
|
Table 2.Mean and standard deviations of the differences between calibration coefficientsa(T) (offset) andb(T) (slope) for 1994 to 1997 (Helten et al., 1998) and 2000 to 2009.
period −20◦C −30◦C −40◦C
apost−apre bpost−bpre apost−apre bpost−bpre apost−apre bpost−bpre
1995–1997a mean −0.19 −0.01 −0.26 −0.011 −0.31 0.02
sdev 0.33 0.08 0.42 0.072 0.49 0.11
2000–2009b mean −0.26 −0.05 −0.26 0.00 −0.42 −0.01
sdev 0.39 0.05 0.53 0.06 0.65 0.12
ACPD
14, 18905–18942, 2014Technical Note: Reanalysis of upper troposphere humidity
data from the MOZAIC
H. Smit et al.
Title Page
Abstract Introduction
Conclusions References
Tables Figures
◭ ◮
◭ ◮
Back Close
Full Screen / Esc
Printer-friendly Version
Interactive Discussion
Discussion
P
a
per
|
Discus
sion
P
a
per
|
Discussion
P
a
per
|
Discussion
P
a
per
|
0 500 1000 1500 2000 2500 3000 3500
No. o
f fligh
ts
1994 1996 1998 2000 2002 2004 2006 2008 2010
0 2 4 6 8 10
No. o
f a
ircra
ft
Year
ACPD
14, 18905–18942, 2014Technical Note: Reanalysis of upper troposphere humidity
data from the MOZAIC
H. Smit et al.
Title Page
Abstract Introduction
Conclusions References
Tables Figures
◭ ◮
◭ ◮
Back Close
Full Screen / Esc
Printer-friendly Version
Interactive Discussion
Discussion
P
a
per
|
Discus
sion
P
a
per
|
Discussion
P
a
per
|
Discussion
P
a
per
|
–
Figure 5.Fractional coverage of MOZAIC upper troposphere humidity data for the period 1994 to 2009; data are confined byT <−40◦
C to exclude liquid water clouds and to limit to altitudes
≥8000 m.
ACPD
14, 18905–18942, 2014Technical Note: Reanalysis of upper troposphere humidity
data from the MOZAIC
H. Smit et al.
Title Page
Abstract Introduction
Conclusions References
Tables Figures
◭ ◮
◭ ◮
Back Close
Full Screen / Esc
Printer-friendly Version
Interactive Discussion
Discussion
P
a
per
|
Discus
sion
P
a
per
|
Discussion
P
a
per
|
Discussion
P
a
per
|
–
Figure 7.Typical behaviour of the temperature at different locations inside the environmental simulation chamber as a function of day time during a calibration run. Lower panel: temperature measured with different sensors (for details see corresponding explanations for details); upper panel: temperature difference between air flow (TAFL) and duct wall (TACH); plus temperature differences (TSi−TAFL) between the three MOZAIC hygrometers (TS1,TS2 andTS3) and the air flow (TAFL), respectively.
ACPD
14, 18905–18942, 2014Technical Note: Reanalysis of upper troposphere humidity
data from the MOZAIC
H. Smit et al.
Title Page
Abstract Introduction
Conclusions References
Tables Figures
◭ ◮
◭ ◮
Back Close
Full Screen / Esc
Printer-friendly Version
Interactive Discussion
Discussion
P
a
per
|
Discus
sion
P
a
per
|
Discussion
P
a
per
|
Discussion
P
a
per
|
– –
Figure 10.Long-term stability of calibration factors for randomly selected sensors; different colours represent different sensor units while symbols refer to pre-flight (+) and post-flight (o) calibrations.
ACPD
14, 18905–18942, 2014Technical Note: Reanalysis of upper troposphere humidity
data from the MOZAIC
H. Smit et al.
Title Page
Abstract Introduction
Conclusions References
Tables Figures
◭ ◮
◭ ◮
Back Close
Full Screen / Esc
Printer-friendly Version
Interactive Discussion
Discussion
P
a
per
|
Discus
sion
P
a
per
|
Discussion
P
a
per
|
Discussion
P
a
per
|
– –
1994 - 1999 2000 - 2009
Uncertainty RHliquid(%) Uncertainty RHliquid(%)
A
tl
ti
tud
e
(km)