FREE THEMES
1 Departamento de Farmácia Social. Faculdade de Farmácia. Universidade Federal de Minas Gerais (UFMG). Av Antônio Carlos 6627/1027, Pampulha. 31270-901 Belo Horizonte MG Brasil.
[email protected] 2 Departamento de Fisioterapia, Escola de Educação Física, Fisioterapia e Terapia Ocupacional, UFMG. Belo Horizonte MG Brasil.
3 Departamento de Psicologia, UFMG. Belo Horizonte MG Brasil. 4 Departamento de Esportes, Escola de Educação Física, Fisioterapia e Terapia Ocupacional, UFMG. Belo Horizonte MG Brasil.
Quality of life and associated characteristics: application
of WHOQOL-BREF in the context of Primary Health Care
Abstract This study aimed to identify the char-acteristics associated to quality of life (QOL) in users of four Basic Health Units (Unidades Bási-cas de Saúde, UBS) in Belo Horizonte, Minas Gerais. We conducted a cross-sectional study with 930 adult users enrolled in the selected UBS, using a questionnaire containing the WHOQOL-bref instrument and questions about sociodemograph-ic characteristsociodemograph-ics, lifestyle and health conditions. Following descriptive analysis, we performed sim-ple and multisim-ple linear regression to evaluate the association between the exposure variables and the QOL domains. The highest mean values of QOL were observed in the social relationships do-main. The lowest means were observed in the en-vironment domain, with a statistically significant difference between some of the UBS. The worst perceptions of QOL were related to worse health, housing, education and income conditions, as well as problems in social relationships and psycholog-ical conditions. Actions are needed to improve QOL in Primary Health Care users through ac-tions promoted by both health professionals and public managers.
Key words Quality of life, Basic health units, Pri-mary Health Care
Celline Cardoso Almeida-Brasil 1
Micheline Rosa Silveira 1
Kátia Rodrigues Silva 1
Marina Guimarães Lima 1
Christina Danielli Coelho de Morais Faria 2
Claudia Lins Cardoso 3
Hans-Joachim Karl Menzel 4
A
lme
ida-B
rasil CC
Introduction
Quality of life (QOL) is a multidimensional con-struct proposed as a health indicator of the pop-ulation and its evaluation is used to boost health
promotion actions1. QOL can be defined as
“in-dividual perception of one’s own stance in the context of the culture and value system in which one lives and in relation to one’s goals, expecta-tions, standards and concerns”, involving phys-ical, psychologphys-ical, independence level, social relationships, environment and spiritual pattern
domains2.
Characteristics such as functional capacity, pain, general health, vitality, social and emotion-al aspects and mentemotion-al heemotion-alth can be evemotion-aluated by
instruments that measure QOL3,4. The most used
instruments are generic, that is, they evaluate sev-eral aspects of the impact resulting from a health condition, such as functional capacity, pain and general health. Among the generic instruments, the Medical Outcomes Studies 36-item Short-Form (MOS SF-36), Medical Outcomes Studies 12-item Short-Form (MOS SF-12), EuroQol (EQ-5D) and WHOQOL-100 are the widely
used5,6. The WHOQOL-bref is an abbreviated
version of the WHOQOL-100 developed and recommended by the World Health Organiza-tion (WHO). It recognizes individual percep-tion and can assess QOL in different groups and
situations, regardless of educational level7. The
instrument has satisfactory psychometric
prop-erties and requires little application time7. This
instrument allows describing the subjective per-ception of individuals in relation to their physical and psychological health, social relationships and
the environment in which they live8.
It is observed that several studies performed in Brazil evaluated the QOL of individuals in spe-cific populations, such as the elderly and
preg-nant women,9-11 or in those with different health
problems12-14. On the other hand, few studies
have evaluated the QOL of the general popula-tion, with different health profiles, such as those
attended by the Primary Health Care (PHC)15.
PHC is patients’ gateway to the Unified Health System (SUS), with a capacity to respond to 85% of health needs and problems of the general population, with preventive, curative and health promotion services, as well as integrate care and
address the life context of individuals16.
Studies performed in the context of primary care observed a variability of QOL perception, pointing to the domain “social relationships” as the one with the greatest contribution to a good
QOL, and the “environment” domain with the
lowest contribution9,11,12,15,17. Diseases, low
ad-herence to treatment and low educational level are factors associated with poorer perception of
QOL in individuals serviced at PHC facilities18,19.
The Health Work Education Program (
Pro-grama de Educação pelo Trabalho em Saúde, PET-Saúde) was established within the Ministries of Health and Education through
Interministeri-al Ordinance Nº 421, dated March 3, 2010.20 In
Belo Horizonte, PET-Saúde III was developed in partnership between the Federal University
of Minas Gerais (Universidade Federal de Minas
Gerais, UFMG) and the Municipal Health
Secre-tariat21. The evaluation of QOL and knowledge
of the health profile of individuals seeking PHC care may provide information to support public health policies, such as the identification of health problems’ risk situations, as well as knowledge of the characteristics of the population served and environmental and social characteristics of the
territory of the Basic Health Units (Unidades
Básicas de Saúde, UBS) involved in the program. Thus, this study aimed to evaluate the quality of life and to identify its associated factors in users of four UBS of Belo Horizonte participating in the PET-Saúde III.
Methodology
This study is part of the project “Quality of life and health profile of individuals serviced at four
UBS in Belo Horizonte” – Pró-Vida Project, which
aimed to meet a demand of PET-Saúde III, under the thematic line of “Health Promotion and Pre-vention of Chronic Problems and Diseases”. The
Pró-Vida Project aimed mainly to characterize the health profile and evaluate the quality of life of the users served in the PHC. We selected four UBS where PET-Saúde research projects were de-veloped, in order to give continuity to UFMG’s activities in these UBS.
Four UBS from the Central-South, North-east, North and Venda Nova Health Districts participated in the study. According to data from the family register in the BH-Social Census sys-tem of the Belo Horizonte Municipality, in 2012, all UBS had more than 8,000 registered patients, of which 54% were women and 74% were adults. Regarding health resources, all UBS had at least three Family Health Teams.
e C
ole
tiv
a,
22(5):1705-1716,
2017
own care at the time of the interview, within the collection period of the study. Adult or child es-corts were not included. The sample was estimat-ed at 884 adult subjects, considering: (i) infinite
population; (ii) a priori prevalence of 50%, due
to the heterogeneity of the events evaluated; (iii) accuracy of 5%; (iv) 95% confidence interval; (v) drawing effect equal to 2; and (vi) 30% of possible refusals. We performed random sample selection and the approach was performed for every three individuals that visited the UBS, until achieving the minimum sample number estimated for each UBS (221 individuals). Individuals within the inclusion criteria were selected; they accepted to participate in the study and signed the Informed Consent Form (ICF).
Interviews were conducted by PET-Saúde academics previously trained with the proce-dures to be performed, from September 2013 to April 2014 in a reserved room within each UBS, through a semi-structured questionnaire, and all information obtained was self-reported. The da-tabase was created in EPI Info version 3.5.4 (Cen-ter for Disease Control and Prevention, Atlanta, USA) and data entry quality control was per-formed, with 10% replication of entry for each UBS. The reliability analysis among typists was performed using kappa statistics, with the mean
kappa being κ = 0.97 for UBS Central-South, κ
= 1.00 for UBS Northeast, κ = 0.97 for the UBS
North and κ = 0.99 for UBS Venda Nova,
indicat-ing excellent agreement in all UBS. The reliability analysis of the questionnaire was performed by interview repeats in 10% of the sample,
obtain-ing κ = 1.00.
The response variable was QOL. We used the WHOQOL-bref tool to assess QOL, consisting of 26 questions, two of which were overall quality of life (Overall QOL) and the others represent-ed each of the 24 facets underlying the original instrument and are divided into four domains, namely: “Physical” (physical pain and discom-fort, medication/treatment dependence, energy and fatigue, mobility, sleep and rest, daily life ac-tivities and ability to work); “psychological” (pos-itive and negative feelings, spirituality/personal beliefs, learning/memory /concentration, accep-tance of body image and looks and self-esteem); “social relationships” (personal relationships, sexual activity and assistance/social support); and “environment” (physical safety, physical en-vironment, financial resources, new information/ skills, recreation and leisure, home environment, health care and transportation). The WHO-QOL-bref questions are formulated for responses
on Likert-type scales, including intensity (“not at all” to “extremely”), ability (“not at all” to “com-pletely”), frequency (“never” to “always”), and evaluation (“very dissatisfied” to “very satisfied”; “very poor” to “very good”). Scores of each do-main were transformed into a scale from 0 to 100 and expressed in terms of means, as
recommend-ed by the manual producrecommend-ed by the WHOQOL7
team, with higher means suggesting a better per-ception of QOL.
Explanatory variables were organized into: (i) sociodemographic characteristics (gender, skin color, age, living with partner, schooling, own in-come, occupation and number of people in the household); and (ii) lifestyle characteristics and health conditions (smoking habit, use of alcohol-ic beverages, chronalcohol-ic diseases, use of drugs in the last 15 days and self-reported health).
Regarding data descriptive analysis, the fre-quency of the explanatory variables and the mean and standard deviation (SD) for each QOL domain were determined. We used t-test and ANOVA, through Tukey tests (if equal variances assumed) or Games-Howell (if equal variances not assumed) to analyze associations between the explanatory variables and QOL domains. Vari-ables that showed p < 0.20 in the univariate anal-ysis were inserted into the multiple linear regres-sion model, performed for each WHOQOL-bref domain. The analysis of residuals showed normal distribution and constant variance in the linear regression of each domain. We performed anal-yses in SPSS version 19.0 (SPSS Inc., Chicago, United States).
Both the Research Ethics Committee of the Municipal Health Secretariat of Belo Horizonte and the Research Ethics Committee of UFMG (COEP-UFMG) approved this study.
Results
A total of 930 patients from the four UBS un-der study were interviewed (Central-South: 193, Northeast: 226, North: 220, Venda Nova: 291). Losses and refusals accounted for less than 1%, with lack of time being the main reason reported.
A
lme
ida-B
rasil CC
(72.4%). Regarding lifestyle characteristics and health conditions, most of the sample were non-smokers (66.6%), did not use alcoholic
beverag-es or used it on occasions (98.3%), had at least one chronic disease (64.4%), used a medication in the last 15 days (77.4%) and self-reported
Table 1. Characteristics of the total population (n = 930) and stratified by Basic Health Units (UBS) of four health districts of Belo Horizonte - MG, Brazil, 2014.
UBS district Central-South (n = 193)
Northeast (n = 226)
North (n = 220)
Venda Nova (n = 291)
Total (n = 930)
Variables n* % n* % n* % n* % n* %
Sociodemographic Gender
Female 157 81.3 180 79.6 171 77.7 235 80.8 743 79.9 Male 36 18.7 46 20.4 49 22.3 56 19.2 187 20.1 Skin color
White 14 7.3 51 23.3 44 20.1 56 19.3 165 17.9 Other 178 92.7 168 76.7 175 79.9 234 80.7 755 82.1 Age group
18-39 100 51.8 79 34.9 75 34.1 129 44.3 383 41.2 40-59 65 33.7 84 37.2 92 41.8 106 36.4 347 37.3
≥ 60 28 14.5 63 27.9 53 24.1 56 19.3 200 21.5
Living with a partner
Yes 87 45.1 99 43.8 100 45.7 161 55.5 448 48.2 No 106 54.9 127 53.2 119 54.3 129 44.5 482 51.8 Schooling
Under 8 years of study 152 78.8 118 52.2 153 69.5 179 61.5 602 64.7 8+ years of study 41 21.2 108 47.8 67 30.5 112 38.5 328 35.3 Own income
Yes 145 75.1 170 75.6 162 73.6 196 67.4 673 72.4
No 48 24.9 55 24.4 58 26.4 95 32.6 256 27.6
Occupation
Yes 123 65.1 121 56.5 91 45.7 140 51.1 475 54.2 No 66 34.9 93 43.5 108 54.3 134 48.9 401 45.8 Living with how many people
Living alone 6 3.1 12 5.3 4 1.8 12 4.1 34 3.7 Under 3 people 118 61.1 124 54.9 118 53.6 168 57.8 528 56.7 3+ people 69 35.8 90 39.8 98 44.6 111 38.1 368 39.6 Lifestyle and health conditions
Smoker
Yes 71 36.8 71 31.4 72 32.7 88 33.1 302 33.4
No 122 63.2 155 68.6 148 67.3 178 66.9 603 66.6 Use of alcoholic beverages
Never or occasionally 156 96.3 221 98.7 207 98.6 277 98.9 861 98.3 Twice or more per week 6 3.7 3 1.3 3 1.4 3 1.1 15 1.7 Chronic disease**
Yes 115 60.8 142 64.3 140 65.1 190 66.4 587 64.4
No 74 39.2 79 35.7 75 34.9 96 33.6 324 35.6
Use of drugs in the last 15 days
Yes 147 76.2 171 75.7 176 81.1 232 80.0 717 77.4
No 46 23.8 55 24.3 41 18.9 58 20.0 209 22.6
Self-reported health
Good - excellent 99 51.8 148 65.5 117 53.9 170 59.4 534 58.0 Average - bad 92 48.2 78 34.5 100 46.1 116 40.6 386 42.0
e C
ole
tiv
a,
22(5):1705-1716,
2017
health as good or excellent (58.0%). The most frequent chronic diseases were hypertension (36.0%), depression (29.6%), diabetes (14.2%), arthritis, osteoarthritis or rheumatism (14.2%) and asthma (10.3%). In general, the characteris-tics of the participants showed the same pattern among the UBS, and the greatest differences were observed between the UBS of the Central-South and Northeast districts, mainly in the sociode-mographic characteristics. Compared with other UBS, the lowest proportion of participants en-rolled in UBS Central-South was white, and the highest proportion was young, with low school-ing and worse self-reported health (Table 1).
QOL’s mean values in the domains were dif-ferent among the UBS of the study. In all do-mains the Northeast unit had a higher mean and the Central-South unit had a lower mean (Table 2). The highest means were observed for the so-cial relationships domain, both in each UBS and in the total population of the four units, while the lowest means were observed for the environ-ment domain. In this domain, the UBS of the Central-South district had a significantly lower QOL mean than the means of the Venda Nova and Northeast units. UBS North also had lower average than UBS Northeast in the environmen-tal domain (Table 2).
In the univariate analysis shown in Table 3, overall QOL mean values were lower for individ-uals between 40 and 59 years (p < 0.001), with up to eight years schooling (p < 0.001), with-out own income (p = 0.003), unemployed (p < 0.001), smokers (p = 0.015), with some chronic disease (p < 0.001), using some medication (p < 0.001) and with fair or poor self-reported health (p < 0.001). For the physical, psychological and social relationships domains, the associated char-acteristics were similar to those of overall QOL, differing only in (i) the age for the physical
do-main, where the lowest mean was for individu-als older than 60 years (p < 0.001); (ii) gender for the psychological domain, where women had lower mean (p < 0.002); and (iii) the number of people in the household for the domain of social relationships, where patients living alone showed lower mean (p = 0.041). In the environment do-main, the lowest means were for females (p = 0.007), for patients aged between 40 and 59 years (p < 0.001), with up to eight years of study (p < 0.001), without own income (p < 0.001), smok-ers (p = 0.011), with chronic disease (p = 0.004) and who self-referred their health as fair or poor (p < 0.001).
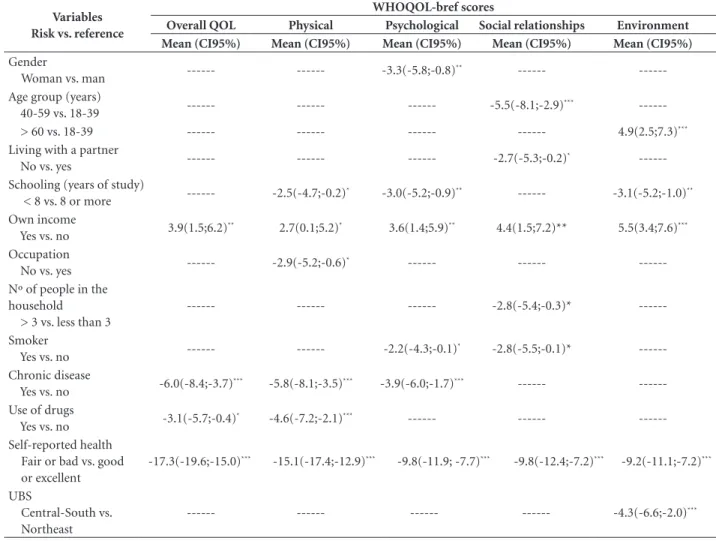
The results of the multivariate regression analysis are shown in Table 4. After the adjusted analysis, self-reported income and self-reported health were the only variables that remained as-sociated with overall QOL and QOL in all four domains. Individuals with own income scored 2.7 to 5.5 points higher in QOL means than those depending on the income of other peo-ple. Individuals who reported their own health as fair or poor decreased from 9.2 to 17.3 points in the mean of overall QOL and in the four do-mains, in relation to those who considered health as good or excellent. Individuals with less than eight years of schooling had a worse perception in the QOL the physical, psychological and en-vironmental domains, compared to those with schooling above 8 years. Chronic diseases were negatively associated with overall QOL and in the physical and psychological domains. Drug use was associated only with overall QOL and in the physical domain. Individuals who reported using tobacco had lower means than nonsmok-ers in the psychological and social relationships domains. Living in places with more than three people in the household was negatively associat-ed with the domain of social relationships, as well
Table 2. Distribution of mean quality of life (QOL) scores in each WHOQOL-bref domain for the total population (n = 930) and stratified by Basic Health Units (UBS) of four health districts of Belo Horizonte – MG, 2014.
Domains and Overall QOL
UBS (mean ± standard deviation)
All UBS Central-South Northeast North Venda Nova
Physical 63.0 ± 18.1 61.0 ± 18.4 64.7 ± 18.5 62.1 ± 17.6 63.8 ± 18.0 Psychological 66.5 ± 16.3 64.9 ± 17.7 68.2 ± 15.7 66.5 ± 16.7 66.2 ± 15.4 Social relationships 68.2 ± 20.4 67.2 ± 20.7 69.3 ± 20.7 68.0 ± 20.1 68.0 ± 20.3 Environment 52.4 ± 15.5 48.0 ± 16.2* 56.0 ± 16.0** 51.6 ± 15.6* 53.3 ± 13.7**
Overall QOL 65.2 ± 19.2 63.9 ± 18.8 68.2 ± 19.4 64.0 ± 20.0 64.6 ± 18.4
A
lme
ida-B
rasil CC
as living without a partner. The gender variable only remained associated to the psychological domain, and women evidenced worse percep-tion of QOL than men. There was a negative
as-sociation between QOL in the physical domain and individuals without occupation. Regarding age, considering as reference the age group 18-39 years, individuals between 40 and 59 years old
Table 3. Univariate association between exposure variables and quality of life (QOL) in patients attended at Basic Health Units (UBS) of four health districts of Belo Horizonte – MG, Brazil, 2014.
WHOQOL-bref scores (Mean (SD)) Variables Overall
QOL Physical Psychological
Social
relationships Environment
Gender
Female 65.0 (19.5) 62.7 (18.4) 65.6 (16.8) 67.7 (21.1) 51.7 (15.6) Male 66.1 (17.8) 64.5 (17.0) 69.8 (13.4) 70.0 (17.0) 55.1 (14.6)
P value 0.450 0.230 0.002 0.195 0.007
Skin color
White 64.4 (20.1) 61.7 (18.4) 67.7 (15.2) 69.1 (20.8) 54.2 (15.3) Other 65.2 (18.9) 63.2 (18.0) 66.0 (16.5) 67.8 (20.3) 52.0 (15.3)
P value 0.622 0.280 0.244 0.467 0.095
Age group
18-39 69.8 (18.1) 67.9 (16.5) 68.2 (15.6) 71.4 (19.8) 52.6 (15.1) 40-59 61.8 (19.5) 59.9 (18.4) 64.6 (17.1) 63.7 (21.4) 50.2 (15.9) > 60 62.2 (18.8) 58.9 (18.1) 66.2 (15.7) 69.5 (18.2) 55.8 (14.7) P value < 0.001 < 0.001 0.014 < 0.001 < 0.001 Living with a partner
Yes 66.0 (17.9) 63.1 (17.7) 67.1 (15.5) 69.5 (19.4) 51.9 (14.5) No 64.4 (20.2) 62.9 (18.4) 65.8 (16.9) 66.9 (21.2) 52.8 (16.3)
P value 0.219 0.877 0.204 0.055 0.378
Schooling
Under 8 years of study 62.9 (19.0) 60.2 (18.1) 64.3 (16.3) 66.3 (21.6) 50.4 (15.1) 8+ years of study 69.3 (18.7) 68.2 (16.9) 70.3 (15.4) 71.4 (19.5) 56.0 (15.3) P value < 0.001 < 0.001 < 0.001 < 0.001 < 0.001 Own income
Yes 66.3 (18.5) 64.2 (17.3) 67.8 (15.6) 69.4 (19.9) 54.1 (15.2) No 62.1 (20.4) 59.8 (19.6) 62.6 (17.3) 64.5 (21.2) 47.7 (14.8) P value 0.003 0.001 < 0.001 0.001 < 0.001 Occupation
Yes 67.2 (18.0) 66.2 (16.2) 68.0 (15.6) 69.2 (20.2) 52.4 (15.4) No 62.2 (20.2) 59.2 (19.4) 64.4 (16.8) 66.4 (20.8) 62.3 (15.6) P value < 0.001 < 0.001 0.001 0.049 0.922 Living with how many people
Living alone 65.4 (19.4) 60.1 (18.9) 67.1 (17.2) 64.0 (26.0) 57.3 (16.3) Under 3 people 64.8 (19.4) 63.4 (17.6) 67.0 (16.1) 69.5 (20.0) 52.6 (15.9) 3+ people 65.6 (18.8) 62.7 (18.7) 65.5 (16.4) 66.4 (20.1) 51.6 (14.6)
P value 0.826 0.548 0.415 0.041 0.109
Smoker
Yes 63.0 (19.7) 60.8 (18.5) 63.7 (16.9) 64.8 (20.5) 50.4 (14.8) No 66.3 (18.9) 64.0 (17.8) 67.7 (15.8) 69.7 (19.9) 53.2 (15.6)
P value 0.015 0.014 0.001 0.001 0.011
Use of alcoholic beverages
Never or occasionally 65.4 (18.9) 63.2 (17.9) 66.6 (16.1) 68.4 (20.4) 52.5 (15.2) Twice or more per week 58.3 (26.1) 57.7 (23.1) 58.7 (22.7) 62.7 (19.3) 54.5 (18.1)
P value 0.151 0.238 0.063 0.286 0.612
e C
ole
tiv
a,
22(5):1705-1716,
2017
Table 3. continuation
WHOQOL-bref scores (Mean (SD))
Variables Overall QOL Physical Psychological Social
relationships Environment
Chronic disease
Yes 60.9 (19.7) 58.7 (18.5) 63.9 (16.9) 65.6 (21.2) 51.2 (15.7) No 72.8 (15.2) 70.8 (14.2) 71.0 (13.7) 72.4 (18.1) 54.3 (14.5) P value < 0.001 < 0.001 < 0.001 < 0.001 0.004 Use of drugs*
Yes 63.0 (19.2) 60.6 (18.2) 65.4 (16.5) 67.1 (20.2) 51.9 (15.4) No 72.3 (16.8) 71.2 (15.2) 69.9 (14.9) 71.5 (20.7) 54.0 (15.5) P value < 0.001 < 0.001 < 0.001 0.006 0.090 Self-reported health
Good - excellent 73.5 (15.1) 70.8 (14.4) 71.3 (13.5) 72.6 (18.7) 56.5 (14.7) Average - bad 53.7 (18.0) 52.3 (17.1) 59.6 (17.4) 62.0 (21.0) 46.7 (14.7) P value < 0.001 < 0.001 < 0.001 < 0.001 < 0.001
* In the last 15 days; SD: Standard deviation.
Notes: Statistical tests: Student’s t-test and ANOVA (Tukey for presumed equal variances and Games-Howell for equal non-presumed variances).
Table 4. Final multivariate model of the factors associated with mean quality of life (QOL) in patients attended at Basic Health Units (UBS) of four health districts of Belo Horizonte – MG, Brazil, 2014.
Variables Risk vs. reference
WHOQOL-bref scores
Overall QOL Physical Psychological Social relationships Environment Mean (CI95%) Mean (CI95%) Mean (CI95%) Mean (CI95%) Mean (CI95%)
Gender
Woman vs. man --- --- -3.3(-5.8;-0.8)** --- ---Age group (years)
40-59 vs. 18-39 --- --- --- -5.5(-8.1;-2.9)*** > 60 vs. 18-39 --- --- --- --- 4.9(2.5;7.3)***
Living with a partner
No vs. yes --- --- --- -2.7(-5.3;-0.2)* ---Schooling (years of study)
< 8 vs. 8 or more --- -2.5(-4.7;-0.2)* -3.0(-5.2;-0.9)** --- -3.1(-5.2;-1.0)** Own income
Yes vs. no 3.9(1.5;6.2)** 2.7(0.1;5.2)* 3.6(1.4;5.9)** 4.4(1.5;7.2)** 5.5(3.4;7.6)*** Occupation
No vs. yes --- -2.9(-5.2;-0.6)
* --- ---
---Nº of people in the household > 3 vs. less than 3
--- --- --- -2.8(-5.4;-0.3)*
---Smoker
Yes vs. no --- --- -2.2(-4.3;-0.1)
* -2.8(-5.5;-0.1)*
---Chronic disease
Yes vs. no -6.0(-8.4;-3.7)*** -5.8(-8.1;-3.5)*** -3.9(-6.0;-1.7)*** --- ---Use of drugs
Yes vs. no -3.1(-5.7;-0.4)* -4.6(-7.2;-2.1)*** --- --- ---Self-reported health
Fair or bad vs. good or excellent
-17.3(-19.6;-15.0)*** -15.1(-17.4;-12.9)*** -9.8(-11.9; -7.7)*** -9.8(-12.4;-7.2)*** -9.2(-11.1;-7.2)***
UBS
Central-South vs. Northeast
--- --- --- --- -4.3(-6.6;-2.0)***
A
lme
ida-B
rasil CC
showed worse perception of QOL in the social relationships domain and elderly showed a better perception in the environment domain. Final-ly, patients serviced at UBS Central-South had worse perception of QOL in the environmental domain than those seen at UBS Northeast.
Discussion
This study evaluated the QOL perceived by users who sought care at four UBS in the city of Belo Horizonte, in order to subsidize the diagnosis of the health situation of the population served in PHC services. The general characteristics of the population found in this study, such as the pre-dominance of women and low schooling were similar to those observed in other studies
per-formed with SUS users in Brazil22,23. The same
oc-curs with regard to the profile of chronic diseases, which was similar to that found in a study carried out in three UBS in Rio Grande do Sul, where the most prevalent diseases were circulatory diseases followed by mental, endocrine, musculoskeletal
and respiratory diseases12.
The mean QOL observed in the four domains and in the overall QOL were lower than those commonly reported by other authors. However, the QOL pattern in the domains was similar to that of other Brazilian studies, with the domain social relationships showing a better mean and the environment domain scoring a lower mean, usually because they are carried out in commu-nities that are located in areas of greater social
vulnerability12,15,17.
Social vulnerability may be the reason for the difference in the environmental domain among UBS. In order to diagnose the health situation of the municipality of Belo Horizonte, which involves adverse environmental and social con-ditions, the Municipal Health Secretariat of Belo Horizonte periodically carries out the calcula-tion of the Health Vulnerability Index (HVI) ac-cording to the distribution of the census tracts
(CT)24. According to the distribution of CTs of
Belo Horizonte by category of HVI, in 2012, it was observed that UBS Central-South region was a high vulnerability risk location, with the high-est HVI of all UBS included in the study, followed by UBS North, Venda Nova and Northeast, and
the latter two were considered low risk24. One
study observed that the health conditions of Belo Horizonte’s elderly varied according to the HVI, with the worst conditions associated with high
risk areas25. Podestá et al.15 also observed that the
location of UBS influenced patients’ QOL, espe-cially in the units located in peripheral regions. Since the lowest mean QOL was observed for the environmental domain, it is worth outlining the importance of investments and development and urban planning policies aiming to improve the QOL of populations living in vulnerable areas.
After multivariate analysis, age remained as-sociated with QOL in the domains of social and environmental relationships. In the social rela-tionships domain, subjects aged 40 to 59 years showed worse perception of QOL than did young adults. This can be justified by the conception that young adults are at the stage of life in which the functional peak of network of relationships is achieved, whereas entering the labor market, marriage and children take some time that was previously dedicated to friendships, where the leisure of older adults involves more family than
friends26. In the environment domain, elderly
in-dividuals evidenced a better perception of QOL than did young adults. This result was also
ob-served by other studies18,27 and may be related to
the provision of more adequate and safe environ-ments for the elderly, such as long-term institu-tions, since adequate housing and physical envi-ronment have a positive influence on the elderly’s
QOL28. In a study by Vitorino et al.29, elderly
indi-viduals in the community had lower QOL in the environment domain compared to the elderly in long-term institutions.
Socioeconomic factors, such as income, schooling and occupation show the same pattern in relation to QOL, since low schooling is related to inequalities in income distribution and lower
insertion in the labor market30,31. In this study,
having own income was associated with a better overall QOL and in all domains. Similar results
were found by Azevedo et al.12, who observed that
lower social classes demonstrated worse QOL in all four domains. These results were also found in a study carried out with Iranian women, where being satisfied with their own income resulted in
better QOL, also in the four domains32.
Regard-ing individuals with low educational level, the association was stronger in the psychological and environmental domains and was not significant for the social relationships domain, and this re-sult was also observed by other authors in a study
with Brazilian elderly33. Not being employed, in
e C
ole
tiv
a,
22(5):1705-1716,
2017
to life, elevates status and boosts human being’s
growth34. Regarding gender, women evidenced
worse perception of QOL than men in all do-mains, but only for the psychological domain the difference was statistically significant. The same
result was observed by other authors19,27,35, and
the relationship between female gender and psy-chosocial factors is well reported in studies in the literature, where women reported having more negative feelings, low self-esteem and depression
than men36,37. Living without partners was
asciated with a lower perception of QOL in the so-cial relationship domains, as observed by other
authors12,19,38. Individuals without partners tend
to perform poorly on structural aspects of social support networks, such as less contact with fam-ily and friends and low frequency of assistance
received and provided39.
In this study, the number of people per res-idence ranged from zero to 15, with a mean of 3.27 people per household, very close to the mean observed for Brazil (3.3), according to data from the Brazilian Institute of Geography
and Statistics (Instituto Brasileiro de Geografia e
Estatística, IBGE) of 201040. Data found in the four UBS evaluated showed that living with more than three people in the same household was as-sociated with a worse perception of QOL in the social relationships domains. The United Nations Human Settlements Program (UN-HABITAT) considers the “sufficient area to live” as a domain to be evaluated for the monitoring of poor settle-ments, with a recommendation of no more than two people sharing the same dormitory, in order to create an adequate space for the development
of human relationships and social interaction40,41.
As for habits and lifestyle, being a smoker was associated with a worse QOL in the psychological and social relationships domains. In agreement, other studies have observed that smokers have lower QOL rates when compared to nonsmokers, mainly in the psychological and social relation-ships domains, and the greater the
tobacco-de-pendence level, the greater the QOL loss42-44. In
the psychological domain, this result can be justi-fied by the fact that some psychiatric symptoms, such as anxiety and depression, are related to
smoking and these could result in worse QOL
44-47. In relation to the social relationships domain,
smoking has changed from acceptable social be-havior to a socially undesirable habit, and this has exerted a negative influence on social
rela-tionships48.
Regarding health conditions, chronic diseases was associated with a worse overall QOL and in
the physical and psychological domains. Chronic diseases are more likely to limit daily activities due to physical symptoms such as pain and discom-fort, which may decrease the functional capacity of individuals and negatively reflect their QOL,
especially in the physical domain19,49-52.
Like-wise, in the psychological domain, limitations imposed by chronic diseases’ impact on mental health, perception about feelings and self-image,
which can significantly decrease their QOL49-51.
As observed in this study, a negative association between pharmacological treatment and QOL has been demonstrated in the physical domain. A possible explanation would be that the use of medication is associated with a lower autonomy
of the patient, which in turn reduces QOL53-55.
It is important to emphasize that depending on drugs or treatments can be seen both as a QOL worsening factor by the decrease of autonomy, and of improvement by the beneficial effect that
some medications and/or treatments provide56.
Regarding self-reported health, fair or poor health was associated with poor quality of life in the overall QOL and in all WHOQOL-bref do-mains, and overall QOL, which corresponds to the “evaluation of the quality of life” and “satis-faction with health” was the one that was most strongly associated with this negative
self-per-ception. Azevedo et al.57 verified that individuals
who perceive themselves as healthy show a better evaluation of overall QOL. Health self-percep-tion is a good predictor of mortality and other health indicators, and reflects the individual’s perception of own health and includes the
bio-logical and psychosocial domains58. In
compari-son with the other domains, the physical domain had the greatest negative association between fair or poor self-perceived health and QOL. This may be related to chronic diseases or to lifestyle habits, such as smoking and sedentary lifestyle, which are associated with poor self-perception
of individual health59. Health can be determined
and conditioned, in the perception of the indi-vidual, by a series of determinants of health, such as living and working conditions, psychosocial, economic, cultural factors and individual
behav-iors57,60. These axes that integrate the
determi-nants of health are embedded in the characteris-tics of the psychological, social and environmen-tal domains, related to the findings of this study, where there was an association between fair or poor self-perceived health with worse QOL in these domains.
be-A
lme
ida-B
rasil CC
tween the individuals attended in four UBS of the city of Belo Horizonte regarding socioeconomic, clinical and life habits. These results should be interpreted with caution because of the difficulty in establishing a direct causal relationship, since this is a cross-sectional design study. The exis-tence of acute diseases at the time of the inter-view was not investigated and it was not possible to evaluate their impact on the QOL. However, drug use and self-reported health may be indic-ative of disease or malaise, suggesting that acute illness at the time of the interview may have con-tributed to a worse perception of QOL. Another limitation refers to the very nature of question-naires used, including the WHOQOL-bref, since they are self-reporting instruments subject to response bias, that is, tendencies to distort the response toward a favorable direction, thus de-nying socially undesirable traits and behaviors. However, WHOQOL-bref is a practical instru-ment with satisfactory psychometric properties and is the most widely used QOL assessment tool worldwide and recommended by WHO. It can be inferred, therefore, that worse QOL perceptions were related to worse health and housing con-ditions, low schooling and family income,
prob-lems in social relationships and psychological conditions, suggesting a lack of health resources, culture, education, leisure and sanitation, among others, that directly affect people’s QOL.
Most QOL studies have been performed in specific populations, such as the elderly or in-dividuals with a defined health profile, and few studies have been conducted on the general population served in PHC services. This study highlights the importance of actions to improve QOL in Primary Care users through actions pro-moted by both health professionals and public managers. These actions include: (i) education-al campaigns, such as the preparation of book-lets and the strengthening and dissemination of operational groups in the UBS; (ii) training of health professionals and expanded human re-sources in health services, such as psychologists, physiotherapists, pharmacists, among others; (iii) improvement of public policies regarding urban infrastructure, sanitation, social support and promotion. These measures can bring ben-efits and reflect positively on the quality of life of individuals and should be prioritized by the stakeholders involved in the setting of Primary Health Care.
Collaborations
CC Almeida-Brasil and KR Silva wrote the man-uscript, performed data analysis and interpreted the results. MR Silveira participated in study de-sign, interpretation of results and critically re-viewed the article. MG Lima, CDCM Faria, CL Cardoso and HJK Menzel participated in study design and approved the final version of the ar-ticle. MGB Ceccato participated in study design, interpretation of results, critically reviewed the article and supervised all study steps.
Acknowledgment
The authors gratefully acknowledge the Health Work Education Program (PET-Saúde) III, of which this research was product, and Luana Faria, Laís Lessa and Tarsilla Spezialli Cardoso for the technical support and constructive sug-gestions.
e C
ole
tiv
a,
22(5):1705-1716,
2017
References
1. Campos MO, Neto JFR. Qualidade de vida: um ins-trumento para promoção da saúde. Rev Baiana Saúde Pública 2008; 32(2):232-240.
2. The WHOQOL Group. The World Health Organiza-tion Quality of Life assessment (WHOQOL):PosiOrganiza-tion paper from the World Health Organization. Soc. Sci. Med. 1995; 41(10):1403-1409.
3. Castro PC, Driusso P, Oishi J. Convergent validity be-tween SF-36 and WHOQOL-BREF in older adults. Rev Saude Publica 2014; 48(1):63-67.
4. The WHOQOL Group. The development of the World Health Organization WHOQOL-BREF quality of life assessment. Psychol. Med. 1998; 28(3):551-558. 5. Landeiro GMB, Pedrozo CCR, Gomes MJ, Oliveira
ERA. Revisão sistemática dos estudos sobre qualidade de vida indexados na base de dados SciELO. Cien Saude Colet 2011; 16(10):4257-4266.
6. Masson VA, Monteiro MI, Vedovato TG. Qualidade de vida e instrumentos para avaliação de doenças crôni-cas - revisão de literatura. In: Vilarta R, Gutierrez GL, Monteiro MI, editores. Qualidade de vida: evolução dos conceitos e prática no século XXI. Campinas: IPES; 2010. p. 45-54.
7. Fleck MPA. A avaliação da qualidade de vida: guia para profissionais da saúde. Porto Alegre: Artmed; 2008. 8. Kluthcovsky AC, Kluthcovsky FA. WHOQOL-bref,
um instrumento para avaliar qualidade de vida: uma revisão sistemática. Rev Psiquiatr Rio Gd Sul 2009; 31(3 Supl.):12.
9. Braga MCP, Casella MA, Campos MLN, Paiva SP. Qua-lidade de vida medida pelo Whoqol-bref: Estudo com idosos residentes em Juiz de Fora/MG. Rev APS 2011; 14(1):93-100.
10. Castro DFA, Fracolli LA. Qualidade de vida e promo-ção da saúde: em foco as gestantes. O Mundo da Saúde 2013; 37(2):159-165.
11. Santos AS, Silveira RE, Sousa MC, Monteiro T, Silvano CM. Perfil de saúde de idosos residentes em um muni-cípio do interior mineiro. REAS 2012; 1(1):80-90. 12. Azevedo ALS, Silva RA, Tomasi E, Quevedo LA.
Doen-ças crônicas e qualidade de vida na atenção primária à saúde. Cad Saude Publica 2013; 29(9):1774-1782 13. Correr CJ, Pontarolo R, Melchiors AC, Rossignoli P,
Fernández-Llimós F, Radominski RB. Tradução para o Português e Validação do Instrumento Diabetes Quali-ty of Life Measure (DQOL-Brasil). Arq. Bras Endocrinol Metab 2008; 52(3):515-522.
14. Miranzi SSC, Ferreira FS, Iwamoto HH, Pereira GA, Miranzi MAS. Quality of life for diabetic and hyper-tensious individual accompanied by the family health team. Texto & Contexto Enferm 2008; 17(4):672-679. 15. Podestá MHMC, Souza WA, Vilas Boas OMGC,
Mar-tins AD, Braz CL, Ferreira EB. Qualidade de vida dos usuários da Atenção Primária à Saúde: perfil e fatores que interferem. RUVRD 2013; 11(2):316-326
16. Conselho Nacional de Secretários de Saúde (CONASS). Atenção Primária e Promoção da Saúde. Brasília: CO-NASS; 2007.
17. Stival MM, Lima LR, Funghetto SS, Silva AO, Pinho DLM, Karnikowski MGO. Fatores associados à quali-dade de vida de idosos que frequentam uma uniquali-dade de saúde do Distrito Federal. Rev Bras Geriatr Gerontol 2014; 17(2):395-405.
18. Dawalibi NW, Goulart RM, Prearo LC. Fatores re-lacionados à qualidade de vida de idosos em pro-gramas para a terceira idade. Cien Saude Colet 2014; 19(8):3505-3512.
19. Ha NT, Duy HT, Le NH, Khanal V, Moorin R. Quality of life among people living with hypertension in a rural Vietnam community. BMC Public Health 2014; 14:833 20. Brasil. Portaria Interministerial nº 421, de 3 de
mar-ço de 2010. Institui o PET-Saúde, para a formação de grupos de aprendizagem tutorial em áreas estratégicas para o SUS. Diário Oficial da União 2010; 4 mar. 21. Brasil. Ministério da Saúde. Edital nº 24, de 15 de
de-zembro de 2011. Seleção de projetos de instituições de educação superior. [acessado 2014 set 25]. Disponível em: http://www.prosaude.org/noticias/2012edital/in-dex. php
22. Novais M, Martins CB, Cechin J. Perfil dos beneficiários de planos e SUS e o acesso a serviços de saúde-PNAD 2003 e 2008. São Paulo: Instituto de Estudos de Saúde Suplementar; 2010.
23. Ribeiro MCSA, Barata RB, Almeida MF, Silva ZP. Perfil sociodemográfico e padrão de utilização de serviços de saúde para usuários e não-usuários do SUS - PNAD 2003. Cien Saude Colet 2006; 11(4):1011-1022. 24. Secretaria Municipal de Saúde de Belo Horizonte.
Índi-ce de vulnerabilidade à saúde 2012. [aÍndi-cessado 2014 out 13]. Disponível em: http://portalpbh.pbh.gov.br/pbh/ ecp/contents.do?evento = conteudo&idConteudo = 151852&chPlc = 151852&&pIdPlc = &app = salanoticias 25. Braga LS, Macinko J, Proietti FA, César CC, Lima-Costa MF. Diferenciais intra-urbanos de vulnerabilidade da população idosa. Cad Saude Publica 2010; 26(12):2307-2315.
26. Souza LK, Hutz CS. Relacionamentos pessoais e sociais: amizade em adultos. Psicol Estud 2008; 13(2):257-265. 27. Xia P, Li N, Hau KT, Liu C, Lu Y. Quality of life of
Chinese urban community residents: a psychometric study of the mainland Chinese version of the WHO-QOL-BREF. BMC Med Res Methodol 2012; 12:37. 28. O’Shea E. La mejora de La calidad de vida de las
perso-nas mayores dependientes. Boletín sobre el envejecimien-to: Perfiles y Tendencias. Madrid: Instituto de Migracio-nes y Servicios Sociales; 2003.
29. Vitorino LM, Paskulin LMG, Vianna LAC. Qualidade de vida de idosos da comunidade e de instituições de longa permanência: estudo comparativo. Rev Latino -Am Enfermagem 2013; 21(Spe.):3-11.
30. Letelier ME. Escolaridade e inserção no mercado de trabalho. Cad Pesquisa 1999; 107:133-148.
31. Salvato MA, Ferreira, PCG, Duarte AJM. O impacto da escolaridade sobre a distribuição de renda. Estud Econ 2010; 40(4):753-791.
32. Keshavarzi S, Ayatollahi SM, Zare N, Sharif F. Quali-ty of life of childbearing age women and its associated factors: an application of seemingly unrelated regres-sion (SUR) models. Qual Life Res 2013; 22(6):1255-1263.
33. Paskulin L, Vianna L, Molzahn AE. Factors associated with quality of life of Brazilian older adults. Int Nurs Rev 2009; 56(1):109-115.
A
lme
ida-B
rasil CC
35. Gholami A, Jahromi LM, Zarei E, Dehghan A. Applica-tion of WHOQOL-BREF in measuring quality of life in health-care staff. Int J Prev Med 2013; 4(7):809-817. 36. Kling K, Hyde JS, Showers C, Buswell B. Gender
differ-ences in self-esteem: A meta-analysis. Psychol Bull 1999; 125(4):470-500.
37. Sjögren E, Kristenson M; Linquest group. Can gen-der differences in psychosocial factors be explained by socioeconomic status? Scand J Public Health 2006; 34(1):59-68.
38. Marchiori GF, Dias FA, Tavares DMS. Quality of life among the elderly with and without companion. J Nurs UFPE [Internet]. 2013; 7(4):1098-106. [acessado 2014 out 20]. Disponível em: http://www.revista.ufpe.br/ revistaenfermagem/index.php/revista/article/viewAr-ticle/4053
39. Rosa TE, Benício MH, Alves MC, Lebrão ML. Aspec-tos estruturais e funcionais do apoio social de idosos do Município de São Paulo, Brasil. Cad Saude Publica 2007; 23(12):2982-2992.
40. Instituto Brasileiro de Geografia e Estatística (IBGE). Síntese de Indicadores Sociais: uma análise das condições de vida da população brasileira-2010. Rio de Janeiro: IBGE; 2010.
41. Bueno LMM. Projeto e favela: metodologia para projetos de urbanização [tese]. São Paulo: Universidade de São Paulo; 2000.
42. Castro MG, Oliveira MS, Moraes JFD, Miguel AC, Araújo RB. Qualidade de vida e gravidade da depen-dência de tabaco. Rev Psiquiatr Clín 2007; 34(2):61-67. 43. Castro MRP, Matsuo T, Nunes SOB. Características clí-nicas e qualidade de vida de fumantes em um centro de referência de abordagem e tratamento do tabagismo. J Bras Pneumol 2010; 36(1):67-74.
44. Moreira TC, Figueiró LR. Qualidade de vida em taba-gistas que buscaram auxílio para deixar de fumar por meio de aconselhamento telefônico. Rev Bras Cancero-logia 2011; 57(3):329-333.
45. Figueiró LR, Cassandra BB, Benchaya MC, Bisch NK, Ferigolo M, Barros HMT, Dantas DCM. Assessment of changes in nicotine dependence, motivation, and symptoms of anxiety and depression among smokers in the initial process of smoking reduction or cessation: a short-term follow-up study. Trends Psychiatry Psycho-ther 2013; 35(3):212-220.
46. Lima MS, Viegas CAA. Avaliação do grau de ansiedade, depressão e motivação dos fumantes que procuraram tratamento para deixar de fumar no Distrito Federal. Rev Bras Cancerol 2011; 57(3):345-353.
47. Rondina RC, Gorayeb R, Botelho C. Características psicológicas associadas ao comportamento de fumar tabaco. J Bras Pneumol 2007; 33(5):592-601.
48. Martins KC, Seidl EMF. Mudança do comportamento de fumar em participantes de grupos de tabagismo. Psic Teor e Pesq 2011; 27(1):55-64.
49. Dogar IA, Haider N, Ahmad M, Naseem S, Bajwa A. Comparison of quality of life among cardiac, hepatic, cancer, and dermatological patients. J Pak Med Assoc 2012; 62(3):232-235.
50. Haroon N, Aggarwal A, Lawrence A, Agarwal V, Mis-ra R. Impact of rheumatoid arthritis on quality of life. Mod Rheumatol 2007; 17(4):290-295.
51. Nicolson P, Anderson P. The patient’s burden: physi-cal and psychologiphysi-cal effects of acute exacerbations of chronic bronchitis. J Antimicrob Chemother 2000; 45:25-32.
52. Yabroff KR, McNeel TS, Waldron WR, Davis WW, Brown ML, Clauser S, Lawrence WF. Health Limita-tions and Quality of Life Associated With Cancer and Other Chronic Diseases by Phase of Care. Med Care 2007; 45(7):629-637.
53. Areias ME, Pinto CI, Vieira PF, Castro M, Freitas I, Sar-mento S, Matos S, Viana V, Areias JC. Living with CHD: quality of life (QOL) in early adult life. Cardiol Young. 2014; 24(Supl. 2):60-65.
54. Oliveira SE, Von Honendorff J, Müller JL, Bandeira DR, Koller SH, Fleck MP, Trentini CM. Associations between self-perceived quality of life and socio-demo-graphic, psychosocial, and health variables in a group of elderly. Cad Saude Publica 2013; 29(7):1437-1448. 55. Vagetti GC, Barbosa Filho VC, Moreira NB,
Olivei-ra V, Mazzardo O, Campos W. Condições de saúde e variáveis sociodemográficas associadas à qualidade de vida em idosas de um programa de atividade física de Curitiba, Paraná, Sul do Brasil. Cad Saude Publica 2013; 29(5):955-969.
56. Fleck MPA, Chachamovich E, Trentini CM. Projeto WHOQOL-OLD: método e resultado de grupos focais no Brasil. Rev Saude Publica 2003; 37:793-799. 57. Azevedo GPGC, Friche AAL, Lemos SMA.
Autopercep-ção de saúde e qualidade de vida de usuários de um Ambulatório de Fonoaudiologia. Rev Soc Bras Fonoau-diol 2012; 17(2):119-127.
58. Jylhä M, Guralnik JM, Ferrucci L, Jokela J, Heikki-nen E. Is self-rated health comparable across cul-tures and genders? J Gerontol B Psychol Sci Soc Sci 1998;53(3):S144-S152.
59. Agostinho MR, Oliveira MC, Pinto MEB, Balardin GU, Harzheim E. Autopercepção da saúde entre usuários da Atenção Primária em Porto Alegre, RS. RBMFC [Internet]. 2010; 5(17):9-15. [acessado 2014 out 21]. Disponível em: http://www.rbmfc.org.br/rbmfc/arti-cle/view/175
60. Reichert FF, LochMR, Capilheira MF. Autopercepção de saúde em adolescentes, adultos e idosos. Cien Saude Colet 2012; 17(12):3353-3362.
Article submitted 11/03/2015 Approved 22/11/2015