AR
TICLE
1 Departamento de Enfermagem Básica, Escola de Enfermagem, Universidade Federal de Minas Gerais. Av. Professor Alfredo Balena, Centro. 30130-100 Belo Horizonte MG Brasil. livinha_ [email protected]
Quality of life and associated factors in elderly people
at a Reference Center
Abstract Studies have evaluated the quality of life (QOL) of many groups; however, such studies in relation to Reference Centers for the Elderly are scarce. This research identified factors associat-ed with a good QOL of people using a Reference Center in the city of Belo Horizonte, MG, Brazil. Transversal study of 257 elderly people who used a Reference Center for the Elderly. The short version of the World Health Organization Quality of Life Assessment (WHOQOL-BREF) was used to eval-uate the QOL of the elderly people. The analysis was rationalized by defining two groups in relation to perceptions of QOL and satisfaction regarding health. Logistic regression analysis was performed to assess the direction and magnitude of the as-sociation of each variable with QOL. The results showed that the majority (63.4%) of the elderly people considered that they had a good QOL and that they were satisfied with their health. The en-vironmental domain received the lowest scores (av-erage = 14.4). The factors of advanced age, being from the interior of the state of Minas Gerais, phys-ical activity, diabetes, musculoskeletal diseases, hy-pertension and depression remained independently associated with QOL and satisfaction with health after the model was adjusted. The data that was obtained can be used to direct care strategies for the most vulnerable elderly people, with particular at-tention to issues that affect the environment.
Key words Aging population, Quality of life,
Transversal studies Lívia Carvalho Viana Miranda 1
Sônia Maria Soares 1
M
ir
anda L Introduction
Population aging is a global phenomenon that is mainly due to a decline in mortality and fertility rates. Demographic projections indicate that the number of elderly people aged over 60 will ex-ceed the number of children for the first time in 2047, growing from 841 million elderly people in 2013 to over 2 billion in 20501.
According to the Brazilian Census in 2010, the number of elderly exceeded 20 million people and a factor of particular note was the propor-tional and faster increase of the group referred to as “very old” (over 80). This age group is current-ly the fastest growing population segment and it now represents more than 14.2% of the elderly population2.
In this populational macro environment, rapid demographic transition has occurred most sharply in developing countries and it has been accompanied by epidemiological changes. Com-plex changes have been observed in health-disease models, which have changed from a prevalence of communicable diseases to a higher prevalence of chronic non-communicable diseases (NCDs)3.
As a result of NCDs such as diabetes, car-diovascular disease and strokes, it has been esti-mated that decreased productivity at work and reduced household income will lead to a loss to the Brazilian economy of billion dollars. The strong socioeconomic impact of chronic diseases and their risk factors are having a negative effect on the Millennium Development Goals, which cover topics such as health, education and the re-duction of poverty, and according to a study pro-duced by the Pan American Health Organization and the World Health Organization this is to be found in most countries4.
Transposing these demographic and epidemi-ological factors, the intensification of changing age structures and the increase in NCDs also re-sults in a direct effect on the QOL of individuals.
As part of the growing body of scientific evi-dence that exists in relation to these issues, inter-national studies have shown an inverse correla-tion between QOL and fragility5, depression6, and
institutionalization7, which have been
represent-ed as factors of vulnerability and have resultrepresent-ed in low scores for the QOL of elderly people, howev-er, physical activity8 and social support9
contrib-ute positively in the various QOL domains. In contrast, Brazilian studies regarding the assessment of the status of the QOL of very el-derly people are incipient and have also been per-formed with different instruments, which mean that it is difficult to compare data10-12.
It is important to bear in mind that demo-graphic transition has resulted in the need to cre-ate assistance programs for the elderly in order to provide active aging and to maintain the QOL of this segment of the population.
Successful international example of initiatives aimed at improving the QOL of the elderly can be found in Canada, Spain, Italy, Portugal and Germany. The latter include programs such as “Active Living” (Alberta, Canada), “In Porto Life is Long” (Porto, Portugal) and “Wellness Project” (Terranuova, Italy), all of which demonstrate that it is possible to promote healthy aging13.
Initiatives by the Federal Government in fa-vor of the elderly in Brazil began in the 1970s; however, the first national policy for this age group was only implemented in 1994. The Na-tional Policy for the Elderly (PNI) was enacted in 1994 and it was regulated by Decree No. 1948 of June 3, 1996, which ensured the social rights of the elderly14,15. In addition, Ordinance No. 1395/
GM created the Health Policy for the Elderly, which is designed to promote healthy aging, as well as the improvement and/or maintenance of the maximum functional capacity in order to en-sure that elderly people can remain independent in the environment in which they live14.
In 2003, Law No. 10.741 created the Statute for the Elderly, which aims to provide facilities and opportunities for the preservation of physi-cal and mental health, as well as improvements in the moral, spiritual, intellectual and social condi-tions of the elderly16.
In 2006, the Guidelines for the Pact for Health were implemented through Ordinance/GM No. 399. These guidelines addressed the following three dimensions: the Pact for Life; the Pact in Defense of the SUS; and the Management Pact. The health of the elderly is one of the main pri-orities for the Pact for Life because of the demo-graphic dynamics of Brazil17.
All policies aimed at the elderly should take into account factors such as functional capacity, as well as the need for autonomy, participation, care and self-satisfaction. Furthermore, such pol-icies should fundamentally encourage compre-hensive health prevention and care that is based on QOL and active aging18.
aúd
e C
ole
tiv
a,
21(11):3533-3544,
2016
elderly which are designed to provide improve-ments in health care and QOL.
Thus, this study identified factors associated with the quality of life of individuals attending a Reference Center for the Elderly in the city of Belo Horizonte, Minas Gerais, Brazil by using the short version of the World Health Organization Quality of Life Assessment (WHOQOL-BREF).
Method
This was a transversal study of 257 people, aged 60 or over, who were registered and active in the various programs provided by a Reference Cen-ter for the Elderly (CRPI) in the city of Belo Hor-izonte, Minas Gerais, Brazil.
This particular CRPI is a public facility that belongs to the city of Belo Horizonte. It offers services and programs aimed at promoting the health of elderly people, as well as preventing social isolation and protecting their rights. The scope of activities that are offered include a gym, ballroom dancing, Gypsy dancing, singing, Lian Gong, computer training, painting on fabric and screen, Biodanza, a youth and adults education project (EJA), “Active Life” and a talent show. The center currently has 590 elderly users who perform various social and educational activities.
The sample size was calculated using the Lwanga & Lemeshow formula19, which requires
the following information: a) the proportion of the population; b) the significance level and c) absolute accuracy. The sample size calculation was based on the proportion of 79.0% of elder-ly Brazilians whose self-perception of their QOL was satisfactory20, with a 5% significance level
and absolute precision of five percentage points. The sample size was 255 elderly people. Taking into account 5.0% possible losses, the final sam-ple included 268 elderly peosam-ple.
In total, data were collected from 269 elder-ly people, which were reviewed one by one. Of these, there were twelve losses - five due to the fact that the WHOQOL-BREF instrument con-tained more than 20.0% of questions that were not completed - and seven because the partici-pants were aged under 60. Consequently, taking into account the sample losses, there were 257 completed and analyzed questionnaires (95.9% of the calculated sample). No participant was ex-cluded from the sample due to severe cognitive impairment (24.8 ± 4.2).
The inclusion criteria were as follows: men and women aged over 60 who were registered at the Reference Center, and who frequented the
center, who agreed to participate in the survey and answered the questionnaire.
Elderly people with severe cognitive impair-ment (who scored ≤ 9 on the Mini-Mental State Examination - MMSE) that prevented them an-swering the questionnaire were excluded from the study21.
Data collection began in January 2012 in the Reference Center. Due to works being undertaken on site, data collection was suspended in August 2012. Data collection resumed in November 2013 and continued until May 2014. The data collec-tion was performed by a previously trained team that was composed of three individuals receiving a fellowship from Scientific Initiation and one person studying for a Master’s degree in nurs-ing. The team was supervised by members of the Center for Studies and Research in Health and Human Development (NEPCDH) of the Federal University of Minas Gerais. The participants in the study were approached by interviewers while waiting for activities in the Reference Center in the morning and afternoon sessions, depending on the availability of each interviewer.
A pre-test questionnaire was conducted in order to check inconsistencies in the questions and any difficulties in understanding by the par-ticipants. There was no difficulty in understand-ing the questions by the participants and the data were not incorporated into the study.
The information was obtained through a structured questionnaire that was organized into the following thematic blocks: socio-demograph-ic variables (gender, age, place of birth, marital status, education and family income); clinical variables (number of comorbidities, self-report-ed comorbidities, cognitive function, depression and body mass index - BMI);and lifestyle vari-ables (alcohol consumption, smoking, physical activity) and quality of life.
In order to assess the subjective perception of QOL we used the short version of WHO-QOL-BREF in Portuguese. This instrument has shown a good response to analyzing the QOL in the elderly22-24 and it was translated and
validat-ed in Brazil25. The WHOQOL-BREF includes 26
items; the first two questions assess the self-per-ceived quality of life and satisfaction with the person’s health. The remaining 24 questions were categorized in the following four domains: phys-ical (7 items); psychologphys-ical (6 items); social rela-tionships (3 items) and environment (8 items)26.
WHO-M
ir
anda L QOL group27, reflecting a better or worse
assess-ment of QOL.
There were no cut-offs to determine scores below or above what could be evaluated as a “bad” or “good” QOL. Thus, it was decided to rationalize the analysis by defining two groups in relation to the perception of QOL and satis-faction with health. Group 1 was defined as: sat-isfactory/good QOL; self-reported QOL as being “good” or “very good” and feeling “satisfied” or “very satisfied” with their health. Group 2 was defined as: unsatisfactory/bad QOL; self-report-ed QOL as being “bad”, “very bad” or “neither bad nor good”; and feeling “unsatisfied”, “very unsatisfied” or “neither satisfied nor dissatisfied” with their health.
The parameters set by the BMI classification followed the cut-offs established for elderly indi-viduals i.e. low weight: < 22 kg/m2; eutrophic:
22-27 kg/m2; and overweight: > 27 kg/m2 28.
The presence of depression was assessed us-ing the Patient Health Questionnaire-2 (PHQ-2). For this study, the cut-off point of ≥ 3was adopt-ed (sensitivity: 83%; specificity: 92%), which, according to the literature, suggests probable de-pression29.
The Alcohol Use Disorders Identification Test-Consumption (AUDIT-C) was used to eval-uate the consumption of alcoholic beverages. Based on a previous validation study, a score of
≥ 4 for men and ≥ 3 for women suggested alco-hol abuse and was adopted as a criterion in this study30.
The data were entered and analyzed using the Statistical Package for the Social Sciences (version 22.0). In the descriptive statistics the continuous variables were compared between groups using the Student’s t-test for indepen-dent samples or the analysis of variance test (parametric ANOVA with a classification crite-rion), which was supplemented where necessary by Tukey’s test. The categorical variables were compared using Pearson’s chi-square test (χ2) or Fisher’s exact test. In the statistical modeling, a critical level value of p ≤ 0.20 was adopted for entry in the multivariate model. The analysis of the normality of the continuous variables was performed using the Kolmogorov-Smirnov test. The Spearman’s-Rho correlation test was used for the overall QOL (OQOL)and QOL/satisfac-tion with health groups; it was also performed for the WHOQOL-BREF domains. The logistic regression model using the Forward method was
designed to assess the direction and magnitude of the association of each independent variable with the response variable (good QOL/satisfied with health). In this analysis, p < 0.05 was con-sidered as statistically significant. The values that were obtained were expressed as odds ratios and their 95% confidence intervals. The adjustment of the final model was evaluated by the good-ness-of-fit test.
Results
Characteristics of the individuals
aúd e C ole tiv a, 21(11):3533-3544, 2016 p-valuea 0.876 0.025 0.144 0.587 0.220 0.342 0.001 0.583 0.019 0.002 0.288 0.030 0.006 0.549 < 0.001 0.456 0.570 0.664 0.008 Variables Gender Male Female Age group(years) 60-69 70-79 ≥ 80 Place of birth*
BH or MRBH Interior of MG Other Marital status No spouse Spouse Education (years) < 4 ≥ 4 Income (m.w)*
< 1 1 ˫ 3 3 ˫ 5 ≥ 5 Comorbidities
Arterial hypertension Dyslipidemia Diabetes
Musculoskeletal diseases Thyroid gland diseases Cardiac disease Respiratory diseases Cognitive level Altered Preserved PHQ-2 total
≥ 3 < 3 IMC (kg/m2)*
< 22 22-27 > 27 AUDIT-C* Negative Positive Smoking Smoker Non-smoker Ex-smoker Physical exercise
4-7 times per week 1-3 times per week Never
Table 1. Characteristics of the study sample according to quality of life (QOL) and satisfaction with health
groups at a Reference Center for the Elderly, Belo Horizonte, Minas Gerais, Brazil from 2012 to 2014 (n = 257)
G1 (good) (n = 163) Total
(n = 257) n (%) 45 (17.5) 212 (82.5) 115 (44.7) 115 (44.7) 27 (10.5) 81 (31.6) 156 (60.9) 19 (7.4) 164 (63.8) 93 (36.2) 55 (21.4) 202 (78.6) 48 (19.1) 101 (40.2) 70 (27.9) 32 (12.7) 163 (63.4) 68 (26.5) 61 (23.7) 60 (23.3) 41 (16.0) 27 (10.5) 16 (6.2) 43 (16.7) 214 (83.3) 25 (9.7) 232 (90.3) 29 (11.6) 94 (37.6) 127 (50.8) 229 (90.5) 24 (9.5) 10 (3.9) 165 (64.2) 82 (31.9) 72 (28.0) 162 (63.0) 23 (8.9) G2 (bad) (n = 94)
AUDIT-C: Alcohol Use Disorders Identification Test-Consumption; BH: Belo Horizonte; BMI: body mass index; MG: Minas Gerais; PHQ-2: The Patient Health Questionnaire-2; QOL: Quality of life; MRBH: metropolitan region of Belo Horizonte; m.w: minimum wage. * Variations in the n total due to missing values. a p-value: differences in the proportions (Pearson’s chi-square test or Fisher’s Exact test).
M
ir
anda L Quality of life of the elderly
according to WHOQOL-BREF
The average scores for QOL of the four do-mains of WHOQOL-BREF were as follows: 63.91 ± 9.62 for the physical domain; 64.05 ± 10.83 for the psychological domain; 67.90 ± 17.90 for the social relationships domain; and 14.44 ± 1.96 for the environmental domain. Regarding the overall score for QOL (OQOL), the average was 52.57 ± 7.74 (Graph 1).
It was found that all the domains were signifi-cantly correlated with the OQOL. The least and the most correlated domains were environment (r = 0.622, moderate correlation, p < 0.001) and social relationships (r = 0.842, strong correla-tion, p < 0.001), respectively. However, when the correlation between the domains and the groups (G1 and G2) was verified there was a significant loss in relation to the physical domain (r = 0.098, p = 0.116).The social relationships domain cor-related weakly (r = 0.241, p < 0.001) and the psy-chological domain (r = 0.408, p < 0.001) and en-vironment domain (r = 0.432, p < 0.001) showed a moderate correlation.
Approximately 77.8% of the elderly perceived their QOL as good or very good and 3.1% as bad or very bad; 75.1% felt satisfied or very satisfied with their health, while 9.3% were unsatisfied or very unsatisfied.
Of the 200 elderly patients with a good or very good QOL, 81.5% were satisfied or very satisfied with their health and they formed the G1 group
(satisfactory/good QOL). The others made up the G2 group (bad/unsatisfactory QOL) (Table 2).
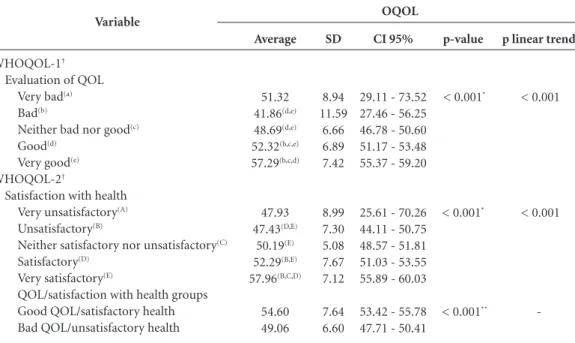
Table 3 shows that the scores for OQOL showed a linear trend, as the response was more positive, both in WHOQOL-1 and WHOQOL-2,
Variable
WHOQOL-1 Very bad Bad
Neither bad nor good Good
Very good Total
Table 2. Frequency for the WHOQOL-1 and WHOQOL-2 variables for the QOL/satisfaction with health groups
at a Reference Center for the Elderly, Belo Horizonte, Minas Gerais, Brazil from 2012 to 2014 (n = 257)
WHOQOL: World Health Organization Quality of Life. a G1 –Good/satisfactory quality of life (n = 163). b G2 –Bad/unsatisfactory quality of life(n = 94).
n
2b
-1b
-3
%
66.7 -2.0 -1.2 Very unsatisfactory
n
-3b
8b
9b
1b
21 %
-60.0 16.3 6.4 1.7 8.2 Unsatisfactory
WHOQOL-2
n
1b
-12b
22b
5b
40 Neither satisfactory
nor unsatisfactory
%
33.3 -24.5 15.7 8.3 15.6
n
-2b
27b
93a
23a
145 %
-40.0 55.1 66.4 38.3 56.4 Satisfactory
n
-1b
16a
31a
48 %
-2.0 11.4 51.7 18.7 Very satisfactory
n
3 5 49 140 60 257
%
100 100 100 100 100 100 Total
Graph 1. Box plot of the physical, psychological, social
relationships, environmental, and overall quality of life domains. Reference Center for the Elderly, Belo Horizonte, Minas Gerais, Brazil from 2012 to 2014.
Note: OQOL-Overall quality of life. Physical
Psy cholo
gical
Social r elat
ionships
Envir onme
ntal
Ove rall q
ualit y of lif
e 0,00
20,00 40,00 60,00 80,00 100,00
%
*
aúd
e C
ole
tiv
a,
21(11):3533-3544,
2016
which was statistically significant (p < 0.001). When the OQOL score was evaluated according to the groups defined by the analysis (G1 and G2) it was significantly higher in G1 (a better percep-tion of QOL and greater satisfacpercep-tion with health).
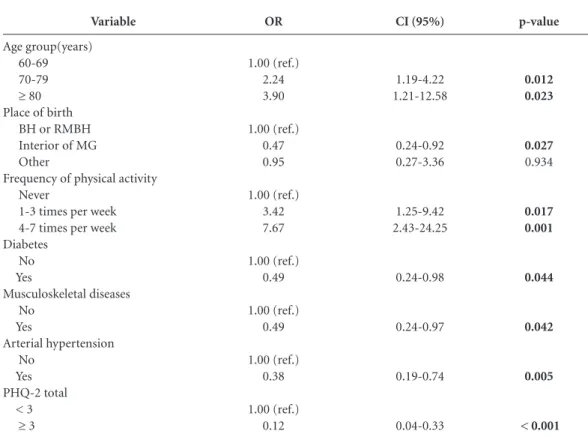
Factors associated with QOL in the studied sample
Logistic regression analysis was conducted to identify possible independent predictors in the perception of QOL and satisfaction with health defined by the groups G1 and G2. Table 4 shows the results of the final model with the respective odds ratios (OR) and 95% confidence intervals (CI). The age groups 70 to 79 years (OR: 2.24; 95% CI: 1.19 to 4.22) and ≥ 80 years (OR: 3.90; 95% CI: 1.21 to 12.58); place of birth (interior of the state of Minas Gerais; OR: 0.47; 95% CI: 0.24 to 0.92); frequency of physical activity 1-3 times per week (OR: 3.42; 95% CI: 1.25 to 9.42) and 4-7 times per week (OR: 7.67; 95% CI: 2.43 to 24.25); diabetes (OR: 0.49; 95% CI: 0.24 to 0.98); mus-culoskeletal disorders (OR: 0.49; 95% CI: 0.24 to 0.97); arterial hypertension (OR: 0.38; 95% CI: 0.19 to 0.74) and PHQ ≥ 3 (OR: 0.12; 95% CI:
0.04 to 0.33) remained independently associat-ed with QOL and satisfaction with health after multivariate analysis of the data. The indepen-dent variables explained 20.47% (Pseudo R2 = 0.2047) of the response variable (good QOL and satisfaction with health). The results of the ad-justment tests of the multiple logistic regression models (Hosmer and Lemeshow) showed a good fit for the final model (Prob > chi2 = 0.5722).
Discussion
This study showed a positive relationship be-tween QOL with advancing age and physical activity. Furthermore, a negative association was found between QOL, being born in the state of Minas Gerais and comorbidities (diabetes, mus-culoskeletal diseases, hypertension and depres-sion). These findings confirmed the multifacto-rial nature of the studied phenomenon, i.e. QOL was influenced by demographic factors as well as clinical and behavioral factors.
Older age was associated with a better per-ception of QOL, which was consistent with a previous study. This finding may indicate that
Variable
WHOQOL-1†
Evaluation of QOL Very bad(a)
Bad(b)
Neither bad nor good(c)
Good(d)
Very good(e)
WHOQOL-2†
Satisfaction with health Very unsatisfactory(A)
Unsatisfactory(B)
Neither satisfactory nor unsatisfactory(C)
Satisfactory(D)
Very satisfactory(E)
QOL/satisfaction with health groups Good QOL/satisfactory health Bad QOL/unsatisfactory health
Table 3. Scores for overall quality of life (OQOL) according to the variables WHOQOL-1, WHOQOL-2 and the
QOL/satisfaction with health groups at a Reference Center for the Elderly, Belo Horizonte, Minas Gerais, Brazil from 2012 to 2014 (n = 257)
* Parametric ANOVA with one classification criterion; † Significant differences between the averages of the groups (p < 0.05) are marked with superscript letters (Tukey’s test); ** Student’s t-test; ANOVA – Analysis of variance; SD –Standard deviation; CI 95% - 95% Confidence interval; QOL - Quality of life; OQOL –Overall quality of life; WHOQOL - World Health Organization Quality of Life.
Average
51.32 41.86(d,e)
48.69(d,e)
52.32(b,c,e)
57.29(b,c,d)
47.93 47.43(D,E)
50.19(E)
52.29(B,E)
57.96(B,C,D)
54.60 49.06
OQOL
SD
8.94 11.59
6.66 6.89 7.42
8.99 7.30 5.08 7.67 7.12
7.64 6.60
CI 95%
29.11 - 73.52 27.46 - 56.25 46.78 - 50.60 51.17 - 53.48 55.37 - 59.20
25.61 - 70.26 44.11 - 50.75 48.57 - 51.81 51.03 - 53.55 55.89 - 60.03
53.42 - 55.78 47.71 - 50.41
p-value
< 0.001*
< 0.001*
< 0.001**
p linear trend
< 0.001
< 0.001
-M
ir
anda L
the “older elderly” conformed to the inevitability of old age, while the “younger elderly” were faced by the dilemma of aging and presented such a condition22. This can provide fruitful discussion
about how the perceptions of aging, working and resilience of this sector of elderly people were re-flected in higher scores in relation to QOL.
Regarding behavioral habits, a study involving 115 elderly women and 61 elderly men from the Palestinian West Bank (average age 68.15 ± 6.74 years) showed a strong association between higher levels of physical activity and a positive influence on all dimensions of QOL related to health31. In
the present study, a direct and gradual relationship was also observed between the frequency of phys-ical activity and the score for QOL. It is known that physical exercise, if performed regularly and properly, slows functional losses and provides el-derly people with autonomy and a better QOL. Therefore, physical activity programs for the el-derly should be directed towards the development of physical and functional improvements, as well
as teaching people the limitations and aptitudes of their body32. However, a recent study conducted in
Brazil, with a population-based sample of elderly people, indicated a prevalence of physical inac-tivity of 46.7%, mainly in octogenarians33. In this
regard, encouraging healthy habits and behavior should be discussed in government programs in order to contribute to active and healthy aging, with minimal incapacities.
One of the most worrying factors regarding the elderly is their overall health and the issue of morbidities is of fundamental importance. Thus, health prevention and promotion can impede functional decline and offer a better quality of life for elderly people34.
However, the aging process is not necessarily related to disease and disability: chronic degener-ative diseases are often found among the elderly. Thus, the current trend is that there are an in-creasing number of elderly individuals who, de-spite living longer, have higher levels of chronic conditions. The increase in the number of
chron-Variable
Age group(years) 60-69 70-79 ≥ 80 Place of birth
BH or RMBH Interior of MG Other
Frequency of physical activity Never
1-3 times per week 4-7 times per week Diabetes
No Yes
Musculoskeletal diseases No
Yes
Arterial hypertension No
Yes PHQ-2 total
< 3 ≥ 3
Table 4. Final logistic regression model with good quality of life and satisfaction with health as the dependent
variable at a Reference Center for the Elderly, Belo Horizonte, Minas Gerais, Brazil from 2012 to 2014 (n = 257)
BH - Belo Horizonte; CI 95% - 95% confidence interval; MG - Minas Gerais; OR - Odds ratio; PHQ - The Patient Health Questionnaire; MRBH –Metropolitan region of Belo Horizonte.
OR
1.00 (ref.) 2.24 3.90
1.00 (ref.) 0.47 0.95
1.00 (ref.) 3.42 7.67
1.00 (ref.) 0.49
1.00 (ref.) 0.49
1.00 (ref.) 0.38
1.00 (ref.) 0.12
CI (95%)
1.19-4.22 1.21-12.58
0.24-0.92 0.27-3.36
1.25-9.42 2.43-24.25
0.24-0.98
0.24-0.97
0.19-0.74
0.04-0.33
p-value
0.012 0.023
0.027 0.934
0.017 0.001
0.044
0.042
0.005
aúd
e C
ole
tiv
a,
21(11):3533-3544,
2016
ic diseases is directly related to greater functional disability35. Brazilian and international studies
have demonstrated significant associations be-tween chronic diseases, functional disability and the QOL of the elderly35-37.
In relation to the overall scores for the WHO-QOL-BREF domains, the environmental domain obtained extremely low scores, which negatively influenced the QOL. This particular domain re-fers to aspects such as physical safety and securi-ty, health and social care (availability and qual-ity), opportunities to acquire new information and skills, participation and opportunities for recreation/leisure, etc.
A study conducted in metropolitan areas of Brazil between 1991 and 2000 assessed the Qual-ity of Human Life Index (QHLI). The QHLI con-sists of five indicators (quality of housing, living conditions, income, health and environmental safety, and sanitary services), and it also measures aspects related to human development and the quality of the built environment. According to the results of the aforementioned study, the qual-ity indicators which most influenced a decrease in QHLI in metropolitan areas were quality of housing, health and environmental safety. These aspects are related to a high prevalence of respi-ratory and parasitic diseases, which are strong in-struments of indirect estimates of the quality of air and water enjoyed by the population, as well as mortality from external causes and violence in its broadest sense38.
Violence significantly undermines envi-ronmental safety and this issue is the subject of much discussion by those who live in urban areas in Brazil. This topic has a fundamental influence on the daily life of individuals, social groups, the media in general, and the relationship be-tween state, society and social organizations in the world and in Brazil. Violence is a complex phenomenon that affects both developed and developing countries. In many societies, vari-ous expressions of violence are often treated as a form of acting “normally” and it is hidden within the customs and relationships that exist between people. Both in Brazil and worldwide, violence against older people is expressed in the ways that relationships are organized between the rich and the poor, between genders, races and age groups within the various spheres of public, institution-al and family power39
. Thus, violence against the
elderly significantly affects the environment in which they live and interact.
Given the seriousness of this situation, in 2014 the Human Rights Secretariat of the
Pres-idency of the Republic of Brazil published the “Manual to Deal with Violence against the Elder-ly”. The goal of this manual was to reach a wide audience of people who, by law, must respect, protect and care for the elderly. The latter include managers, service providers, health and social services professionals, law enforcement officers, security officers and their families40. In the case
of the city of Belo Horizonte, in 2010 the rate of violence against the elderly was 62.75 per 10,000 inhabitants (admissions in the public system of people aged 60 or over from causes related to possible aggression per 10,000 inhabitants in this age group, by place of residence)41.
Brazilian elderly people live in daily fear of violence, a lack of medical care and hospitals, and suffer from scarce leisure activities, as well as financial problems caused by the low values of their pensions18.
Consequently, it is important to reflect on the possible causes that negatively affect the QOL of the elderly, especially environmental factors, in order to search for possible improvements. Nursing could be incorporated into the ambit of Family Health teams and could be used as an intervention strategy for home visits. This could provide better knowledge about the area of cov-erage and could result in intersectoral actions to minimize the impact of the environment on the QOL of the elderly.
Moreover, it should be noted that there are other factors that affect the QOL of elderly peo-ple, which were not analyzed in this study but which have been examined in other studies. These include the positive link that has been made be-tween higher levels of satisfaction with life and a better self-perception on the part of the elderly in relation to their oral health42
, and the presence
of cognitive decline directly affecting the QOL of elderly people with hypertension due to the fact that the latter limits the capacity to perform ev-eryday activities, particularly if this is associated with painful conditions and emotional changes43.
It is important to note that there are limita-tions associated with the present study due to its transversal design and convenience sample. A further limitation was the lack of similar Brazil-ian national studies regarding reference centers for the elderly, which prevented comparisons be-ing made.
M
ir
anda L health promotion and the prevention of disease
prevention, as well as improvements in the local infrastructure.
The data presented in this study can be used to direct care strategies for the most vulnerable elderly people, with particular attention to issues that affect the environment.
Collaborations
LCV Miranda was responsible for the design of the original idea of the article, editing, literature review, interpretation of results and data collec-tion. PAB Silva was responsible for writing the article, the literature review, analysis and inter-pretation of data. SM Soares was responsible for guidance, the structure of the article, and provid-ed a critical review of the content. All the authors participated in the approval of the final version of the manuscript.
Acknowledgments
aúd
e C
ole
tiv
a,
21(11):3533-3544,
2016
Brasil. Casa Civil. Subchefia para assuntos jurídicos. Lei n° 10.741, de 1° de Outubro de 2003. Dispões sobre o Estatuto do Idoso e dá outras providências. Diário Ofi-cial da União 2003; 2 out.
Brasil. Ministério da Saúde (MS). Portaria 399/GM de 22 de fevereiro 2006. Divulga o Pacto pela Saúde 2006 - Consolidação do SUS e aprova as Diretrizes Opera-cionais do Referido Pacto. Diário Oficial da União 2006; 23 fev.
Veras R. Envelhecimento populacional contemporâ-neo: demandas, desafios e inovações. Rev Saude Publica 2009;43(3):548-554.
Lwanga SK, Lemeshow S. Sample size determination in health studies: a practical manual. Geneva: WHO; 1991. Trentini CM. Qualidade de vida em idosos [tese]. Por-to Alegre: Universidade Federal do Rio Grande do Sul; 2004.
Mungas D. In-office mental status testing: a practical guide. Geriatrics 1991; 46(7):54-58,63,66.
Dawalibi NW, Goulart RMM, Prearo LC. Fatores relacionados à qualidade de vida de idosos em pro-gramas para a Terceira idade. Cien Saude Colet 2014; 19(8):3505-3512.
Campos AC, Ferreira e Ferreira E, Vargas AM, Albala C. Aging, Gender and Quality of Life (AGEQOL) study: factors associated with good quality of life in older Brazilian community-dwelling adults. Health Qual Life Outcomes 2014; 12:166.
Silva PAB, Soares SM, Santos JFG, Silva LB. Ponto de corte para o WHOQOL-bref como preditor de qua-lidade de vida de idosos. Rev Saude Publica 2014; 48(3):390-397.
Fleck MPA, Louzada S, Xavier M, Chachamovich E, Vieira G, Santos L, Pinzon V. Aplicação da versão em português do instrumento abreviado de avaliação da qualidade de vida “WHOQOL-bref ”. Rev Saude Publica 2000; 34(2):178-183.
Fleck MPA, Leal OF, Louzada S, Xavier M, Chachamo-vich E, Vieira G, Santos L, Pinzon V. Desenvolvimento da versão em português do instrumento de avaliação de qualidade de vida da OMS (WHOQOL-100). Rev Bras Psiquiatr 1999; 21(1):19-28.
Organização Mundial de Saúde (OMS). Como pontuar o WHOQOL-bref e o WHOQOL-100. In: Organiza-ção Mundial de Saúde. Versão em português dos ins-trumentos de avaliação de qualidade de vida (WHO-QOL).1998. cap. 8. [acessado 2015 jul 24]. Disponível em: http://www.ufrgs.br/psiq/whoqol85a.html Lipschitz DA. Screening for nutritional status in the el-derly. Prim Care 1994; 21(1):55-67.
Kroenke K, Spitzer RL, Williams JB. The Patient Health Questionnaire-2: validity of a two-item depression screener. Med Care 2003; 41(11):1284-1292.
Bush K, Kivlahan DR, McDonell MB, Fihn SD, Brad-ley KA. The AUDIT Alcohol Consumption Questions (AUDIT-C): an effective brief screening test for prob-lem drinking. Ambulatory Care Quality Improvement Project (ACQUIP). Alcohol Use Disorders Identifica-tion Test. Arch Intern Med 1998; 158(16):1789-1795. Halaweh H, Willen C, Grimby-Ekman A, Svantesson U. Physical activity and health-related quality of life among community dwelling elderly. J Clin Med Res 2015; 7(11):845-852.
16.
17.
18.
19. 20.
21. 22.
23.
24.
25.
26.
27.
28. 29.
30.
31. References
United Nations (UN). Department of Economic and Social Affairs. Population Division. World Population Ageing 2013. New York: UN; 2013.
Brasil. Ministério da Saúde (MS). Secretaria de Atenção à Saúde. Departamento de Ações Programáticas e Es-tratégicas. Atenção à saúde da pessoa idosa e envelhe-cimento. Brasília: MS; 2010. (Série B. Textos Básicos de Saúde) (Série Pactos pela Saúde 2006, 12).
Mendes EV. O cuidado das condições crônicas na Aten-ção Primária à Saúde: o imperativo da consolidaAten-ção da Estratégia da Saúde da Família. Brasília: Organização Pan-Americana da Saúde; 2012.
Goulart FAA. Doenças Crônicas Não-Transmissíveis: es-tratégias de controle e desafios para os Sistemas de Saúde. Brasília: Ministério da Saúde, Organização Panameri-cana de Saúde, Organização Mundial de Saúde; 2011. Gobbens RJ, Luijkx KG, van Assen MA. Explaining quality of life of older people in the Netherlands using a multidimensional assessment of frailty. Qual Life Res 2013; 22(8):2051-2061.
Brett CE, Gow AJ, Corley J, Pattie A, Starr JM, Deary IJ. Psychosocial factors and health as determinants of quality of life in community-dwelling older adults. Qual Life Res 2012; 21(3):505-516.
Chang HT, Liu LF, Chen CK, Hwang SJ, Chen LK, Lu FH. Correlates of institutionalized senior veterans’ quality of life in Taiwain. Health Qual Life Outcomes 2010; 17(8):70.
Van Dyck D, Teychenne M, McNaughton SA, De Bourdeaudhuij I, Salmon J. Relationship of the per-ceived social and physical environment with mental health-related quality of life in middle-aged and older adults: mediating effects of physical activity. PLoS One 2015; 10(3):e0120475.
Bryła M, Burzyńska M, Maniecka-Bryła I. Self-rated quality of life of city-dwelling elderly people benefit-ting from social help: results of a cross-sectional study. Health Qual Life Outcomes 2013; 11:181.
Carvalho VCHS, Rossato SL, Fuchs FD, Harzheim E, Fuchs SC. Assessment of primary health care re-ceived by the elderly and health related quality of life: a cross-sectional study. BMC Public Health 2013; 13:605. Tavares DMS, Bolina AF, Dias FA, Ferreira PCS, Haas VJ. Quality of life of elderly. Comparison betwe-en urban and rural areas. Invest Educ Enferm 2014; 32(3):401-413.
Vagetti GC, Barbosa Filho VC, Moreira NB, Olivei-ra V, Mazzardo O, Campos W. Condições de saúde e variáveis sociodemográficas associadas à qualidade de vida em idosas de um programa de atividade física de Curitiba, Paraná, Sul do Brasil. Cad Saude Publica 2013; 29(5):955-969.
Benedetti TRB, Borges LJ, Petroski EL, Gonçalves LHT. Atividade física e estado de saúde mental de idosos. Rev Saude Publica 2008; 42(2):302-307.
Brasil. Ministério da Saúde (MS). Portaria do Gabinete do Ministro de Estado da Saúde de n° 1395, de 9 de dezembro de 1999, que aprova a Política Nacional de Saúde do Idoso e dá outras providências. Diário Oficial da União 1999; 13 dez.
Fernandes MTO, Soares SM. O desenvolvimento de políticas públicas de atenção ao idoso no Brasil. Rev Esc Enferm USP 2012; 46(6):1494-1502.
1.
2.
3.
4.
5.
6.
7.
8.
9.
10.
11.
12.
13.
14.
M
ir
anda L Vidmar MF, Potulski AP, Sachetti A, Silveira MM,
Wi-belinger LM. Atividade física e qualidade de vida em idosos. Rev Saude Pesq 2011; 4(3):417-424.
Queiroz BM, Coqueiro RS, Leal Neto JS, Borgatto AF, Barbosa AR, Fernandes MH. Inatividade física em ido-sos não institucionalizados: estudo de base populacio-nal. Cien Saude Colet 2014; 19(8):3489-3496. Schneider ARS. Envelhecimento e quedas: a fisioterapia na promoção e atenção à saúde do idoso. RBCEH 2010; 7(2):296-303.
Santos SAL, Tavares DMS, Barabosa MH. Fatores so-cioeconômicos, incapacidade funcional e número de doenças entre idosos. Rev Eletrônica Enferm 2010; 12(4):692-697.
Onunkwor OF, Al-Dubai SA, George PP, Arokiasamy J, Yadav H, Barua A, Shuaibu HO. A cross-sectional study on quality of life among the elderly in non-govern-mental organizations’ elderly homes in Kuala Lumpur. Health Qual Life Outcomes 2016; 14:6.
Marengoni A, Angleman S, Melis R, Mangialasche F, Karp A, Garmen A, Meinow B, Fratiglioni L. Aging with multimorbidity: a systematic review of the literature. Ageing Res Rev 2011; 10(4):430-439.
Umbelino GJM. Aplicação do Índice de Qualidade de Vida Humana (IQVH) nas regiões metropolitanas do Brasil. Rev Bras Est Pop 2007; 24(2):339-340.
Guimarães SJ, Miranda JLS, Macedo LTA. Violência contra o idoso: uma questão social a ser discutida. Uni-versidade Federal Do Maranhão - III Jornada Interna-cional de Políticas Públicas: Questão Social e Desenvolvi-mento no Século XXI. São Luís, MA, Ago. 2007. Minayo MCS. Brasil: Manual de Enfrentamento à Vio-lência contra a Pessoa Idosa. É possível prevenir. É neces-sário superar. Brasília: Secretaria de Direitos Humanos da Presidência da República; 2014.
Instituto Brasileiro de Geografia e Estatística (IBGE). Censo demográfico 2010: características gerais da popu-lação, religião e pessoas com deficiência. Rio de Janeiro: IBGE; 2010.
Rigo L, Basso K, Pauli J, Cericato GO, Paranhos LR, Garbin RR. Satisfação com a vida, experiência odon-tológica e autopercepção da saúde bucal entre idosos. Cien Saude Colet 2015; 20(12):3681-3688.
Chaves AS, Santos AM, Alves MTSSB, Salgado Filho N. Associação entre declínio cognitivo e qualidade de vida de idosos Hipertensos. Rev Bras Geriatr Gerontol 2015; 18(3):545-556.
Article submitted 13/10/2015 Approved 01/02/2016
Final version submitted 03/02/2016 32.
33.
34.
35.
36.
37.
38.
39.
40.
41.
42.