BASIC RESEARCH
1Hypertension Unit, Heart Institute, University of Sao Paulo Medical School, Sao Paulo, Brazil.
2Mackenzie University, Sao Paulo, Brazil. 3Sao Judas Tadeu University, São Paulo, Brazil.
4School of Medicine of Ribeirao Preto, University of Sao Paulo, Sao Paulo, Brazil.
5 Institute of Cardiology of Rio Grande do Sul/University Foundation of Cardiology, Porto Alegre, Brazil.
E-mail: [email protected]
Received for publication on January 29, 2007 Accepted for publication on March 20, 2007
AUTONOMIC MODULATION OF ARTERIAL
PRESSURE AND HEART RATE VARIABILITY IN
HYPERTENSIVE DIABETIC RATS
Vera de Moura Azevedo Farah1,2, Kátia De Angelis 1,3, Luis Fernando Joaquim4,
Georgia O. Candido1, Nathalia Bernardes3, Rubens Fazan Jr4, Beatriz D’Agord
Schaan5, Maria-Claudia Irigoyen1
Farah VMA, De AngelisK, Joaquim LF, Candido GO, Bernardes N,Fazan Jr R, Schaan BD, Irigoyen MC. Autonomic modulation of arterial pressure and heart rate variability in hypertensive diabetic rats. Clinics. 2007;62(4):477-82.
OBJECTIVE: The aim of the present study was to evaluate the autonomic modulation of the cardiovascular system in streptozotocin (STZ)-induced diabetic spontaneously hypertensive rats (SHR), evaluating baroreflex sensitivity and arterial pressure and heart rate variability.
METHODS: Male SHR were divided in control (SHR) and diabetic (SHR+DM, 5 days after STZ) groups. Arterial pressure (AP) and baroreflex sensitivity (evaluated by tachycardic and bradycardic responses to changes in AP) were monitored. Autoregressive spectral estimation was performed for systolic AP (SAP) and pulse interval (PI) with oscillatory components quantified as low (LF:0.2-0.6Hz) and high (HF:0.6-3.0Hz) frequency ranges.
RESULTS: Mean AP and heart rate in SHR+DM (131±3 mmHg and 276±6 bpm) were lower than in SHR (160±7 mmHg and 330±8 bpm). Baroreflex bradycardia was lower in SHR+DM as compared to SHR (0.55±0.1 vs. 0.97±0.1 bpm/mmHg). Overall SAP variability in the time domain (standard deviation of beat-by-beat time series of SAP) was lower in SHR+DM (3.1±0.2 mmHg) than in SHR (5.7±0.6 mmHg). The standard deviation of the PI was similar between groups. Diabetes reduced the LF of SAP (3.3±0.8 vs. 28.7±7.6 mmHg2 in SHR), while HF of SAP were unchanged. The power of oscillatory components of PI did not differ between groups.
CONCLUSIONS: These results show that the association of hypertension and diabetes causes an impairment of the peripheral cardiovascular sympathetic modulation that could be, at least in part, responsible for the reduction in AP levels. Moreover, this study demonstrates that diabetes might actually impair the reduced buffer function of the baroreceptors while reducing blood pressure.
KEYWORDS: Hypertension. Diabetes. Spectral Analysis. Cardiovascular Function. Baroreflex Sensitivity.
INTRODUCTION
Diabetes mellitus (DM) is a worldwide health problem, because its prevalence has been on the rise during the past
few decades and because of the high levels of morbidity and mortality of this disease. The high morbidity and mortality of DM is derived from chronic micro and macrovascular complications,1 as well as alterations in the autonomic
neu-ral control of the cardiovascular system.2,3 Autonomic
neu-ropathy is a common complication of DM that has been found not only in clinical but also in animal models of DM.2,4
Stud-ies performed in our laboratory on streptozotocin (STZ)-in-duced diabetic rats showed that they present long-lasting changes in blood pressure, heart rate and autonomic cardio-vascular reflexes.5-8 Using a pharmacological blockade, we
car-diac vagal neuropathy in STZ-induced DM.6,9
Several methods have been introduced to evaluate car-diac autonomic neuropathy in clinical and experimental diabetes. Methods to quantify heart rate and arterial pres-sure variability have emerged as useful tools to evaluate sympathetic a parasympathetic modulation of the cardio-vascular system in humans10 and experimental models.11-15
These methods are able to detect early abnormalities in the autonomic modulation of the cardiovascular system.16-19
When evaluated in the time domain, the heart rate variabil-ity was reduced in chronic STZ-diabetic rats.12,20 In another
study, Fazan et al.19 observed reduction in the arterial
pres-sure (AP) and heart rate (HR) variability, meapres-sured either as the standard deviation or by spectral analysis in chronic STZ-diabetic rats. In humans with DM, spectral analysis of HR disclosed significant changes in the cardiovascular variability in the frequency domain, which were apparent even before changes in all other standard cardiovascular parameters.17
Administration of STZ is a well-established method to induce diabetes in rodents,21 producing a number of
car-diovascular changes such as hypotension, bradycardia, de-creased AP variability, and impairment of the reflex con-trol of circulation.4,19,22,23 Since the administration of STZ
to Wistar rats induces a diabetic state that is not accompa-nied by hypertension,11 its use in spontaneously
hyperten-sive rats (SHR) can produce an animal model more closely related to human diabetes. Therefore, the aim of the present study was to evaluate the autonomic modulation of the car-diovascular function in STZ-induced diabetic SHR, by studying the blood pressure and heart rate variability in the time and frequency domains (spectral analysis), and also evaluating the cardiac baroreflex sensitivity in this model.
MATERIALS AND METHODS
Experiments were performed in male SHR weighing 250-270g. The animals were housed in individual cages with free access to water and food, at a constant tempera-ture of 23oC, on a 12-hour light/dark cycle. All experimental
protocols were in accordance with the Guidelines for Ethi-cal Care of Experimental Animals and were approved by the Institutional Animal Care and Use Committee.
Diabetes was induced by a single injection of STZ (50 mg/ kg, i.v., Sigma Chemical Co, St Louis, MO, USA) dissolved in 0.01 M citrate buffer, pH 4.5, administered 5 days before the experiments in SHR (SHR+DM, n=7). The control SHR group (SHR, n=7) was injected with citrate buffer alone. The rats were fasted for 8h before STZ or vehicle injection.21
One day before the experiments, arterial and venous catheters were placed in the right femoral artery and vein
under sodium pentobarbital anesthesia (40 mg/kg, IP, Cristalia, SP, Brazil) for the direct measurement of AP and drug administration, respectively. The catheters were ex-teriorized through the back of the neck.
The experiments consisted in continuously recording AP (30 minutes) via a transducer (P23Db, Gould-Statham) con-nected to the arterial catheter. Rats were conscious and moved freely during the experiments. The signal was fed into an am-plifier (GPA-4 model 2, Stemtech Inc.) and a 16-channel ana-log-to-digital interface, and continuously sampled (2 kHz) in an IBM/PC. Increasing doses of phenylephrine (0.05 to 0.8 µg/kg) and sodium nitroprusside (5 to 20 µg/kg) were given as sequential bolus injections (0.1 mL) to produce changes in AP ranging from 5 to 30 mmHg. Injections were not repeated until the recorded parameters had returned to pre-injection lev-els. Then, beat-to-beat values of systolic, diastolic and mean AP were identified and HR or pulse interval (PI) was calcu-lated as the interval between successive systolic pressure val-ues by using the computer software CODAS (Dataq, Inc).
Baroreflex sensitivity, expressed as bpm/mmHg, was evaluated by means of the index relating reflex changes in HR due to the changes in mean AP (MAP), as described elsewhere.24 At the end of the AP recordings, a blood
sam-ple was collected for glucose measurement (Advantage, Roche, Indianapolis, IN, USA) and then the animals were killed by pentobarbital overdose.
The overall variability of the PI and systolic AP (SAP) in the time domain was assessed by the standard deviation of the time series. Furthermore, PI and SAP fluctuations were assessed in the frequency domain by means of autoregressive spectral estimation. The theoretical and ana-lytical procedures for autoregressive modeling of oscillatory components have been fully described previously.10,13-15,25,26
Briefly, the PI and SAP series derived from each recording were divided into 300-beat segments with a 50% overlap. The spectra of each segment were calculated via the Levinson-Durbin recursion, and the order of the model cho-sen according to Akaike’s criterion, with the oscillatory components quantified in low (LF: 0.2 to 0.6 Hz) and high frequency (HF: 0.6 to 3.0 Hz) ranges.
Data are presented as mean ± SEM. Comparisons between the two groups were performed using Student’s unpaired t tests.
Pearson correlation was used to study association between vari-ables. The significance level was established as P < 0.05.
RESULTS
the diabetic (214±2 g) compared to the non-diabetic SHR group (255±4 g, p<0.05).
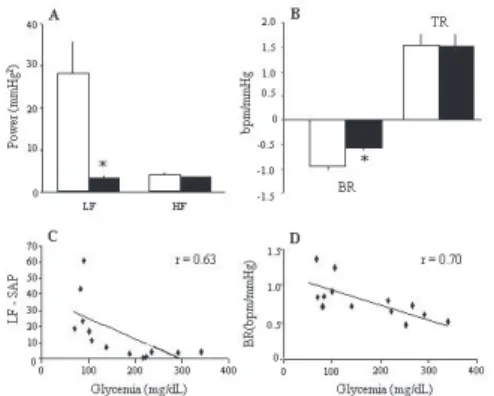
Diabetic-SHR showed lower MAP and HR (131±3 mmHg and 276±6 bpm) as compared to SHR (160±7 mmHg and 330±8 bpm). Reflex bradycardic response to phenylephrine administration was also lower in SHR+DM (0.55±0.10 bpm/mmHg) than in SHR (0.97±0.10 bpm/ mmHg, Figure 1B). Nevertheless, no differences were found in the reflex tachycardia elicited by decreasing MAP due to sodium nitroprusside in both groups (1.55±0.20 vs.
1.54±0.26 bpm/mmHg, for SHR+DM and SHR, respec-tively) (Figure 1B). Correlation analysis involving all ani-mals showed a significant inverse relationship between re-flex bradycardia sensitivity and the blood glucose level (r = 0.70, p < 0.01, Figure 1D).
The standard deviation of PI did not differ between the groups studied (6.2±0.7 vs. 4.9±0.3 ms, for SHR+DM and
SHR, respectively). On the other hand, the standard devia-tion of SAP was lower in SHR+DM (3.1±0.2 mmHg) as compared to the SHR (5.7±0.6 mmHg, p<0.05) (Figure 1A). Figure 2 shows representative spectra of PI and SAP from each group. As expected, the spectra presented two distinct oscillatory components, one in low (~ 0.4 Hz) and one in high (~ 1.5 Hz) frequency bands. The magnitude of the os-cillations for each group is described in Table 1. We found no differences in the power of the oscillatory components in the PI spectra either for SHR+DM and SHR. Neverthe-less, the SAP LF oscillation of the SHR+DM group was re-markably attenuated (~85%) as compared to SHR (Table 1 and Figure 1A). There was no difference in HF oscillations
of SAP between groups. Furthermore, the power of the SAP LF component was inversely correlated to the blood glucose level (r = 0.63, p<0.05, Figure 1C), indicating a clear rela-tionship between increased blood glucose and the power of the LF component of the SAP spectrum.
DISCUSSION
This study demonstrated that the induction of diabetes in the SHR enhances abnormalities usually seen in both ani-mal models individually, i.e. spontaneous hypertension and STZ-induced diabetes. Using spectral analysis approaches, we found decreased arterial pressure variability in STZ-treated SHR. Moreover, the well-documented impairment of
Figure 1:A- Average values of power spectral density (mmHg2) in the low (LF:0.2-0.6Hz) and high (HF:0.6-3.0Hz) frequency bands of systolic arterial pressure variability in SHR (white bars) and SHR+DM (black bars); B-Baroreflex index (bpm/mmHg) of bradycardic (BR) and tachycardic (TR) responses to arterial pressure changes in SHR (white bars) and SHR+DM (black bars); C- Negative correlation obtained by linear regression between power of low-frequency of systolic arterial pressure (LF-SAP, mmHg2) and glycemia (mg/dL) using data from both groups; D- Negative correlation obtained by linear regression between the bradycardic response (BR, bpm/mmHg) and glycemia (mg/dL) using data from both groups. *P<0.05 SHR vs. SHR+DM.
Table 1. Spectral parameters of pulse interval (PI) and systolic arterial pressure (SAP) variabilities in non-diabetic (SHR) and in diabetic spontaneously hypertensive rats (SHR+DM).
PI SHR (n=07) SHR+DM (n=07)
LF peak (Hz) 0.39±0.03 0.55±0.03
LF absolute (ms2) 1.5±0.8 1.0±0.2
LF (%) 7.2±3.1 4.3±0.8
HF peak (Hz) 1.51±0.07 1.41±0.03
HF absolute (ms2) 15.7±2.0 29.1±7.2
HF (%) 92.8±3.1 95.7±0.8
SAP
LF peak (Hz) 0.34±0.02 0.41±0.02
LF absolute (mmHg2) 28.2±7.6 3.30±0.8*
LF (%) 81.0±4.6 42.1±6.4*
HF peak (Hz) 1.51±0.08 1.41±0.03
HF absolute (mmHg2) 4.1±0.6 3.5±0.3
HF (%) 19.0±4.6 57.9±6.4*
Values are mean ± SEM. LF = low frequency; HF = high frequency. *
P<0.05 vs. non-diabetic SHR.
heart rate baroreflex control previously observed in SHR27
further depressed in diabetic-hypertensive rats.
Although of short duration (5 days), the diabetic state induced by STZ in spontaneously hypertensive rats pro-duced hyperglycemia associated with a decrease in body weight. As previously described in normotensive rats,5-9,11,20
STZ treatment led to a decreased MAP and HR. However, in the present study, blood pressure values were still kept at hypertensive levels in the diabetic-SHR. The mechanisms involved in these alterations have not been completely un-derstood. Osmotic diuresis causing hypovolemia or myo-cardial dysfunction reducing contractile force are putative mechanisms of the lower blood pressure observed in the normotensive STZ-diabetic rat.9,28,29 The recent observation
of enhanced endothelium-dependent vasodilation due to increased production of prostaglandin I2 and endothelium-derived hyperpolarizing factor in short-term STZ-diabetic mice is another mechanism that could contribute to hypo-tension in this similar animal model.30
The bradycardia found in SHR+DM may be related to decreased sympathetic nerve activity and/or reduced den-sity of myocardial b-adrenergic receptors, as well as to func-tional changes in cardiac cholinergic mechanisms,31,32
al-though these authors did not study hypertensive animals, as we did. Indeed, studies from our laboratory performing vagal and sympathetic blockade suggest changes in basal spontaneous pacemaker.6 There is evidence suggesting that
both sympathetic and parasympathetic function to the heart were reduced after STZ administration.6
In analyzing the alterations that occurred in arterial pressure and heart rate variability using spectral analysis approaches, we observed that the heart rate variability did not change with short-term STZ treatment in hypertensive rats. In fact, decreased heart rate variability has been re-ported only after long-lasting diabetes in normotensive rats using either time domain or spectral analysis.12,19,20 On the
other hand, we showed reduced arterial pressure variabil-ity in the SHR+DM, with reduction in the standard devia-tion (~67%) and also in the power of the low frequency os-cillations of SAP (~85%). Similarly, we have previously demonstrated decreased MAP variability in experimental normotensive diabetic rats.11,23 It is well-known that in
hu-mans and in rat animal models, the low frequency oscilla-tions of blood pressure correspond to the influence of the sympathetic fibers acting on the cardiovascular system.16,33,34
This reduced sympathetic influence on blood vessels could explain, at least in part, the lower blood pressure and its variability found in this SHR+DM group.
Moreover, changes in the low frequency oscillations may be related to alterations in baroreflex function.35 Indeed, our
data show that diabetes induced a blunted
baroreflex-medi-ated bradycardia in hypertensive rats, whereas reflex tachy-cardia remained unchanged. It is well known that spontane-ous hypertension in rats is associated with a depressed baroreflex control of heart rate not only during MAP in-creases, but also during MAP decreases.27 This study
dem-onstrated, for the first time, that diabetes might even further impair the reduced buffer function of the baroreceptors while reducing blood pressure.
The inverse correlation observed between either reflex bradycardic sensitivity or the power of LF oscillations of SAP and blood glucose levels reinforce the crucial role of metabolic changes in cardiovascular disorders in this animal model. Our laboratory observed similar results in a previous study, which demonstrated that heart rate and MAP variability were strongly correlated with urinary and plasmatic glucose.11,23
Sympathetic hyperactivity associated with reduced car-diac vagal function and blunted baroreflex sensitivity has been shown in SHR,27,36 while depressed baroreflex
sensi-tivity and changes in intrinsic heart rate have been reported in STZ-diabetic rats.5,6 In the present study, the association
of hypertension and diabetes seemed not to significantly change the previously observed impairment of the cardiac function in normotensive diabetic rats.4 In fact, Balbinott
et al.20 showed that diabetes associated with hypertension
induced by nitric oxide blockade determined similar results in cardiovascular system. Thus, the cardiovascular deficit observed in hypertensive-diabetic animals can be attributed at least in part to changes in the nitric oxide system. In-deed, in contrast to the usually observed increase in the ar-terial pressure variability of hypertension, diabetes induced a marked decrease in blood pressure variability. These re-sults are in agreement with the concept that, in hyperten-sion, there might be a shift in autonomic drive in favor of sympathetic excitatory drive mechanisms that was reduced by diabetes.26 In this context, the significant inverse
corre-lation between the systolic arterial pressure LF and blood glucose values observed in the present study supports the idea that the metabolic derangement of diabetes, in asso-ciation with hypertension, is associated with autonomic dys-function and cardiovascular impairment characterized by the uncoupling of heart rate and blood pressure. These find-ings cannot exclude, however, the participation of other cen-tral or peripheral control mechanisms in the pathophysiol-ogy of hypertension and diabetes association.
ACKNOWLEDGMENTS
RESUMO
276±6 bpm) em relação ao grupo SHR (160±7 mmHg e 330±8 bpm). A bradicardia reflexa a aumentos de PA es-tava atenuada no grupo SHR+DM quando comparada ao grupo SHR (0,55±0,1 vs 0,97±0,1 bpm/mmHg). A varia-bilidade da PAS no domínio do tempo (desvio padrão batimento-a-batimento da série temporal da PAS) foi me-nor no grupo SHR+DM (3,1±0,2 mmHg) quando compa-rada ao grupo SHR (5,7±0,6 mmHg). O desvio padrão do IP foi semelhante entre os grupos. O diabetes reduziu o componente BF da PAS (3,3±0,8 vs 28,7±7,6 mmHg2 no
SHR), mas não alterou o componente AF da PAS. Em re-lação aos componentes oscilatórios do IP não houve dife-rença entre os grupos.
CONCLUSÕES: Estes resultados sugerem que a associação
de hipertensão e diabetes causa uma importante diminuição da modulação simpática cardiovascular periférica que poderia, pelo menos em parte, ser responsável pela redução da PA. Além dis-so, este estudo demonstra que o diabetes pode, de fato, piorar a já reduzida função de tamponamento dos barorreceptores ao mesmo tempo em que reduz a pressão arterial.
UNITERMOS: Hipertensão. Diabetes. Análise Espectral.
Função Cardiovascular. Sensibilidade do Barorreflexo. Farah VMA, De AngelisK, Joaquim LF, Candido GO,
Bernardes N,Fazan Jr R, Schaan BD, Irigoyen MC. Modulação autonômica da pressão arterial e variabilidade da freqüência cardíaca em ratos hipertensos e diabéticos. CLINICS. 2007;62(4):477-82.
OBJETIVO: O objetivo do presente estudo foi investigar
a modulação autonômica do sistema cardiovascular em ra-tos espontâneamente hipertensos (SHR) e diabéticos por estreptozotocina (STZ), avaliando a sensibilidade do reflexo barorreceptor e a variabilidade da pressão arterial e da fre-qüência cardíaca.
MÉTODOS: Ratos SHR machos foram divididos em
gru-pos controle (SHR) e diabéticos (SHR+DM, 5 dias após STZ). A pressão arterial (PA) e a sensibilidade dos barorreceptores (avaliada pelas respostas taquicárdicas e bradicárdicas a alterações da PA) foram monitoradas. Os sinais de pressão arterial sistólica (PAS) e o intervalo de pulso (IP) foram analisados no domínio do tempo e da fre-qüência pelo método autoregressivo sendo quantificados os componentes oscilatórios de baixa (BF: 0,2-0,6Hz) e alta (AF:0,6-3,0Hz) freqüência.
RESULTADOS: A PA média e a freqüência cardíaca
es-tavam reduzidas no grupo SHR+DM (131±3 mmHg e
REFERENCES
1. UK Prospective Diabetes Study (UKPDS) Group. Intensive blood-glucose control with sulphonylureas or insulin compared with conventional treatment and risk of complications in patients with type 2 diabetes (UKPDS 33). Lancet. 1998; 352: 837-53.
2. Ewing DJ, Campbell IW, Clarke BF. The natural history of diabetic autonomic neuropathy. Q. J. Med. 1980; 49: 95-108.
3. Ferrer MT, Kennedy WR, Sahinen F. Baroreflexes in patients with diabetes mellitus. Neurology. 1991; 41: 1462-66.
4. De Angelis KL, Schaan BD, Maeda CY, Dall’Ago P, Wichi RB, Irigoyen M.C. Cardiovascular control in experimental diabetes. Braz. J. Med. Biol. Res. 2002; 35: 1091-100.
5. Maeda CY, Fernandes TG, Lulhier F, Irigoyen MC. Streptozotocin diabetes modifies arterial pressure and baroreflex sensitivity in rats. Braz. J. Med. Biol. Res. 1995a; 28: 497-501.
6. Maeda CY, Fernandes TG, Timm HB, Irigoyen M.C. Autonomic dysfunction in short-term experimental diabetes. Hypertension. 1995b; 26: 1100-04.
7. Dall’Ago P, Fernandes TG, Machado UF, Bello AA, Irigoyen MC. Baroreflex and chemoreflex dysfunction in streptozotocin-diabetic rats. Braz. J. Med. Biol. Res. 1997; 30:119-24.
8. Oliveira VL, Moreira ED, Farah VD, Consolim-Colombo F, Krieger EM, Irigoyen MC. Cardiopulmonary reflex impairment in experimental diabetes in rats. Hypertension. 1999; 34: 813-17.
9. De Angelis KL, Oliveira AR, Dall’Ago P, Peixoto LR, Gadonski G, Lacchini S, et al. Effects of exercise training on autonomic and myocardial dysfunction in streptozotocin-diabetic rats. Braz. J. Med. Biol. Res. 2000; 33: 635-41.
10. Task Force of the European Society of Cardiology and the North American Society of Pacing and Electrophysiology, Heart rate variability: standards of measurement, physiological interpretation and clinical use. Circulation. 1996; 93: 1043-65.
11. Schaan BD, Maeda CY, Timm HB, Medeiros S, Moraes RS, Ferlin E, et al. Time course of changes in heart rate and blood pressure variability in streptozotocin-induced diabetic rats treated with insulin. Braz. J. Med. Biol. Res. 1997; 30: 1081-86.
12. Fazan R Jr, Ballejo G, Salgado MC, Moraes MF, Salgado HC. Heart rate variability and baroreceptor function in chronic diabetic rats. Hypertension. 1997; 30: 632-35.
14. Farah VM, Elased KM, Chen Y, Key MP, Cunha T, Irigoyen MC, et al. Nocturnal hypertension in mice consuming a high fructose diet. Auton. Neurosci. 2006; 30; 130 (1-2): 41-50.
15. Joaquim LF, Farah V, Bernatova I, Fazan R, Grubbs R, Morris M. Enhanced Heart Rate Variability and Baroreflex Index after Stress and Cholinesterase Inhibition in Mice. Am.J.Physiol Heart Circ.Physiol. 2004; 287: H251-57.
16. Pagani M, Lombardi F, Guzzetti S, Rimoldi O, Furlan R, Pizzinelli P, et al. Power spectral analysis of heart rate and arterial pressure variabilities as a marker of sympatho-vagal interaction in man and conscious dog. Circ. Res. 1986; 59(2): 178-93.
17. Pagani M, Malfatto G, Pierini S, Casati R, Masu AM, Poli M, et al. Spectral analysis of heart rate variability in the assessment of autonomic diabetic neuropathy. J. Auton. Nerv. Syst. 1988; 23: 143-53.
18. Spallone V and Menzinger G. Diagnosis of cardiovascular autonomic neuropathy in diabetes. Diabetes. 1997; 46(Suppl 2): S67-S76. 19. Fazan R Jr, Dias da Silva VJ, Ballejo G, Salgado HC. Power spectra of
arterial pressure and heart rate in streptozotocin-induced diabetes in rats. J. Hypertens. 1999; 17: 489-95.
20. Balbinott AW, Irigoyen MC, Brasileiro-Santos Mdo S, Zottis B, de Lima NG, Passaglia J, Schaan BD. Dose-dependent autonomic dysfunction in chronic L-NAME-hypertensive diabetic rats. J Cardiovasc Pharmacol. 2005; 46(5):563-9.
21. Junod A, Lambert AE, Stauffacher W, Renold AE. Diabetogenic action of streptozotocin: relationship of dose to metabolic response. J. Clin. Invest. 1969; 48: 2129-39.
22. Dall’Ago P, Silva VOK, De Angeli KLD, Irigoyen MC, Fazan Jr R, Salgado HC. Reflex control of arterial pressure and heart rate in short-term streptozotocin diabetic rats. Braz J. Med Biol. Res. 2002; 35: 843-49.
23. Schaan BD, Dall’Ago P, Maeda CY, Ferlin E, Fernandes TG, Schmid H, et al. Relationship between cardiovascular dysfunction and hyperglycemia in streptozotocin-induced diabetes in rats. Braz J Med Biol Res. 2004; 37(12):1895-902.
24. Farah VM, Moreira ED, Pires MD, Irigoyen MC, Krieger E.M. Comparison of three methods for the determination of baroreflex sensitivity in conscious rats. Braz. J. Med. Biol. Res. 1999; 32: 361-69.
25. Baselli G, Cerutti S, Civardi S, Liberati D, Lombardi F, Malliani A, et al. Spectral and cross-spectral analysis of heart rate and arterial blood pressure variability signals. Comput. Biomed. Res. 1986; 19: 520-34.
26. Malliani A, Pagani M, Lombardi F, Cerutti S. Cardiovascular neural regulation explored in the frequency domain. Circulation. 1991; 84: 482-92.
27. Widdop RE, Verberne AJ, Jarrott B, Louis WJ. Impaired arterial baroreceptor reflex and cardiopulmonary vagal reflex in conscious spontaneously hypertensive rats. J. Hypertens. 1990; 8: 269-75. 28. Hebden RA, Gardiner SM, Bennett T, MacDonald IA. The influence of
streptozotocin-induced diabetes mellitus on fluid and electrolyte handling in rats. Clin. Sci. 1986; 70(1): 111-17.
29. Litwin SE, Raya TE, Anderson PG, Daugherty S, Goldman S. Abnormal cardiac function in the streptozotocin-diabetic rat. J. Clin. Invest. 1990; 86: 481-88.
30. Shen B, Y CL, Liu JJ, Sun P, Jiang JH. Mechanism underling enhanced endothelium-dependent vasodilation in thoracic aorta of early stage streptozotocin-induced diabetic mice. Acta Pharmacol. Sin. 2003; 24(5): 422-28.
31. Latifpour J, McNeill JH. Cardiac autonomic receptors: effect of long-term experimental diabetes. J. Pharmacol. Exp. Ther. 1984; 230: 242-49. 32. Savarese JJ and Berkowitz BA. Beta-adrenergic receptor decrease in
diabetic rat hearts. Life Sci. 1979; 25: 2075-78.
33. Cerutti C, Gustin MP, Paultre CZ, Lo M, Julien C, Vincent M, Sassard J. Autonomic nervous system and cardiovascular variability in rats: a spectral analysis approach. Am. J. Physiol. 1991; 261: H1292-99.
34. Stauss HM, Mrowka R, Nafz B, Patzak A, Unger T, Persson PB. Does low frequency power of arterial blood pressure reflect sympathetic tone? J. Auton. Nerv. Syst. 1995; 54(2): 145-54.
35. Robbe HW, Mulder LJ, Rüddel H, Langewitz WA, Veldman JB, Mulder G. Assessment of baroreceptor reflex sensitivity by means of spectral analysis. Hypertension. 1987; 10: 538-43.