AR
TIGO
AR
TICLE
1 Programa de Pós- Graduação em Clima e Ambiente, Instituto Nacional de Pesquisas da Amazônia. Av. André Araújo 2936, Aleixo. 69060-000 Manaus AM Brasil. pamorellifonseca@ gmail.com
2 Escola Nacional de Saúde Pública, Fiocruz. Rio de Janeiro RJ Brasil. 3 Secretaria de Estado de Meio Ambiente. Rio Branco AC Brasil.
4 College of Engineering, Mathematics and Physical Sciences, University of Exeter. Exeter United Kingdom.
5 Woods Hole Research Center. Falmonth Massachusetts United States.
Using satellite data to study the relationship between rainfall
and diarrheal diseases in a Southwestern Amazon basin
O uso de dados de satélite para estudar a relação entre chuva
e doenças diarreicas em uma bacia na Amazônia Sul-Ocidental
Resumo A região Norte é a segunda no Brasil com a maior taxa de incidência de doenças diarreicas em crianças menores de 5 anos. O objetivo deste estudo foi investigar a relação entre chuva e nível do rio, principalmente durante a estação chuvosa, com a taxa de incidência da referida doença em uma bacia no sudoeste da Amazônia. Estimativas de chuva e nível do rio foram correlacionadas e ambos correlacionados com a taxa de incidência da diarreia. Para a região do Alto Acre, 2 a 3 dias de defasagem é o melhor intervalo para observar o impacto da chuva no nível do rio (R = 0.35). Na região do Baixo Acre essa defasagem aumentou (4 dias) com redução na correlação. A correlação en-tre chuva e doenças diarreicas foi melhor na região do Baixo Acre (Acrelândia, R = 0.7) e a chuva rio acima da cidade. Entre o nível do rio e as doenças diarreicas, os melhores resultados foram encontra-dos para a estação de Brasiléia (casos em Brasiléia, R = 0.3 e Epitaciolândia, R = 0.5). Os resultados deste estudo podem dar apoio ao planejamento e alocação de recursos financeiros para priorizar ações para Defesa Civil e serviços de saúde antes, durante e depois da estação chuvosa.
Palavras-chave Diarreia infantil, Estação chu-vosa, Sensoriamento remoto, Vigilância em saúde ambiental, Amazônia Brasileira
Abstract The North region is the second region in Brazil with the highest incidence rate of diar-rheal diseases in children under 5 years old. The aim of this study was to investigate the relation-ship between rainfall and water level during the rainy season principally with the incidence rate of this disease in a southwestern Amazon basin. Rainfall estimates and the water level were cor-related and both of them were corcor-related with the diarrheal incidence rate. For the Alto Acre region, 2 to 3 days’ time-lag is the best interval to observe the impact of the rainfall in the water level (R = 0.35). In the Lower Acre region this time-lag in-creased (4 days) with a reduction in the correla-tion value was found. The correlacorrela-tion between rainfall and diarrheal disease was better in the Lower Acre region (Acrelândia, R = 0.7) and rainfall upstream of the city. Between water level and diarrheal disease, the best results were found for the Brasiléia gauging station (Brasiléia, R = 0.3; Epitaciolândia, R = 0.5). This study’s results may support planning and financial resources allocation to prioritize actions for local Civil De-fense and health care services before, during and after the rainy season.
Key words Infant diarrhea, Rainy season, Re-mote sensing, Environmental health surveillance, Brazilian Amazon
Paula Andrea Morelli Fonseca 1
Sandra de Souza Hacon 2
Vera Lúcia Reis 3
Duarte Costa 4
F
o
nse
ca P
Introduction
Under normal climate conditions, diarrheal dise-ases and pneumonia are the major cause of mor-tality among children under five years, especially in poorer countries, which represent 29% of total
deceased in an annual base worldwide1. However,
these diseases have been widely reported after geophysical disasters, and hydrometeorological
events such as floods2. According to statistics
ob-tained from the Mortality Information System
in Brazil3 under the Informatics’ Department
of the Health System (DATASUS) from 1996 to 2012, diarrhea and gastroenteritis arise as one of the main causes of children mortality in Brazil.
In Northeast region, this disease is the 4th cause
of death (6.2 cases per 1,000 children). Never-theless it must be considered the higher number of children in this specific region. In the North
and Central-West regions diarrhea is the 8th main
cause of infant mortality with an incidence rate of 2.4 and 1.7 per 1,000 children respectively.
Several studies have been trying to establish a link between the occurrence of water borne in-fectious diseases (as diarrhea) and climatic and
hydrological patterns4,5. Some studies analyzed
data related to climate extremes and flood
epi-sodes to discuss the impacts on health6,7. Some
of the water diseases related to climatic extreme events are cholera, leptospirosis, hepatitis, ba-cillary dysentery and typhoid fever. These extre-mes episodes lead to a decrease in hygiene habits due to shortage of fresh water and the damage caused by the lack of sewage system. In addition, the high number of people accommodated in shelters during the flood period increases altoge-ther the incidence of these diseases.
Since 2012, southwestern Amazon has been
severely affected by extreme floods8,9. In 2014,
Rio Branco’s mayor, the capital of Acre State, declared the emergency state alongside with Pe-ruvian, Bolivian and other Brazilian cities. More than 2.000 houses were affected in the capital of Acre. Recently, during the 1st semester of 2015 another flood event affected this region and again exposed the Amazonian population to the
impact of waterborne diseases10.
The number of meteorological stations and rain gauges is very limited in Amazonia conside-ring the nature, scale, dynamic and microphysi-cs involved in the rainfall events in the tropimicrophysi-cs,
usually caused by local convection11. Satellite data
provides a useful alternative to allow filling the
absence of locally measured data12-15. Therefore
in Acre basin there is no previous work
valida-ting any satellite rainfall estimates. Thus, this work aims to a) evaluate the satellite rainfall es-timates for the Acre Basin; b) analyze the corre-lation between these estimates and: 1) water level in three cities along river Acre, 2) Investigate the incidence rates of infant diarrheal diseases across all municipalities in the river Acre Basin.
Materials and methods
Study Area
The Acre State, which is located at the sou-thwestern Amazon, is characterized by a
seaso-nal rainfall regime monsoon7,16, with an annual
rainfall approx. 1,960 mm17. It is in the border
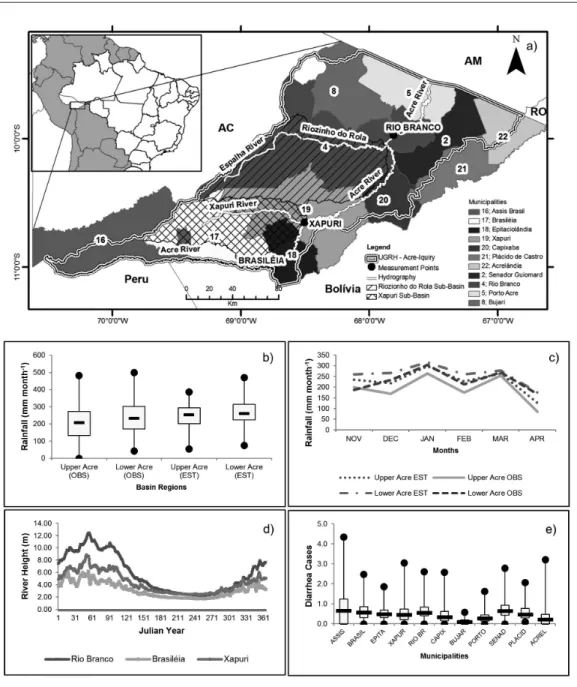
with the Peruvian and Bolivian departments of Madre de Dios and Pando respectively, as shown in Figure 1 a. The Acre basin, which is in the eas-tern side of Acre State, comprises approximately
30,000km2,18. This basin is basically divided in
Xapuri and Riozinho do Rola sub-basins. It co-vers 11 municipalities and they are distributed in two geopolitical regions Alto (Upper) and Baixo (Lower) Acre. Rio Branco is the Acre’s state capi-tal localized downstream Riozinho do Rola River that has a crucial role on the flood process in this city. Approximately 65% of the ~770,000 Acre State population lives in these regions and 6% of them are children under 5 years old, half of this
percentage lives in the east of Acre19.
The river water level data sources
Water level daily data series were obtained
from the National Water Agency20 for three
gau-ging station: in Brasiléia and Xapuri, both in the Xapuri sub basin, and data series available to 1998-2006 and 2001-2012 period, respectively, and in Rio Branco, Riozinho do Rola sub basin, with data available for 1998-2012 period.
Difficulties regarding maintenance of the equipment (station or rain gauges) and logistic problems are some of the reason why the data from some of the stations are not updated.
Rainfall observed data source
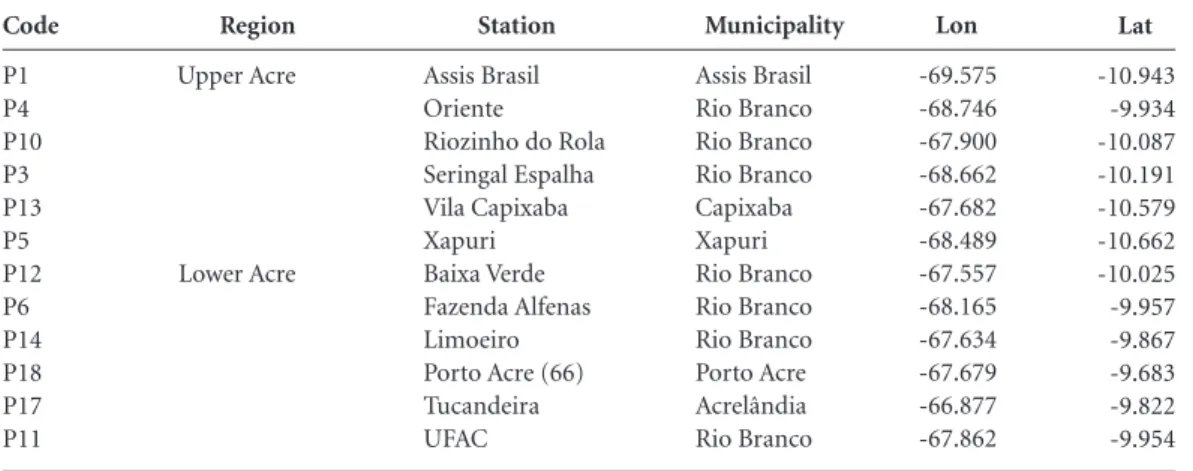
This study used daily records of the 12 rain
gauges from AcreBioClima Project21 for the
be-e C
ole
tiv
a,
21(3):731-742,
2016
F
o
nse
ca P
cause 83% of the total annual rainfall is recorded
during this semester17.
These rain gauges were split into Upper and Lower Acre (six for each) with a balanced distri-bution of the available stations in order to show the series behavior.
Rainfall estimated data source
The Tropical Rainfall Measuring Mission22
co-vers the latitudes from 50oN to 50oS and provides
information on a 3-hour time through the 3B42RT product. In this work it was used a derived version of the 3B42 data provided in a daily basis available
from 1998-2015-Feb15,23. TRMM’s spatial
resolu-tion is 0.25o x 0.25o degrees and it corresponds to
grid cells of 625 km2 approximately.
Infant Diarrheal Diseases Incidence Cases
The statistic of infant diarrheal diseases from the Acre State Health Secretary was obtained for the 2000-2012 period on a monthly basis. See
PULSE-Brazil website24 in order to access this
data series.
Our focus was children under 5 years old and the data were extracted from the Acute Diarrhea Daily Monitoring System also known by the acronym SIVEP-DDA. The dataset was used to calculate the incidence rate for each municipality. According to World Health Organization (WHO) diarrheal diseases is classified in the International Classification of Diseases (ICD) under code 10, in Chapter I, and it covers the A00-A09 subtypes,
which range from cholera to gastroenteritis and colitis of infectious and unspecified origin. In other words, it includes the three main causes of
the disease virus, protozoa and bacteria25.
Satellite Rainfall Validation
Rainfall observed data series were used to evaluate and validate the satellite data for this geographic location to which TRMM data had never been tested before.
Rainfall estimates from TRMM were
extrac-ted using the AcreBioClima geographic
coordi-nates for the stations available in the Acre basin and both datasets were compared against each
other through a contingency table26,27, as can be
found in Wilks (2011, p. 261)26. This verification
procedure is essential to validate the quality and coherence of satellite-retrieved climate variables in the context of a specific spatial and seasonal/ temporal scale of analysis. Finally, validated esti-mates are more comparable to other studies and products.
From the contingency table it was possible to calculate the following indexes: Proportion Cor-rect (PC), Critical Success Index (CSI), Bias, False Alarm Ratio (FAR), Hit rate (H) and Probabili-ty of False Detection (POFD). The formulas for each of them are described in Equation 1-6.
PC =
Equation 1: Proportion correct (PC)
Where, Lat -10.943 -9.934 -10.087 -10.191 -10.579 -10.662 -10.025 -9.957 -9.867 -9.683 -9.822 -9.954 Code P1 P4 P10 P3 P13 P5 P12 P6 P14 P18 P17 P11 Region Upper Acre Lower Acre Station Assis Brasil Oriente
Riozinho do Rola Seringal Espalha Vila Capixaba Xapuri Baixa Verde Fazenda Alfenas Limoeiro Porto Acre (66) Tucandeira UFAC
Table 1. Rain gauges with data available for the NOV-APR semester to 2006-2013.
Municipality Assis Brasil Rio Branco Rio Branco Rio Branco Capixaba Xapuri Rio Branco Rio Branco Rio Branco Porto Acre Acrelândia Rio Branco Lon -69.575 -68.746 -67.900 -68.662 -67.682 -68.489 -67.557 -68.165 -67.634 -67.679 -66.877 -67.862
Source: AcreBioClima (2013).
(a + d)
e C
ole
tiv
a,
21(3):731-742,
2016
a = rainfall events both observed and estima-ted
d = rainfall events neither observed nor es-timated
n = number of days analyzed (n), or sample size.
CSI =
Equation 2: Critical success index (CSI)
Where,
b = total rainfall events observed and not es-timated
c = rainfall events only observed.
Bias =
Equation 3: Ratio of the estimated and preci-pitated rainfall events.
FAR =
Equation 4: False Alarm Ratio
H =
Equation 5: Hit rate
POFD =
Equation 6: Probability of false detection.
Rainfall estimates and water level were cor-related assuming that the daily estimates would directly influence the water level in the three gau-ging station chosen and a shorter or longer time lag would be better to represent that influence. For the correlation analysis between rainfall and diseases, it was considered that the monthly ac-cumulated rainfall in each pixel within a muni-cipality have an influence in the incidence rate of diarrheal diseases in this municipality. For the correlation between river water level and diarrhea diseases, it was chosen three parameters
combi-nation: monthly water level mean versus diarrhea
incidence, monthly maximum water level versus
diarrhea incidence and monthly minimum water
level versus diarrhea incidence. It was maintained
all cities independent of its location in the basin (whether if it was up or downstream from where the water level was measured).
Results
Testing TRMM dataset
The results obtained through the analysis of contingency table have PC = 73% and CSI = 67%, and the higher the result the more accura-te are the estimaaccura-tes. The Critical Success Index value means that the total hits for the rainfall es-timates are higher than all the times it missed or generated a false alarm (estimated a rainfall event that was not captured by the station). For bias it was obtained 1.07 which indicates that there is a balance and the satellite estimates are not sub/ overestimating the number of events. It also ac-counts for estimation accuracy. To evaluate relia-bility and resolution it was calculated FAR, 22%, and H, 83%. Last index, POFD resulted in 49%.
Figure 1, graphic b, presents the rainfall data observed and estimated divided by region, Upper and Lower Acre regions. Median values for both data sources and for both regions vary from approx. 200 to 260 mm monthly. Maxi-mum values floats around 400 mm (estimated) and 500 mm (observed). The minimum values present differences lower than 100 mm compa-ring the two sources / two regions and they float around 100 mm for the upper range limit.
In Figure 1 c the monthly estimated values ba-sically follow the observed ones which implies in a good representation of the seasonal behavior. Cor-relation values obtained between rain gauges’ series (observed) and TRMM values were around 0.4.
Figure 1 d introduces the water level explora-tory analysis showing the observed daily average during the year, which was built using the time series available. Characteristics as the location of the city relative to the main rivers and the tribu-taries were taken into consideration to analyze these results.
When a time-lag is applied it is observed a spatial coherence between the rainfall estimates and the water level at Brasiléia gauging station. The higher correlation values obtained was for 2 and 3 days lag, as shown in Figure 2, maps A and
B (R ≈ 0.35). These values are the pixels in light
grey on the left side of the white dot that indica-tes the station. The three pixels in the left bottom correspond to Assis Brasil municipality that is less than 100 km from Brasiléia. This confirms that the water transit time is higher the further the rainfall is upstream.
Xapuri gauging station presents the strongest signals during the 3 and 4 day lag as shown in
a a + b + c
a + b a + c
b (a + b)
a a + c
F
o
nse
ca P
Figure 2, maps C and D (R ≈ 0.35) and it
repre-sents the critical time-lags for the water level in Xapuri to respond to rainfall events in the ups-tream basin.
Rio Branco gauging station shows the stron-gest signals for 4 and 5 day lag, as shown in Figure
2, maps E and F (R ≈ 0.31). The pixels located
upstream the measurement point have stronger correlation coefficients as the time-lag increa-ses. Short time-lags have low correlation values indicating that rainfall relates with water level in this gauging station more frequently after a mini-mum time-lag of 3 days.
From Figure 2 e, a pixel in the northwest part of the basin highlights an area of higher influen-ce on the water levels (light grey). This particular pixel corresponds to Espalha River, a small
tri-butary of the Riozinho do Rola River. This pixel maintains higher values until the final time-lag is applied even though its neighbor’s pixels pre-sents lower values as the lag increases. It is not clear why this pixel maintains a higher correla-tion value despite of the decrease presented by the neighbor pixels. However, the fact that it is next to northern limit of the basin an area that probably has higher altitude values would ex-plain why this area has a larger contribution to the water level variation.
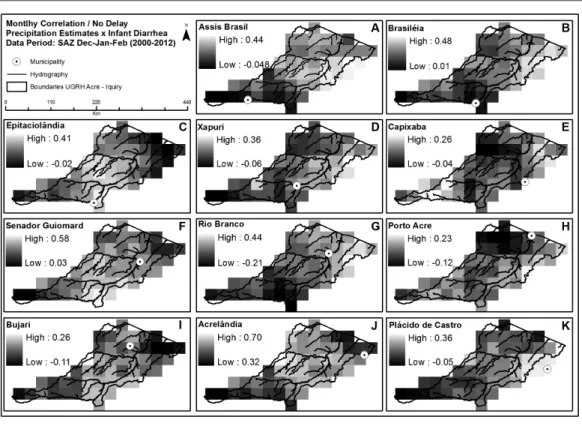
Correlation: rainfall estimates versus diarrheal diseases cases
Box plots for the incidence rate of infant diar-rheal diseases cases are shown in Figure 1 e for
e C
ole
tiv
a,
21(3):731-742,
2016
the eleven municipalities. As the ratio numbers are low (incidence rate) for most of the cities it is difficult to analyze the data. The median values for these cities are around 0.5 (less than one case per 1,000 children). Maximum extreme values are for Assis Brasil (> 4) and Acrelândia (> 3).
Figure 3 b and k show overlapping between the rainfall pixel and the cities, Epitaciolândia and Plácido de Castro, suggesting that the rainfall in that period had an influence in the diarrhea cases in these cities. However, the correlation is not as higher than Senador Guiomard and Acre-lândia cities where the pixels with the highest values are located upstream the city.
Correlation: water level data versus diarrheal diseases cases
The results presented in this section compri-se the correlation values obtained from the water level data and the diarrheal diseases cases (Figure 4 a-c).
Diarrheal diseases recorded in the neighbo-ring cities, Epitaciolândia and Brasiléia, show good correlation values with the Brasiléia
gau-ging station (0.7 and 0.5 respectively, Figure 4 a). However, Xapuri and Rio Branco gauging station show low correlation values with the diseases case registered in the respectively cities.
Discussion
Rainfall estimates validation
Rainfall estimates obtained through remote sensing methods have been used due to its enor-mous advances in areas with difficult access and logistic (such as Amazonia).
The rainfall estimates validation performed for TRMM using the contingency table found a bias next to a unit, and it is less than what was
found in Santos e Silva et al.28.
For the FAR index, the value obtained is re-asonable when compared to the 25% approx.
obtained in Santos e Silva et al.28 but it was
hi-gher than 0.15 found in Scheel et al.29 study
whi-ch performed a similar validation process using 3B42-V6 in the Peruvian and Bolivian territory during the rainy season (DJF).
F
o
nse
ca P
The value obtained for H means that the es-timation achieves 4/5 rainfall events and it is a very good proxy in qualitative terms being higher
than the ~77% found in Scheel et al.29. Moffitt
et al.30 analyzing H, which authors named
Pro-bability of Detection index (POD), for the pre-vious version of the TRMM product 3B42V6
(3h) found values of approximately 57% for rain gauges in the Ganges, Brahmaputra and Mehg-na basins in Bangladesh. Using these values as a threshold it is assumed that the value obtained in this study is a reasonable match. Authors also found that there are more hits during the rainy season (monsoon) then on the dry season
e C
ole
tiv
a,
21(3):731-742,
2016
monsoon). Due to the data scarcity, it was not possible to test this hypothesis in our study. The value obtained for POFD index means that the-re is a 50% percentage of a false event actually being a non-occurrence of rainfall. This value is more than twice of what was found in Moffitt et
al.30. Authors attributed it to an inherited
uncer-tainty of the satellite estimates. Improvements in the newest version of 3B42 (3h) algorithm are
analyzed in the Zulkafli et al.14 study as the
re-duction of the negative bias especially during the rainy season and probably due to the inclusion of more rain gauges in the validation process. It was reassuring for our purposes the accuracy me-asures being above 60%, the fact that it does not overestimate the number of events and a small false alarm ratio (less than 30%).
This specific TRMM product used in our analysis aggregates the best of all TRMM set of sensors and even data from other satellites al-though it is still a proxy from the real data (in-direct measurement) and it has limitations. The convection processes in this region has characte-ristics as the weak horizontal fluxes and the fact that most of the momentum is vertical and
ha-ppens during one-hour time-space31 which are
not properly accounted by the sensors and it may lead to over/underestimates. However, TRMM estimates provide a good dataset to analyze rain-fall events in this area and its main advantages are due to their availability, spatial resolution, and the series length (15 yr. long). The estimated rainfall pattern in the Upper and Lower Acre is similar to the observed one, although the corre-lation value between both datasets is low (~0.4). Our hypothesis to the low correlation is the fact that the datasets were compared to each other directly, instead of using mean or accumulated values per municipality. No statistical technique or filters were applied in order to smooth pos-sible failures in these series as the ones listed in
Collischonn et al.13.
Although the correlation values are statisti-cally low, we classified them as relevant or high when compared with the results presented in each map or graphic.
Rainfall Estimates versus Water Level
The results for the correlation between rain-fall estimates and water level presented a good correspondence despite the low values for the three cities analyzed. The seasonal analysis (not shown) did not improve the results shown here. A hypothesis that might explain this is that longer
time intervals would smooth other factors that might be influencing the river seasonal behavior.
There is no correlation between instanta-neous values for the rainfall estimates analysis whether it is with water level or diseases. However the results improve when it is applied 1 to 4 days time-lag, for the rainfall and water level analysis. After 5 day time-lag the correlation values tends to be very low.
Comparing the three gauging stations in the first analysis performed, rainfall estimates and water level, the best correlation values was found in Xapuri for 3 day time-lag (R = 0.35).
The results of the Brasiléia gauging station might be influenced by the exclusion of the basin area that does not belong to the Brazilian territory. The rainfall near the station influences the water level for a few hours when it does so, be-cause there are cases when these amounts of rain join the river downstream or even infiltrates the soil. The effects of flash floods with rapid res-ponse on the water level are not registered in the official records, because it usually lasts less than 24 hours.
Diarrheal diseases analysis
It was found an acceptable correlation betwe-en the hydrologic variables (rainfall and water level) and diarrheal diseases. It can be due to the short time series available, data gaps and due to the temporal interval in which the analysis were performed (e.g. diarrheal cases are monthly grou-ped). The result might improve if the diseases statistics were available in a higher frequency (e.g.
weekly) which was also suggest by Curriero et al.32.
This study was not able to show the rela-tionship during the rainy period between rainfall and water level and the diarrheal diseases. Howe-ver, for Epitaciolândia e Plácido de Castro the correlation values obtained for rainfall and diar-rheal disease suggest that the rainfall around the city could influence the disease series. Carlton et
al.33 also suggested that the highest incidence of
diarrheal diseases occurs during the rainy season and that the most affected cities are the ones with
low sanitation coverage. Torres et al.34 assert that
the increase in population in urban areas leads to an increase in the pressure and demands for the sanitation system. And although the improve-ments in the basic Health Attention helped to di-minish the number of deaths caused by diarrheal diseases, the lack of adequate sanitation systems maintained the number of cases. According to
pro-F
o
nse
ca P
vides a median infrastructure and health services in the state, and concentrates most of the state’s
population. A study performed by Oliveira et al.36
for Minas Gerais State, in the Southeast Brazilian region, showed that the increase in the coverage of the sanitation system combined with the ac-tual coverage of the water system could reduce in almost 5% the fraction of diarrheal disease in children less than 5 years attributed to these two infrastructure characteristics.
There were no coherent values between rain-fall and Brasiléia diarrheal diseases cases however high correlation values were found between the water level data in Brasiléia and diarrheal diseases cases in both Epitaciolândia (0.7) and Brasiléia (0.5). It can be due to the fact that the analysis with rainfall does not include the Bolivian part of the basin and on the other hand the water level data indirect includes the runoff provided by the excluded area or due to a different response time between the rainfall event and a possible impact on infant’s health. Another possibility to explain these findings may be the distance from the pla-ce of residenpla-ce and health servipla-ces. However, we could not get data in time for analysis.
Conclusion
This study showed that the rainfall satellite esti-mates is a good indicator of the rainfall distribu-tion in the Acre basin. It allows the use of this data series to support local public policies and actions of various groups such as civil defense, health professionals to better plan and prioritize the financial and human resources available, and mitigate the impact of floods to the local popu-lation. Moreover, these estimate also allowed an analysis of the influence of rainfall upstream in the water level in three gauging stations in the Acre basin.
It is a first approach to aggregate satellite in-formation on water level for children ´s diarrheal diseases analyses in the Amazon basin. It is ne-cessary to deepen statistical analysis, which could allow a better understanding of these processes. Knowing the response time between a rainfall event and its impact on the river and consequen-ces to the population’s health are important issues when it comes to planning response and early warning in case of floods or even extreme rainfall events. Recent studies using climate projections indicate an increase in extreme rainfall events in
Amazon37,38 and on the discharge of the
Amazo-nian rivers39. This type of study can contribute to
the projections of health impacts associated with the flooding of the rivers of Amazonia, and con-sequently help government entities in the stra-tegies of early actions to the local people. Such analysis can improve the preparedness and help the government to adapt its strategies to help the population. The location, strength and time-lag of the spatial correlation calculated here indicate that rainfall is not the only environmental varia-ble explaining the behavior of water level or the occurrence of infant diarrheal diseases cases.
Finally, considering the possible relationship between diarrheal diseases and rainfall behaviour and the fact that other states in the Brazil North region have worse diarrheal diseases ratios there is a scope to replicate this methodology in other contexts within the Brazilian Amazon.
Collaborations
PAM Fonseca participated in all the phases of the study going through bibliographic revision, data gathering, analysis and the process of writing the manuscript. SS Hacon was responsible for the project supervising and orientation, methodolo-gical approach, data analysis, discussion and the final writing revision. VL Reis was responsible for the project supervising, data gathering and review process. D Costa and IF Brown partici-pated in the data gathering, analysis and writing and review process.
Aknowledgments
e C ole tiv a, 21(3):731-742, 2016
Marengo JA, Liebmann B, Grimm AM, Misra V, Silva Dias PL, Cavalcanti IFA, Carvalho LMV, Berbery EH, Ambrizzi T, Vera CS, Saulo AC, Nogues-Paegle J, Zip-ser E, Seth A, Alves LM. Recent developments on the South American monsoon system. Int J Climatol 2012; 32(1):1-21.
Duarte AF. Aspectos da Climatologia do Acre, Brasil, com base no intervalo 1971-2000. Rev. Bras. Meteorol. 2006; 21(3b):308-317.
Ministério Público do Acre (MPE/AC). Caracterização Socioambiental das Bacias Hidrográficas do Estado do Acre. Rio Branco: MPE/AC; 2009.
Instituto Brasileiro de Geografia e Estatística (IBGE). [cited 2013 Dec 1]. Available at: http://www.ibge.gov. br/home/
Agência Nacional de Águas (ANA). HidroWeb: Sistema de Informações Hidrológicas. [cited 2013 Dec 1]. Avai-lable at: http://hidroweb.ana.gov.br/
Grupo de Estudos e Serviços Ambientais (AcreBioCli-ma). [cited 2013 Dec 1]. Available at: http://acrebiocli-ma.net/
Tropical Rainfall Measuring Mission Database (TRMM). [cited 2013 Dec 1]. Available at: ftp://disc2. nascom.nasa.gov/data/TRMM/Gridded/Derived_Pro-ducts/3B42_V7/Daily/
Huffman GJ, Adler R, Bolvin D, Nelkin E. The TRMM Multi-Satellite Precipitation Analysis (TMPA). In: Gebremichael M, Hossain F, editors. Satellite Rainfall
Applications for Surface Hydrology. New York: Springer;
2010. p. 3-22.
Impact of Climate Extremes on Ecosystem and Human Health in Brazil (PULSE-Brazil). [cited 2013 dec 1]. Available at: http://www.pulse-brasil.org/tool/ World Health Organization. International Statistical Classification of Diseases and Related Health Problems 10th Revision (ICD-10)-2015-WHO. [cited 2015 Aug 1]. Available at: http://apps.who.int/classifications/ icd10/browse/2015/en#/I
Wilks DS. Nonprobabilistic Forecasts of Discrete Pre-dictands. In: Wilks DS. Statistical Methods in the
At-mospheric Sciences. 2nd ed. Burlington: Academic Press;
2006. p. 260-275.
Warner TT. Verification Model. In: Warner TT. Nume-rical weather and climate prediction. Cambridge: Cam-bridge University Press; 2011. p. 294-320.
Santos e Silva CM, Lúcio PS, Spyrides MHC. Distri-buição espacial da precipitação sobre o Rio Grande do Norte: estimativa via satélites e medidas por pluviôme-tros. Rev Bras. Meteorol. 2012; 27(3):337-346.
Scheel MLM, Rohrer M, Huggel C, Santos Villar D, Silvestre E, Huffman GG. Evaluation of TRMM Multi-satellite Precipitation Analysis (TMPA) performance in the Central Andes region and its dependency on spatial and temporal resolution. Hydrol. Earth Syst. Sci. 2011; 15:2649-2663.
Moffitt CB, Hossain F, Adler RF, Yilmaz KK, Pierce HF. Validation of a TRMM-based global Flood Detection System in Bangladesh. Int J Appl Earth Obs Geoinf 2011; 13(2):165-177. 16. 17. 18. 19. 20. 21. 22. 23. 24. 25. 26. 27. 28. 29. 30. References
World Health Organization (WHO). World Health Statistics 2013. [accessed 2014 Dec 1]. Available at: http://www.who.int/gho/publications/world_health_ statistics/2013/en/
Floret N, Viel JF, Mauny F, Hoen B, Piarroux R. Negligi-ble risk for epidemics after geophysical disasters. Emerg
Infect Dis 2006; 12(4):543.
Ministério da Saúde, Secretaria de Vigilância em Saúde MS/SVS/SIM. Sistema de Informações de Mortalidade (SIM). [accessed 2013 Dec 1]. Available at: http://tab-net.datasus.gov.br/cgi/deftohtm.exe?idb2012/c06.def Epstein PR. Climate Change and emerging infectious diseases. Microbes Infect 2001; 3(9):747-754.
Kovats RS, Bouma MJ, Hajat S, Worral E, Haines A. El Niño and health. Lancet 2003; 362(9394):1481-1489. Alderman K, Turner LR, Tong S. Floods and human health: A systematic review. Environ Int 2012; 47:37-47. Kozama S, Aizawa T, Watanabe T, Ranjan P, Gunawar-dhana L, Amano A. A quantitative risk assessment of waterborne infectious disease in the inundation area of a tropical monsoon region. Sustainable Sciences 2012; 7(1):45-54.
Espinoza JC, Ronchail J, Frappart F, Lavado W, Santini W, Guyot JL. The Major Floods in the Amazonas River and Tributaries (Western Amazon Basin) during the 1970-2012 Period: A Focus on the 2012 Flood. J
Hydro-meteorol 2013; 14:1000-1008.
Espinoza JC, Marengo JA, Ronchail J, Carpio JM, Flo-res LN, Guoyt JL. The extreme 2014 flood in the South -western Amazon basin: the role of tropical-subtropi-cal South Atlantic SST gradient. Environ Res Lett 2014; 9:124007.
Portal de Notícias da Globo (G1). União reconhece ca-lamidade em Rio Branco; 300 militares dão apoio. [ac-cessed 2015 Mar 1]. Available at: http://g1.globo.com/ ac/acre/noticia/2015/03/uniao-reconhece-calamida-de-em-rio-branco-300-militares-serao-enviados.html Wallace JM, Hobbs PV. Cloud Microphysics. In: Walla-ce JM, Hobbs PV. Atmospheric scienWalla-ce: an introduc-tory survey. Burlington: Academic press; 2006. p. 209-263. (Vol. 92).
Santos e Silva CM, Lúcio OS, Spyrides MHC. Distri-buição espacial da precipitação sobre o Rio Grande do Norte: estimativa via satélites e medidas por pluviôme-tros. Rev. Bras. Meteorol. 2012; 27(3):337-346. Collischonn B, Allasia D, Collischonn W, Tucci CEM. Desempenho do satélite TRMM na estimativa de pre-cipitação sobre a bacia do Paraguai Superior. Rev. Bras.
Cartograf. 2007; 59(1):93-99.
Zulkafli Z, Buytaert W, Onof C, Manz B, Tarnavsky E, Lavado W, Guyot JL. A Comparative Performance Analysis of TRMM 3B42 (TMPA) Versions 6 and 7 for Hydrological Applications over Andean-Amazon River Basins. J Hydrometeorol. 2014; 15:581-592.
F
o
nse
ca P
Fisch G, Vendrame IF, Hanoaka PCDM. Variabilidade espacial da chuva durante o experimento LBA/TRMM 1999 na Amazônia. Acta Amazon 2007; 37(4):583-590. Curriero FC, Patz JA, Rose JB, Lele S. The association between extreme precipitation outbreaks in the Uni-ted States, 1948-1994. Am J Public Health Res 2001; 91(8):1194-1199.
Carlton EJ, Eisenberg JN, Goldstick J, Cevallos W, Tros-tle J, Levy K. Heavy rainfall events and diarrhea inci-dence: the role of social and environmental factors. Am
J Epidemiol 2013; 179(3):344-352.
Torres RMC, Bittencourt SA, Oliveira RM De, Siquei-ra ASP, Sabroza PC, Toledo LM. Uso de indicadores de nível local para análise espacial da morbidade por diar-reia e sua relação com as condições de vida. Cien Saude
Colet 2013; 18(5):1441-1450.
Acre. Caracterização Socioambiental das Bacias
Hidro-gráficas do Estado do Acre. Rio Branco: Ministério
Pú-blico do Acre; 2009.
Oliveira AF, Leite IDC, Valente JG. Global burden of diarrheal disease attributable to the water supply and sanitation system in the State of Minas Gerais, Brazil: 2005. Cien Saude Colet 2015; 20(4):1027-1036. Valverde MC, Marengo JA. Extreme Rainfall Indices in the Hydrographic Basins of Brazil. Open Journal of
Mo-dern Hydrology 2014; 4(1):10-26.
Fonseca PAM, Veiga JP, Correia FS, Brito A, Queiroz M, Lyra A, Chan SC. Projecting Extreme Changes in Summer Rainfall in South America by the Middle of the 21st Century. Atmos Clim Sci 2014; 4:743-756. Guimberteau M, Ronchail J, Espinoza JC, Lengaigne M, Sultan B, Polcher J, Drapeau G, Guyot JL, Ducharne A, Ciais P. Future changes in precipitation and impacts on extreme streamflow over Amazonian sub-basins.
Envi-ron Res Lett 2013; 8(1):014035.
Artigo apresentado em 15/08/2015 Aprovado em 04/12/2015
Versão final apresentada em 14/12/2015 31.
32.
33.
34.
35.
36.
37.
38.