HESSD
11, 8013–8038, 2014Comparison of TRMM, MPEG and
CFSR rainfall estimation
A. W. Worqlul et al.
Title Page
Abstract Introduction
Conclusions References
Tables Figures
◭ ◮
◭ ◮
Back Close
Full Screen / Esc
Printer-friendly Version Interactive Discussion
Discussion
P
a
per
|
Discus
sion
P
a
per
|
Discussion
P
a
per
|
Discussion
P
a
per
|
Hydrol. Earth Syst. Sci. Discuss., 11, 8013–8038, 2014 www.hydrol-earth-syst-sci-discuss.net/11/8013/2014/ doi:10.5194/hessd-11-8013-2014
© Author(s) 2014. CC Attribution 3.0 License.
This discussion paper is/has been under review for the journal Hydrology and Earth System Sciences (HESS). Please refer to the corresponding final paper in HESS if available.
Comparison of TRMM, MPEG and CFSR
rainfall estimation with the ground
observed data for the Lake Tana Basin,
Ethiopia
A. W. Worqlul1,4,5, B. Maathuis2, A. A. Adem3, S. S. Demissie6, S. Langan4, and T. S. Steenhuis1,5
1
Cornell University, Ithaca, New York, USA
2
University of Twente, Faculty ITC, Twente, the Netherlands
3
Amhara Design and Supervision Works Enterprise, Bahir Dar, Ethiopia
4
International Water Management Institute, Addis Ababa, Ethiopia
5
Bahir Dar University, School of Civil and Water Resource Engineering, Bahir Dar, Ethiopia
6
DRS Development & Research Solutions, Addis Ababa, Ethiopia
Received: 25 June 2014 – Accepted: 30 June 2014 – Published: 14 July 2014
Correspondence to: A. W. Worqlul ([email protected])
HESSD
11, 8013–8038, 2014Comparison of TRMM, MPEG and
CFSR rainfall estimation
A. W. Worqlul et al.
Title Page
Abstract Introduction
Conclusions References
Tables Figures
◭ ◮
◭ ◮
Back Close
Full Screen / Esc
Printer-friendly Version Interactive Discussion
Discussion
P
a
per
|
Discus
sion
P
a
per
|
Discussion
P
a
per
|
Discussion
P
a
per
|
Abstract
Planning of drought relief and floods in developing countries is greatly hampered by lack of a sufficiently dense network of weather station measuring precipitation. In this paper we test the utility of three satellite products to augment the ground based precip-itation measurement to provide improved spatial estimates of rainfall. The three
prod-5
ucts are: Tropical Rainfall Measuring Mission (TRMM) product (3B42), Multi-Sensor Precipitation Estimate-Geostationary (MPEG) and Climate Forecast System Reanaly-sis (CFSR). The accuracy of three products is tested in the Lake Tana Basin in Ethiopia where in 2010 38 weather stations were available with a full record of daily precipita-tion amounts. Daily grid satellite based rainfall estimates were compared to: (1) point
10
observed ground rainfall (2) areal rainfall in the major river sub-basins of Lake Tana. The result shows that, the MPEG and CFSR satellite provided most accurate rainfall estimates. On the average for 38 stations 78 and 86 % of the observed rainfall varia-tion is explained by MPEG and CFSR data respectively while TRIMM explained only 17 % of the variation. Similarly, the areal comparison indicated a better performance
15
for both MPEG and CFSR data in capturing the pattern and amount of rainfall. MPEG and CFSR have also a lower RMSE compared to the TRMM satellite rainfall. The Bias indicated that, the MPEG is consistent in underestimating the observed rainfall while the TRMM and CFSR were not consistent; they overestimated for some and underes-timated for the others.
20
1 Introduction
Precipitation is a major component of the water cycle, and is responsible for depositing approximately 505 000 km3(or on the average 990 mm) of the fresh water on the planet. It is one of the major water balance component of the global water balance. Although the spatial and temporal variability of precipitation is important, unless large numbers of
25
HESSD
11, 8013–8038, 2014Comparison of TRMM, MPEG and
CFSR rainfall estimation
A. W. Worqlul et al.
Title Page
Abstract Introduction
Conclusions References
Tables Figures
◭ ◮
◭ ◮
Back Close
Full Screen / Esc
Printer-friendly Version Interactive Discussion
Discussion
P
a
per
|
Discus
sion
P
a
per
|
Discussion
P
a
per
|
Discussion
P
a
per
|
Though, ground rainfall observation station networks are often unevenly and sparsely distributed in the developing countries and this situation is not likely to improve in the near future. In Rahad, Dindir and Welaka Sub-basins in the Blue Nile Basins in Ethiopia there are only three stations for each sub-basin an area of greater than 5000 km2. This is far below the World Meteorological Organization (WMO) standard of one station for
5
100 to 250 km2 of area for mountainous region (WMO, 1994). The poor coverage of rain gage hinders drought forecasting for food deficits, and is of great hindrance of accurately predicting discharge (both low flows and floods), sediment discharge and nutrient fluxes. Unavailability of good rainfall estimates might also be the reason that as noted by Baveye (2013) that hydrologists, seem reluctant to deal with pressing and
10
unprecedented societal questions such as food deficits related to water resources. The growing availability of high-resolution (and near real time) satellite rainfall prod-ucts can help hydrologists to obtain more accurate precipitation data particularly in developing countries and remote locations where weather radars are absent and con-ventional rain gauges are sparse (Bitew et al., 2012). Satellite derived rainfall estimates
15
have become a powerful tool to supplement the ground based rainfall estimates. Re-cently, the availability of earth observation data for environmental or societal purposes is increasingly available through earth observation (EO) data provision services. Some of the freely available spatially distributed rainfall estimates are Tropical Rainfall Mea-suring Mission (TRMM) (Simpson et al., 1988), EUMETSAT’s Meteorological Product
20
Extraction Facility (MPEF) Multi-Sensor Precipitation Estimate-Geostationary (MPEG), Climate Forecast System Reanalysis (CFSR), the NOAA/Climate Prediction Centre morphing technique (CMORPH), Precipitation Estimation from Remotely Sensed Infor-mation using Artificial Neural Network (PERSIANN), the Naval Research Laboratory’s blended product (NRLB), and more.
25
HESSD
11, 8013–8038, 2014Comparison of TRMM, MPEG and
CFSR rainfall estimation
A. W. Worqlul et al.
Title Page
Abstract Introduction
Conclusions References
Tables Figures
◭ ◮
◭ ◮
Back Close
Full Screen / Esc
Printer-friendly Version Interactive Discussion
Discussion
P
a
per
|
Discus
sion
P
a
per
|
Discussion
P
a
per
|
Discussion
P
a
per
|
relatively cold clouds are associated with thick and high clouds that tend to produce high rainfall rates (Haile et al., 2010). One of the limitation with TIR sensor is, it only uses the top cloud temperature from which the depth of the cloud is inferred (Dinku et al., 2010) and also underestimates warm rain and misidentifies cirrus clouds as rain-ing (Dinku et al., 2011). Microwave sensors are more direct way of retrievrain-ing
precipita-5
tion from satellite; they gather information about the rain rather than the cloud (Dinku et al., 2010). The absorption of microwave radiation by liquid water and its scattering by ice particles can be related to rainfall over ocean and over land (Ferraro, 1997). The disadvantage of PM sensors is that, they are not available on geostationary satellites, which make them to have a longer re-visit time (Heinemann et al., 2002). A combination
10
of both, microwave (MW) data from polar orbiting satellites and IR data from geosta-tionary systems is an obvious approach to overcome some of the shortcomings in the estimation of precipitation. In this study, a validation of satellite rainfall estimation using a combination of MW and IR data TRMM, MPEG and CFSR will be done by comparing with the ground observation rainfall data for the Lake Tana Basin, Ethiopia.
15
Validation of satellite rainfall products in the Ethiopian highlands will give an insight into how the different products perform over such regions. A number of TRMM rainfall product validation have been done for the Ethiopian highlands (Dinku et al., 2010; Tsidu, 2012) are among others, all of them are focused on comparison of gridded satellite rainfall estimation to a ground rainfall observation data. This study validates
20
satellite rainfall products in two ways: comparing satellite gridded rainfall data to point observation data and satellite areal rainfall to areal observation for the major sub-basins of Lake Tana, and in addition to TRMM, CFSR and MPEG are also validated using ground rainfall stations in and around the Lake Tana Basin. Lake Tana Basin is selected to take the advantage of a relatively higher rainfall observation station density and
25
HESSD
11, 8013–8038, 2014Comparison of TRMM, MPEG and
CFSR rainfall estimation
A. W. Worqlul et al.
Title Page
Abstract Introduction
Conclusions References
Tables Figures
◭ ◮
◭ ◮
Back Close
Full Screen / Esc
Printer-friendly Version Interactive Discussion
Discussion
P
a
per
|
Discus
sion
P
a
per
|
Discussion
P
a
per
|
Discussion
P
a
per
|
have established a GEONETCast ground receiving station (Wale et al., 2011), that makes MPEG satellite rainfall product locally available. In addition, all of three rainfall estimates (TRMM, CFSR and MPEG) have a relatively high spatial resolution, global coverage and high temporal resolution.
Consequently, the general objective of the study is to examine which of the three
5
freely available satellite products give the best estimates of spatial distribution of rain-fall in mountainous terrain of Ethiopia. The three products are the EUMETSAT’s MPEF Multi-Sensor Precipitation Estimate-Geostationary (MPEG), Tropical Rainfall Measur-ing Mission’s (TRMM) and Climate Forecast System Reanalysis (CFSR) rainfall esti-mation. The satellite estimates are compared with relatively dense network of ground
10
rainfall observation stations distributed across the Lake Tana Basin for year 2010 for which we were able to obtain the most dense distribution of daily precipitation data.
1.1 Description of study area
The study is carried out in the Lake Tana Basin source of Blue Nile River in the north-west highlands of Ethiopia, with a total catchment area of 15 000 km2. The lake covers
15
around 3060 km2 at an altitude of 1786 m. The lake is located at 12◦00′N, 37◦15′E
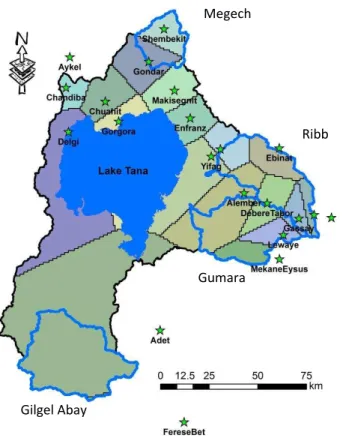
around 564 km from the capital Addis Ababa (Wale, 2008). The basin has a complex topography with a significant elevation variations ranging from 1786 to 4107 m a.m.s.l. The long-term annual average rainfall from 1994 to 2008 ranges from 2500 mm south of Lake Tana to 830 mm West of Lake Tana. Figure 1 shows the spatial distribution of
20
rain gauge stations network in and around Lake Tana Basin.
1.2 Data availability
The data required for this study, gauge observed rainfall data is collected from the Ethiopian National Meteorological Agency (ENMA). Long-term average annual rainfall from 1994 to 2008, daily rainfall data for the year 2010 and station location and
eleva-25
HESSD
11, 8013–8038, 2014Comparison of TRMM, MPEG and
CFSR rainfall estimation
A. W. Worqlul et al.
Title Page
Abstract Introduction
Conclusions References
Tables Figures
◭ ◮
◭ ◮
Back Close
Full Screen / Esc
Printer-friendly Version Interactive Discussion
Discussion
P
a
per
|
Discus
sion
P
a
per
|
Discussion
P
a
per
|
Discussion
P
a
per
|
stations did not record the rainfall consistently on a daily basis or for other stations the location and the elevation were not known. Thirty eight stations remained that have continuous daily rainfall data for the selected study period (2010). The satellite rainfall estimates used for this study includes: MPEG from MPEF, TRMM product (3B42) Ver-sion 7 and CFSR. Part of the MPEG data, at 15 min temporal interval is acquired in
5
near real time from the low-cost satellite image reception station established at Bahir Dar University, Institute of Technology (Wale et al., 2011). The daily aggregated MPEG data from 00:00 till 23:45 UTC, in mm day−1, is available online at: ftp://ftp.itc.nl/pub/
mpe/msg/. TRMM gridded rainfall estimates are collected from the ftp site, available at: ftp://disc2.nascom.nasa.gov/data/s4pa/TRMM_L3/TRMM_3B42_daily/. The daily
grid-10
ded CFSR rainfall data can be collected from http://rda.ucar.edu/datasets/ds094.1/.
2 Methods
The predicted satellite rainfall estimate and observed gauged rainfall data have different spatial and temporal scales. The ground observation consists of a 38 daily observations of point rainfall amounts irregularly distributed across the Lake Tana Basin (Fig. 1). The
15
MPEG, TRMM and CFSR rainfall consists of spatially distributed time series regular gridded data with a spatial resolution of 3 km, 0.25◦(
≈27 km at the equator) and 38 km
respectively. A detailed description of TRMM, MPEG and CFSR data is provided in the Appendix A. The average annual rainfall from 1994 to 2008 is plotted against the station elevation to see the stations likely affected by convective precipitation and those very
20
much affected by a combination of orographic and convective precipitation. Backwards elimination technique was used to obtain the linear trends with elevation in the long term average rainfall. The backward elimination technique successively eliminates the weakest independent station (variable) after which the regression will be recalculated (Xu and Zhang, 2001). If removing the variable significantly weakens the linear model
25
HESSD
11, 8013–8038, 2014Comparison of TRMM, MPEG and
CFSR rainfall estimation
A. W. Worqlul et al.
Title Page
Abstract Introduction
Conclusions References
Tables Figures
◭ ◮
◭ ◮
Back Close
Full Screen / Esc
Printer-friendly Version Interactive Discussion
Discussion
P
a
per
|
Discus
sion
P
a
per
|
Discussion
P
a
per
|
Discussion
P
a
per
|
The gridded satellite rainfall estimation is linked to the ground rainfall observations in two ways:
– Point to grid comparison: the grids of satellite rainfall estimation (MPEG, TRMM and CFSR) are compared to the ground rainfall observation data within the satel-lite grid box. This means, a point ground observation data is compared against
5
a satellite grid data of size of 3 by 3 km, 0.25 by 0.25◦and 38 by 38 km for MPEG,
TRMM and CFSR respectively. It is done by extracting the satellite rainfall esti-mation for the ground rainfall station locations. Finally the comparison on monthly and annual basis is done applying standard statistics.
– Areal comparison: satellite rainfall estimation is compared with the interpolated
10
observed rainfall stations. The ground rainfall observations are interpolated adopt-ing a Thiessen Polygon method and compared with the respective satellite rainfall estimation for the major gauged river basins of Lake Tana; the accuracy is mea-sured using standard statistics. The major river basins in the Lake Tana used for this study are Gilgel Abay, Gumara, Ribb and Megech, according to Kebede
15
et al. (2006) these rivers contribute approximately 93 % of the surface water in-flow.
2.1 Ground Rainfall Observation Station (GROS)
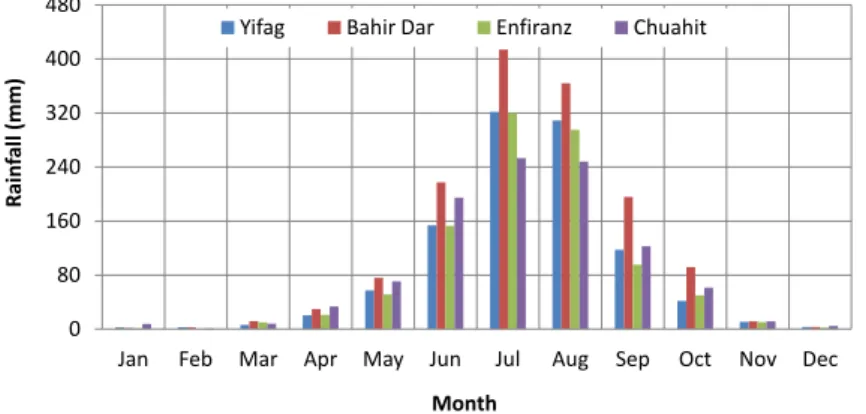
There are 51 meteorological stations operated by ENMA in the study area. Some of them have no location information and/or the actual elevation provided is not
consid-20
ered reliable. For the 38 selected stations daily rainfall is available in 2010 study period. Monthly rainfall amounts for selected stations are given in Fig. 2. Long-term annual av-erage rainfall varies between 830 mm to 2500 mm year−1from 1994 to 2008.
HESSD
11, 8013–8038, 2014Comparison of TRMM, MPEG and
CFSR rainfall estimation
A. W. Worqlul et al.
Title Page
Abstract Introduction
Conclusions References
Tables Figures
◭ ◮
◭ ◮
Back Close
Full Screen / Esc
Printer-friendly Version Interactive Discussion
Discussion
P
a
per
|
Discus
sion
P
a
per
|
Discussion
P
a
per
|
Discussion
P
a
per
|
2.2 Statistical measures
Three statistical measures were used to compare the satellite rainfall estimates with the ground rainfall observations consisting of the Coefficient of Determination (R-Squared),
Multiplicative Bias (Bias) and Root Mean Square Error (RMSE).
The Coefficient of Determination (R-Squared): is used to evaluate the goodness
5
of fit of the relation. R-Square address the question on how well the satellite rainfall
estimates correspond to the ground rainfall observations, it is the degree of linear as-sociation between the two terms see Eq. (1).
R2=
nP
(GiSi)−(PG
i) (
PS
i)
r
nPG2 i
−(PGi)
2 nPS2 i
−(PSi) 2
2
(1)
where: R2=coefficient of determination, Gi =ground rainfall measurements,
10
Si =satellite rainfall estimates, andn=number of data pairs.
Root Mean Square Error (RMSE) measures the difference between the distributions of the ground observed rainfall and the distribution of satellite rainfall estimation and calculates a weighted average error, weighted according to the square of the error. RMSE is useful when large errors are undesirable. The lower the RMSE score, the
15
closer the satellite rainfall estimation represents the observed ground rainfall measure-ment see Eq. (2).
RMSE=
s P
(Gi−Si)2
n (2)
where: RMSE=root mean square error, Gi=ground rainfall measurements, Si =satellite rainfall estimates, andn=number of data pairs.
HESSD
11, 8013–8038, 2014Comparison of TRMM, MPEG and
CFSR rainfall estimation
A. W. Worqlul et al.
Title Page
Abstract Introduction
Conclusions References
Tables Figures
◭ ◮
◭ ◮
Back Close
Full Screen / Esc
Printer-friendly Version Interactive Discussion
Discussion
P
a
per
|
Discus
sion
P
a
per
|
Discussion
P
a
per
|
Discussion
P
a
per
|
Bias (Dinku et al., 2008) is a measure of how does the average satellite rainfall magnitude compared to the ground rainfall observation. It is simply the ratio of the mean satellite rainfall estimation value to the mean of ground rainfall observed value. A bias of 1.1 means the satellite rainfall is 10 % higher than the average ground rainfall observations see Eq. (3).
5
Bias=
PS i
PG
i
(3)
where:Gi =ground rainfall measurements andSi =satellite rainfall estimates.
3 Result and discussion
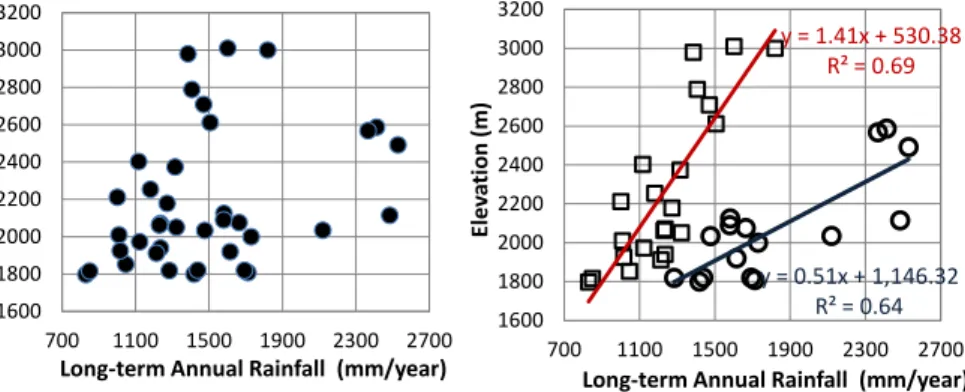
The long-term annual average rainfall from 1994 to 2008 is plotted against station ele-vation to see the rainfall–eleele-vation relation (Fig. 3). Two clear trends can be observed;
10
the first one shows a 50 mm of rainfall increase for every 100 m elevation increase and the second trend observed was a 125 mm rainfall increase for every 100 m elevation increase. These two relations can be explained by stations likely affected by convective rainfall only (rectangles) and those very much affected by a combination of orographic and convective precipitation (in circles) in Fig. 3.
15
3.1 Point to grid comparison
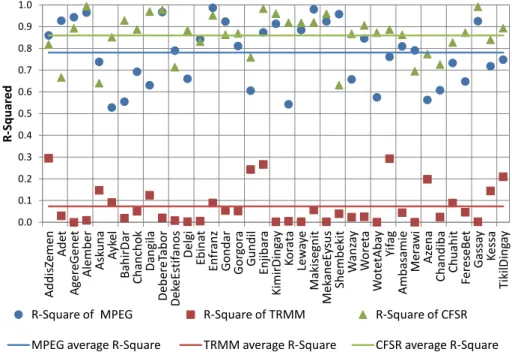
The satellite rainfall estimates are aggregated to monthly temporal intervals and the monthly satellite rainfall estimation was extracted for the 38 stations locations. The observed ground rainfall and the extracted satellite rainfall for all 38 stations is depicted for the three standard statistical techniques in Fig. 4a–c.
20
HESSD
11, 8013–8038, 2014Comparison of TRMM, MPEG and
CFSR rainfall estimation
A. W. Worqlul et al.
Title Page
Abstract Introduction
Conclusions References
Tables Figures
◭ ◮
◭ ◮
Back Close
Full Screen / Esc
Printer-friendly Version Interactive Discussion
Discussion
P
a
per
|
Discus
sion
P
a
per
|
Discussion
P
a
per
|
Discussion
P
a
per
|
(Yismala Station). On average 78 % of the total observed rainfall variation is explained by the MPEG satellite rainfall estimate. The CFSR has a coefficient of determination ranging from 0.63 to 0.99 for Gassay and Shembekit respectively, on average 86 % of the total observed rainfall variation is explained by CFSR rainfall data for the 38 stations. The correlation between TRMM and GROS on monthly basis is weak, with
5
a maximum coefficient of determination of 0.29 (Addis Zemen Station) and a minimum value of 0.00. Multiple stations did not show a correlation with TRMM data. On average only 7 % of the total observed rainfall variation is explained by the TRMM satellite rain-fall estimates. The root mean square error in Fig. 4b gives very much the same trends as in Fig. 4a. The MPEG and CFSR have a much better RMSE (ranging from 0.63 to
10
9.5 mm day−1) while TRMM has a RMSE ranging from 3.8 to 11.8 mm day−1.
Thus MPEG and CFSR rainfall estimate are clearly better related to gauged rainfall than TRMM. This is in agreement with the findings of Dinku et al. (2008), where on average TRMM-3B42 captures only 15 % of the rainfall variability for the whole Ethiopia. Finally if we look at the rainfall distribution throughout the year we found that the
15
rainfall estimates of MPEG and CFSR agree with the ground based observation of 84 to 86 % of the annual rainfall occurs in the rainy monsoon phase from June to September as exemplified in Fig. 5, for Addis Zemen and Agre Genet Stations. In contrast TRMM finds that only 30 % rainfall is during the rainy season.
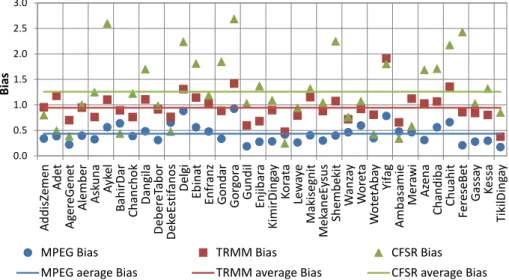
The Bias calculated (Fig. 4c) for MPEG, TRMM and CFSR ranging from 0.2 to 0.9,
20
0.5 to 1.9 and 0.24 to 2.69 with an average value of 0.43, 1.0 and 1.3 respectively. The MPEG is consistent in under-predicting the observed rainfall, on average it underesti-mates by 57 % . The TRMM overestiunderesti-mates for 15 stations and it underestiunderesti-mates for the remaining. The CFSR also overestimates for 24 stations and it has the largest standard deviation of Bias indicating the spread of the Bias between stations. The MPEG seems
25
consistent in underestimating the ground observed rainfall while the TRMM and CFSR are not consistently in estimating the observed rainfall.
HESSD
11, 8013–8038, 2014Comparison of TRMM, MPEG and
CFSR rainfall estimation
A. W. Worqlul et al.
Title Page
Abstract Introduction
Conclusions References
Tables Figures
◭ ◮
◭ ◮
Back Close
Full Screen / Esc
Printer-friendly Version Interactive Discussion
Discussion
P
a
per
|
Discus
sion
P
a
per
|
Discussion
P
a
per
|
Discussion
P
a
per
|
likely affected by a combination of orographic and convective precipitation (16 station, marked in circle in Fig. 3). The Bias also indicated that, stations likely affected by both convective and orographic rainfall have a higher bias than the likely stations affected by convective rain only. This is quite reasonable, because due to the result of orographic lifting of the moist air, leading to precipitation while the cloud top is still relatively warm.
5
Satellite rainfall products may not detect the rainfall from the warm clouds as the cloud-tops would be too warm for TIR thresholds (Dinku et al., 2008), and there will not be much ice aloft to be determined by PM senses. But, both sensors can detect the rainfall from the deep convection (Tsidu, 2012).
3.2 Areal comparison 10
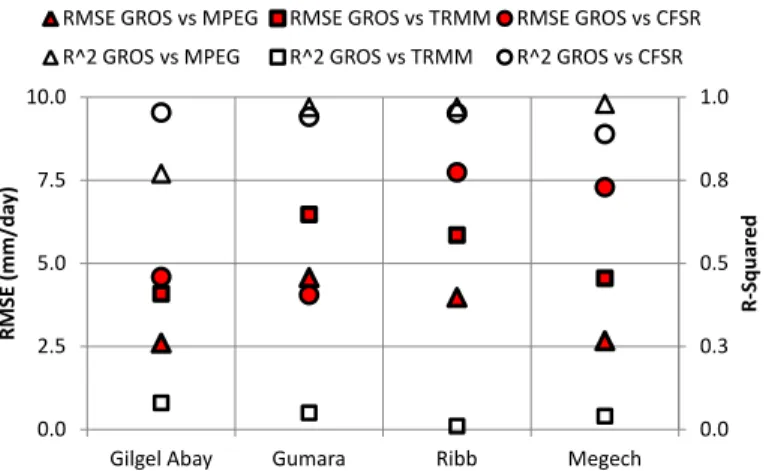
Stations likely affected by convective rainfall are interpolated using a Thiessen Polygon method and there weights on areal rainfall for the major watersheds is determined (Fig. 6). Gilgel Abay watershed has two stations likely affected by convective rainfall; Megech has three, Gumara six and Ribb seven stations. The areal observed rainfall is compared with the areal satellite rainfall estimation for the major gauged rivers basins
15
in the Lake Tana. Figure 9, shows the correlation and RMSE of areal Ground Rainfall Observation Station (GROS) vs. MPEG, areal GROS vs. TRMM and areal GROS vs. CFSR for the major river basins of Lake Tana.
The areal MPEG and CFSR satellite rainfall estimation have a very high coefficient of determination above 0.8, on average both MPEG and CFSR captured 93 % of the areal
20
observed rainfall variability on the major river sub-basins of lake Tana (Fig. 7). Overall, the areal satellite rainfall estimates for the major river basins have a smaller RMSE and a higherR-Squared compared to the result of point to grid comparison. This is because
the stations used for areal observed rainfall estimations are the likely station affected by convective rainfall only and the satellite observation data is an average value over
25
HESSD
11, 8013–8038, 2014Comparison of TRMM, MPEG and
CFSR rainfall estimation
A. W. Worqlul et al.
Title Page
Abstract Introduction
Conclusions References
Tables Figures
◭ ◮
◭ ◮
Back Close
Full Screen / Esc
Printer-friendly Version Interactive Discussion
Discussion
P
a
per
|
Discus
sion
P
a
per
|
Discussion
P
a
per
|
Discussion
P
a
per
|
Megech and Gumara (on average by 5 %). The areal RMSE of MPEG is smaller than areal CFSR estimation. The areal TRMM rainfall indicated a very smallR-Squared and
a very high RMSE. The Bias for TRMM rainfall estimation is not constant; it overesti-mates for Gilgel Abay and Gumara by 40 and 10 % respectively and underestioveresti-mates for Ribb and Megech watersheds by 10 %. Thus, the consistence Bias with an excellent
5
correlation for MPEG rainfall estimate, there is a necessity to use scaling factors for the rainfall Bias correction.
4 Conclusion
This study evaluated EUMETSAT’s MPEF Multi-Sensor Precipitation Estimate-Geostationary (MPEG), Tropical Rainfall Measuring Mission (TRMM) Multi-satellite
10
Precipitation Analysis TRMM 3B42 data version 7 and Climate Forecast System Re-analysis (CFSR) rainfall estimation, using data of 38 ground rainfall observation sta-tions in and around the Lake Tana Basin for 2010. The comparison was done using two approaches: point to grid and areal comparison for the major river sub-basins. Areal observed rainfall is estimated by interpolating the stations likely affected by
con-15
vective rainfall, interpolation is done by Thiessen Polygon method with a grid size of 0.25◦, 3 km and 38 km for the major river basins in the Lake Tana Basin. The
perfor-mance of MPEG and CFSR satellite rainfall estimation both for point to grid and areal comparison was far better than the TRMM satellite rainfall estimation. The MPEG satel-lite rainfall is consistent in underestimating the ground observed rainfall by an average
20
of 60 % for both point to grid and areal rainfall comparison and it has captured the rainfall pattern. CFSR satellite rainfall also captured the observed rainfall pattern but it has showed some inconsistency, it overestimates for some and underestimates for the other stations. TRMM rainfall was not consistent in estimating the ground rainfall observation for both point to grid as well as areal comparison and did not capture the
25
HESSD
11, 8013–8038, 2014Comparison of TRMM, MPEG and
CFSR rainfall estimation
A. W. Worqlul et al.
Title Page
Abstract Introduction
Conclusions References
Tables Figures
◭ ◮
◭ ◮
Back Close
Full Screen / Esc
Printer-friendly Version Interactive Discussion
Discussion
P
a
per
|
Discus
sion
P
a
per
|
Discussion
P
a
per
|
Discussion
P
a
per
|
The ground observation data indicated 86 % of the annual rainfall to occur from June to September and the MPEG and CFSR indicated approximately the same percentage. The TRMM indicated only 30 % of the annual rainfall to occur during the rainy season June to September. Based on the study period for the study area, MPEG has performed better in capturing the spatial and temporal pattern of observed rainfall. The result
5
suggested that there should be further calibration for the TRMM 3B42 rainfall product for the Lake Tana area before the data is used for any kind of study.
Appendix A:
A1 Multi-Sensor Precipitation Estimate-Geostationary (MPEG)
MPEG is one of the products from MPEF as part of the Meteosat Second Generation
10
(MSG) Ground Segment. The MPEF primary function is to generate meteorological products from the Level 1.5 image data supplied like those from the SEVIRI instru-ment onboard of the MSG series of geostationary satellites by the Image Processing Facility (IMPF) (EUMETSAT, 2008). Multi-sensor Precipitation Estimate (MPE) is an in-stantaneous rain rate product which is derived from the Infrared data (IR-data) of the
15
geo-stationary EUMETSAT satellites by continuous re-calibration of the algorithm with rain-rate data derived from polar orbiting microwave sensors.
The algorithm is based on a combination of MSG images from the Infrared IR10.8 micro m channel and passive microwave data from the Special Sensor Microwave Im-ager (SSM/I) instrument on the United States Defence Meteorological Satellite
Pro-20
gram (DMSP) polar satellites. The role model for the MPE algorithm was the algorithm developed by Turk et al. (1999). The product is most suitable for convective precip-itation, and is intended mainly for areas with poor radar coverage (Heinemann and Kerényi, 2003). The MPEG data is available through the GEONETCast near real time, global network of satellite-based data dissemination systems designed to distribute
25
HESSD
11, 8013–8038, 2014Comparison of TRMM, MPEG and
CFSR rainfall estimation
A. W. Worqlul et al.
Title Page
Abstract Introduction
Conclusions References
Tables Figures
◭ ◮
◭ ◮
Back Close
Full Screen / Esc
Printer-friendly Version Interactive Discussion
Discussion
P
a
per
|
Discus
sion
P
a
per
|
Discussion
P
a
per
|
Discussion
P
a
per
|
established at the compound of Bahir Dar University, Engineering Faculty (Wale et al., 2011) in collaboration with Tana Sub-basin Organization (TaSBO) and with the Univer-sity of Twente, Faculty ITC, the Netherlands. The MPEG data is available at a temporal resolution of 15 min with a spatial resolution of 3 km for the whole field of view of MSG. The 15 min MPEG data is aggregated to daily, monthly and annual rainfall for the study
5
area for 2010, using a daily aggregation time between 00:00 and 23:45 UTC.
A2 Tropical Rainfall Measuring Mission (TRMM)
TRMM, Tropical Rainfall Measuring Mission, was launched by the H-II rocket from Tanegashima Space Centre of The National Space Development Agency of Japan (NASDA), on 28 November 1997. This satellite has been developed as a joint project
10
between Japan and US, which is the first space mission dedicated to measure rainfall (NASDA, 2001).
TRMM works by combining both TIR and MW sensors (Dinku et al., 2011). The MW channel carefully measures the minute amounts of microwave energy emitted and scattered by the Earth and its atmospheric constituents. TRMM also operates in
ac-15
tive radar. TRMM satellite orbits the earth at a 35◦ inclination angle with respect to
the equator. TRMM covers an area of the earth’s surface that extends well beyond the tropics, covering a swath between 38◦N to 38◦S. TRMM makes these data available
in both near-real time and delayed research-quality formats. The TRMM rainfall prod-uct has a spatial resolution of 0.25◦ and a temporal resolution of 3 h. For this study 20
the TRMM product 3B42 version 7 is used. The TRMM-3B42 estimates are produced in four steps (Dinku et al., 2010): (i) the PM estimates are adjusted and combined, (ii) TIR precipitation estimates are created using the PM estimates for calibration, (iii) PM and TIR estimates are combined, and (iv) the data is rescaled to monthly totals where by gauge observations are used indirectly to adjust the satellite product (Dinku
25
HESSD
11, 8013–8038, 2014Comparison of TRMM, MPEG and
CFSR rainfall estimation
A. W. Worqlul et al.
Title Page
Abstract Introduction
Conclusions References
Tables Figures
◭ ◮
◭ ◮
Back Close
Full Screen / Esc
Printer-friendly Version Interactive Discussion
Discussion
P
a
per
|
Discus
sion
P
a
per
|
Discussion
P
a
per
|
Discussion
P
a
per
|
Microwave Sounding Radiometer-Earth Observing System (AMSR-E) (Ouma et al., 2012). In February 2014 the successor is like launched, the GPM mission with ad-vanced radar and passive microwave sensors and will provide continuous precipitation estimates for the next years to come.
A3 Climate Forecast System Reanalysis (CFSR) 5
The CFSR was designed and executed as a global, high-resolution coupled atmosphere–ocean–land surface–sea ice system to provide the best estimate of the state of these coupled domains for the study period (Saha et al., 2010). New features in the CFSR according to Wang et al. (2011) include: (1) it is the first reanalysis system in which the guess fields are taken as the 6 h forecast from a coupled atmosphere–
10
ocean climate system with an interactive sea ice component; and (2) it assimilates satellite radiances rather than the retrieved temperature and humidity values. In addi-tion, the CFSR is forced with observed estimates of evolving greenhouse gas (GHG) concentrations, aerosols, and solar variations (Wang et al., 2011). The CFSR global at-mosphere data has a spatial resolution of approximately 38 km and the data is available
15
from 1979.
Acknowledgements. We are very grateful to the National Meteorological Agency of Ethiopia for providing daily rainfall data for multiple stations free of charge. The data providers of Trop-ical Rainfall Measuring Mission (TRMM) product (3B42), Multi-Sensor Precipitation Estimate-Geostationary (MPEG) and Climate Forecast System Reanalysis (CFSR) are also
acknowl-20
HESSD
11, 8013–8038, 2014Comparison of TRMM, MPEG and
CFSR rainfall estimation
A. W. Worqlul et al.
Title Page
Abstract Introduction
Conclusions References
Tables Figures
◭ ◮
◭ ◮
Back Close
Full Screen / Esc
Printer-friendly Version Interactive Discussion
Discussion
P
a
per
|
Discus
sion
P
a
per
|
Discussion
P
a
per
|
Discussion
P
a
per
|
References
Baveye, P. C.: Hydrology and the looming water crisis: it is time to think, and act, outside the box, J. Hydrol. Hydromech., 61, 89–96, 2013.
Bitew, M. M., Gebremichael, M., Ghebremichael, L. T., and Bayissa, Y. A.: Evaluation of high-resolution satellite rainfall products through streamflow simulation in a hydrological modeling
5
of a small mountainous watershed in Ethiopia, J. Hydrometeorol., 13, 338–350, 2012. Dinku, T., Chidzambwa, S., Ceccato, P., Connor, S., and Ropelewski, C.: Validation of
high-resolution satellite rainfall products over complex terrain, Int. J. Remote Sens., 29, 4097– 4110, 2008.
Dinku, T., Connor, S. J., and Ceccato, P.: Comparison of CMORPH and TRMM-3B42 over
10
mountainous regions of Africa and South America, in: Satellite Rainfall Applications for Sur-face Hydrology, Springer Netherlands, 193–204, 2010.
Dinku, T., Ceccato, P., and Connor, S. J.: Challenges of satellite rainfall estimation over moun-tainous and arid parts of east Africa, Int. J. Remote Sens., 32, 5965–5979, 2011.
EUMETSAT: MSG Meteorological Products Extraction Facility Algorithm Specification
Docu-15
ment, Darmstadt, Germany, 2008.
Ferraro, R. R.: Special sensor microwave imager derived global rainfall estimates for climato-logical applications, J. Geophys. Res.-Atmos., 102, 16715–16735, 1997.
Haile, A. T., Rientjes, T., Gieske, A., and Gebremichael, M.: Multispectral remote sensing for rainfall detection and estimation at the source of the Blue Nile River, Int. J. Appl. Earth Obs.,
20
12, S76–S82, 2010.
Heinemann, T. and Kerényi, J.: The EUMETSAT Multi Sensor Precipitation Estimate (MPE): Concept and Validation, EUMETSAT Users Conf., Weimar, Germany, 2003.
Heinemann, T., Latanzio, A., and Roveda, F.: The EUMETSAT Multi-Sensor Precipitation Estimate (MPE), Second International Precipitation Working group (IPWG) Meeting, 23–
25
27 September 2002, Madrid, Spain, 2002.
Kebede, S., Travi, Y., Alemayehu, T., and Marc, V.: Water balance of Lake Tana and its sensitivity to fluctuations in rainfall, Blue Nile basin, Ethiopia, J. Hydrol., 316, 233–247, 2006.
NASDA: TRMM Data Users Handbook, National Space Development Agency of Japan, Japan, 2001.
30
HESSD
11, 8013–8038, 2014Comparison of TRMM, MPEG and
CFSR rainfall estimation
A. W. Worqlul et al.
Title Page
Abstract Introduction
Conclusions References
Tables Figures
◭ ◮
◭ ◮
Back Close
Full Screen / Esc
Printer-friendly Version Interactive Discussion
Discussion
P
a
per
|
Discus
sion
P
a
per
|
Discussion
P
a
per
|
Discussion
P
a
per
|
Ouma, Y. O., Owiti, T., Kipkorir, E., Kibiiy, J., and Tateishi, R.: Multitemporal comparative analy-sis of TRMM-3B42 satellite-estimated rainfall with surface gauge data at basin scales: daily, decadal and monthly evaluations, Int. J. Remote Sens., 33, 7662–7684, 2012.
Saha, S., Moorthi, S., Pan, H.-L., Wu, X., Wang, J., Nadiga, S., Tripp, P., Kistler, R., Woollen, J., and Behringer, D.: The NCEP climate forecast system reanalysis, B. Am. Meteorol. Soc., 91,
5
1015–1057, 2010.
Sharma, S., Isik, S., Srivastava, P., and Kalin, L.: Deriving spatially distributed precipitation data using the artificial neural network and multilinear regression models, J. Hydrol. Eng., 18, 194–205, 2012.
Simpson, J., Adler, R. F., and North, G. R.: A proposed tropical rainfall measuring mission
10
(TRMM) satellite, B. Am. Meteorol. Soc., 69, 278–295, 1988.
Tsidu, G. M.: High-resolution monthly rainfall database for Ethiopia: homogenization, recon-struction, and gridding, J. Climate, 25, 8422–8443, 2012.
Turk, F. J., Rohaly, G. D., Hawkins, J., Smith, E. A., Marzano, F. S., Mugnai, A., and Leviz-zani, V.: Meteorological applications of precipitation estimation from combined SSM/I, TRMM
15
and infrared geostationary satellite data, Microwave Radiometry and Remote Sensing of the Earth’s Surface and Atmosphere, VSP BV, the Netherlands, 353–363, 1999.
Wale, A.: Hydrological balance of Lake Tana, M.Sc Thesis, International Institute for Geo-Information Science and Earth Observation (ITC), the Netherlands, 2008.
WWale, A., Kaba, E., Mengeste, A., Workaferahu, A., Mulken, M., and Aemro, B.: Opportunities
20
of the low-cost satellite image reception station established at GIS & RS Center of Bahir Dar University, Institute of Technology, 2nd Symposium on Biodiversity and Natural Conservation at Arba Minch University, 3–5 June 2010, Arba Minch, Ethiopia, 2011.
Wang, W., Xie, P., Yoo, S.-H., Xue, Y., Kumar, A., and Wu, X.: An assessment of the surface cli-mate in the NCEP clicli-mate forecast system reanalysis, Clim. Dynam., 37, 1601–1620, 2011.
25
HESSD
11, 8013–8038, 2014Comparison of TRMM, MPEG and
CFSR rainfall estimation
A. W. Worqlul et al.
Title Page
Abstract Introduction
Conclusions References
Tables Figures
◭ ◮
◭ ◮
Back Close
Full Screen / Esc
Printer-friendly Version Interactive Discussion
Discussion
P
a
per
|
Discus
sion
P
a
per
|
Discussion
P
a
per
|
Discussion
P
a
per
|
Jan
eb
ar
r
y
n
l
g
Sep
ag
ar
z
Chu
Figure 1.Lake Tana watershed and spatial distribution of ground rainfall observation stations (Google Earth map as background).
HESSD
11, 8013–8038, 2014Comparison of TRMM, MPEG and
CFSR rainfall estimation
A. W. Worqlul et al.
Title Page
Abstract Introduction
Conclusions References
Tables Figures
◭ ◮
◭ ◮
Back Close
Full Screen / Esc
Printer-friendly Version Interactive Discussion
Discussion
P
a
per
|
Discus
sion
P
a
per
|
Discussion
P
a
per
|
Discussion
P
a
per
|
0 80 160 240 320 400 480
Jan Feb Mar Apr May Jun Jul Aug Sep Oct Nov Dec
R
a
in
fa
ll
(m
m
)
Month
Yifag Bahir Dar Enfiranz Chuahit
HESSD
11, 8013–8038, 2014Comparison of TRMM, MPEG and
CFSR rainfall estimation
A. W. Worqlul et al.
Title Page
Abstract Introduction
Conclusions References
Tables Figures
◭ ◮
◭ ◮
Back Close
Full Screen / Esc
Printer-friendly Version Interactive Discussion
Discussion
P
a
per
|
Discus
sion
P
a
per
|
Discussion
P
a
per
|
Discussion
P
a
per
|
1600 1800 2000 2200 2400 2600 2800 3000 3200
700 1100 1500 1900 2300 2700
El
e
v
a
ti
on
(m
)
Long-term Annual Rainfall (mm/year)
y = 1.41x + 530.38 R² = 0.69
y = 0.51x + 1,146.32 R² = 0.64 1600
1800 2000 2200 2400 2600 2800 3000 3200
700 1100 1500 1900 2300 2700
El
e
v
a
ti
on
(m
)
Long-term Annual Rainfall (mm/year)
en t t er a el ar ok lagi r os elgi t z ar a il a y a e it s it y a y ag e i a a it t y
essa
y
Figure 3.Elevation verses long-term annual average rainfall relations in the Lake Tana Basin (38 stations from 1984 to 2008).
HESSD
11, 8013–8038, 2014Comparison of TRMM, MPEG and
CFSR rainfall estimation
A. W. Worqlul et al.
Title Page Abstract Introduction Conclusions References Tables Figures ◭ ◮ ◭ ◮ Back Close
Full Screen / Esc
Printer-friendly Version Interactive Discussion Discussion P a per | Discus sion P a per | Discussion P a per | Discussion P a per | 0.0 0.1 0.2 0.3 0.4 0.5 0.6 0.7 0.8 0.9 1.0 Ad d isZ em en Ad e t Ag er eGe n e t Al em b er Ask u n a A yk el B ah irD ar C h an ch ok D an gi la D eb er eT ab o r D ek eEs ti fan os D el gi Eb in a t En fr an z Gon d ar Gor g o ra Gu n d il En ji b ar a Ki mi rD in g a y K o ra ta Lew a y e M ak isegn it M ek an eE y su s Sh em b ek it W an za y W o re ta W o te tAb a y Y if ag Amb asami e M er a w i Az en a Cha n d ib a Chu ah it F er ese B e t Gassa y K essa T ik il D in g a y R -Squ a re d
R-Square of MPEG R-Square of TRMM R-Square of CFSR
MPEG average R-Square TRMM average R-Square CFSR average R-Square
Figure 4a.R-Squared of MPEG, TRMM and CFSR vs. 38 Ground Rainfall Observation Stations
(GROS) in the Lake Tana Basin. The lines represent the averageR-Square of MPEG, TRMM
HESSD
11, 8013–8038, 2014Comparison of TRMM, MPEG and
CFSR rainfall estimation
A. W. Worqlul et al.
Title Page Abstract Introduction Conclusions References Tables Figures ◭ ◮ ◭ ◮ Back Close
Full Screen / Esc
Printer-friendly Version Interactive Discussion Discussion P a per | Discus sion P a per | Discussion P a per | Discussion P a per | 0.0 2.0 4.0 6.0 8.0 10.0 12.0 Ad d isZ em en Ad e t Ag er eGe n e t Al em b er Ask u n a A yk el B ah irD ar Cha n ch o k D an gi la D eb er eT ab o r D ek eE st if an o s D el gi Eb in a t En fr an z Gon d ar Gor g o ra Gu n d il En ji b ar a Ki mi rD in g a y K or a ta Lew a y e M ak isegn it M ek an eE y su s Sh em b ek it W an za y W o re ta W o te tAb a y Y if ag Amb asami e M er a w i Az en a Cha n d ib a Chu ah it F er ese B e t Gassa y K essa T ik il D in g a y R M SE (m m /da y )
RMSE of MPEG RMSE of TRMM RMSE of CFSR
MPEG average RMSE TRMM average RMSE CFSR average RMSE
Figure 4b. RMSE of MPEG, TRMM and CFSR compared with the 38 Ground Rainfall
HESSD
11, 8013–8038, 2014Comparison of TRMM, MPEG and
CFSR rainfall estimation
A. W. Worqlul et al.
Title Page Abstract Introduction Conclusions References Tables Figures ◭ ◮ ◭ ◮ Back Close
Full Screen / Esc
Printer-friendly Version Interactive Discussion Discussion P a per | Discus sion P a per | Discussion P a per | Discussion P a per | 0.0 0.5 1.0 1.5 2.0 2.5 3.0 Ad d isZ em en Ad e t Ag er eGen e t Al em b er Ask u n a A yk el B ah irD ar Cha n ch o k D an gi la D eb er eT ab o r D ek eE st if an o s D el gi Eb in a t En fr an z Gon d ar Gor g o ra Gu n d il En ji b ar a Ki mi rD in g a y K o ra ta Lew a y e M ak isegn it M ek an eE y su s Sh emb ek it W an za y W o re ta W o te tAb a y Y if ag Amb asami e M er a w i Az en a Cha n d ib a Chu ah it F er ese B e t Gassa y K essa T ik il D in g a y Bi a s
MPEG Bias TRMM Bias CFSR Bias
MPEG aerage Bias TRMM average Bias CFSR average Bias
HESSD
11, 8013–8038, 2014Comparison of TRMM, MPEG and
CFSR rainfall estimation
A. W. Worqlul et al.
Title Page
Abstract Introduction
Conclusions References
Tables Figures
◭ ◮
◭ ◮
Back Close
Full Screen / Esc
Printer-friendly Version Interactive Discussion
Discussion
P
a
per
|
Discus
sion
P
a
per
|
Discussion
P
a
per
|
Discussion
P
a
per
|
(A) Gorgara station (B) Agre Genet station 0
150 300 450 600
Jan Mar May Jul Sep Nov
R
a
in
fa
ll
(m
m
/m
on
th
)
GROS MPEG TRMM CFSR
0 150 300 450 600 750 900
Jan Mar May Jul Sep Nov
R
a
in
fa
ll
(m
m
/m
on
th
)
GROS MPEG TRMM CFSR
en t t er a el ar k
gi
la r s
el
gi t z ar a il a y a e it s it y a y ag e i a a it t y
essa
y
Figure 5. Temporal distribution of gauged rainfall and satellite rainfall estimation from Trop-ical Rainfall Measuring Mission’s (TRMM), Multi-Sensor Precipitation Estimate-Geostationary (MPEG) and Climate Forecast System Reanalysis (CFSR) for Gorgara and Agre Genet stations (year 2010).
HESSD
11, 8013–8038, 2014Comparison of TRMM, MPEG and
CFSR rainfall estimation
A. W. Worqlul et al.
Title Page
Abstract Introduction
Conclusions References
Tables Figures
◭ ◮
◭ ◮
Back Close
Full Screen / Esc
Printer-friendly Version Interactive Discussion
Discussion
P
a
per
|
Discus
sion
P
a
per
|
Discussion
P
a
per
|
Discussion
P
a
per
|
Megech
Ribb
Gumara
Gilgel Abay
HESSD
11, 8013–8038, 2014Comparison of TRMM, MPEG and
CFSR rainfall estimation
A. W. Worqlul et al.
Title Page
Abstract Introduction
Conclusions References
Tables Figures
◭ ◮
◭ ◮
Back Close
Full Screen / Esc
Printer-friendly Version Interactive Discussion
Discussion
P
a
per
|
Discus
sion
P
a
per
|
Discussion
P
a
per
|
Discussion
P
a
per
|
0.0 0.3 0.5 0.8 1.0
0.0 2.5 5.0 7.5 10.0
Gilgel Abay Gumara Ribb Megech
R
-Squ
a
re
d
R
M
SE
(m
m
/da
y
)
RMSE GROS vs MPEG RMSE GROS vs TRMM RMSE GROS vs CFSR
R^2 GROS vs MPEG R^2 GROS vs TRMM R^2 GROS vs CFSR
Figure 7.R-Squared and RMSE of areal ground observed rainfall vs. satellite rainfall estimate