*e-mail: [email protected]
Corrosion of Reinforcing Bars Embedded in Alkali-activated Slag Concrete
Subjected to Chloride Attack
William Aperador Chaparroa*, Jorge Hernando Bautista Ruizb,
Robinson De Jesús Torres Gómezc
aDepartment of Mechatronics Engineering, Universidad Militar Nueva Granada,
Bogotá D.C., Colombia
bBasic Science Faculty, Universidad Francisco de Paula Santander, A.A 12215,
San José de Cúcuta, Colombia
cDepartment of Metallurgical Engineering, Universidad Pedagógica y Tecnológica de Colombia,
Autopista Norte, Tunja, Colombia
Received: May 23, 2011; Revised: November 9, 2011
Steel bar embedded in an alkali-activated slag (AAS) concrete was tested under complete immersion, in 3.5% NaCl solution by weight of the slag. Ordinary Portland cement (OPC) was also tested for comparative purposes and exposed to the same solution. Monitoring of open-circuit potential, polarization resistance measurement and electrochemical impedance spectroscopy (EIS) were used to evaluate the corrosion behavior of steel bar. The corrosion resistances of AAS and OPC concretes were performed at 0, 3, 6, 9 and 12 months. Electrochemical measurements shows that AAS concrete presents passive corrosion behavior the first 3 months, after this period of time, it presents corrosion resistance decreased due to the chlorides presence at the steel/AAS interface. For 0 months immersion (28 days of curing) the AAS and OPC concretes presented a 10% of corrosion probability. After 3 months of immersion the tested AAS and OPC concretes showed similar behavior, the active potentials in the range from −0.2 to −0.6 V vs. Cu/CuSO4, indicate a 90% probability of corrosion.
Keywords: corrosion, alkali-activated cement, chloride ion, electrochemical measurements
1. Introduction
The nature and integrity of solid layer hydration products formed in close proximity to the embedded steel can be an important role in metal controlling passivation and depassivation.
In spite of the advantages of reinforced concrete, corrosion of the steel bar remains its most common durability problem1. The most important cause of corrosion initiation of steel bar is the ingress of chloride ions to the steel surface2-4. Corrosion of steel bar damages the reinforced concrete structures in two ways: First, it reduces the cross-sectional area of steel bar. Second, it produces corrosion products with a larger volume than the steel itself. The volume increase induces the tensile stress in concrete, which results in cracking and eventual structural failure5,6.
Granulated blast-furnace slag (GBFS) has been used for many years as a supplementary cementitious material in ordinary Portland cement (OPC) concrete, either as a mineral admixture or as a component of blended cement. Doubts have been raised about the use of GBFS in pre-stressed and post-tensioned concrete. GBFSs contain sulphides that can catalyze the development of hydrogen atoms when pre-stressed steel embedded in concrete corrodes, thus leading to hydrogen embrittlement. Nevertheless, tests and practical experience over 50 years have shown that such concern is not justified and GBFS cement can be freely used7,8.
In an attempt to overcome these problems, the construction sector is very interested in the development of new cement binder materials as an alternative to OPC9,10. In this respect, the most promising emerging approach is based on raw materials suitable for alkaline activation, which originate new binding materials generically known as alkaline cements11,12. The use of slag as supplementary cementitious material improves the durability of concrete as it reduces the chloride penetration achieved by GBFS has been confirmed by many different investigators13,14.
The aim of this paper is to study the corrosion properties of steel rebars embedded in alkaline active slag and exposed 3.5% NaCl solution by weight of the slag. For comparative purposes, steel rebars were embedded in OPC in identical experimental conditions. The specimens were studied using corrosion potential, linear polarization resistance, and electrochemical impedance spectroscopy methods.
2. Experimental
GBFS from the company “Acerías Paz del Rio”, located at Boyacá, Colombia, was used with a chemical composition (% by weight) of 33.7 SiO2, 12.8 Al2O3, 3.09 Fe2O3, 45.4 CaO, 0.5 TiO2, 0.64 SO3, 1.79 MgO and 2.08 loss ignition, a specific surface area of 398 m2.kg−1 and a specific gravity of 2860 kg.m−3. The basicity (CaO + MgO / SiO
+ Al2O3) and quality (CaO + MgO + Al2O3 / SiO2 + TiO2) indexes were 1.01 and 1.73, respectively. According to ASTM C 989-99 Standard this material was grade 80 slag15. The waterglass used as the activating solution consisted of a commercial sodium silicate mix (31.7% SiO2, 12.3% Na2O and 56.0% water) with a 50% NaOH solution to obtain a SiO2/Na2O ratio of 2.4. The Na2O concentration in the waterglass activating solution added to the concrete was 5% by weight of slag. The aggregate used was a siliceous gravel with a maximum grain size of 19 mm, specific gravity of 2940 kg.m−3, and 1.3% absorption, and river sand with a maximum grain size of 19 mm, a specific gravity of 2470 kg.m3, and 2.9% absorption. OPC according to ASTM C 150-02 Standard was used for comparative purposes16-18, with a specific gravity and specific surface area of 2990 and 400 kg.m−3, respectively. AAS and OPC concretes were prepared with a water/cement ratio of 0.4.
The AAS and OPC specimens were cured in a climatic chamber for 28 days at 90% relative humidity (RH) for AAS specimens and at 100% RH for OPC specimens to prevent leaching of the activating solutions and to assure that the hydration reaction and product formation processes were not affected.
Structural 1018 steel bars of 6.35 mm diameter were used, according to ASTM A 706-08 Standard17. A cylindrical reinforced concrete specimen (76.2 mm diameter and 76.2 mm length) was used to perform the experimental tests.
Electrochemical measurements were carried out by immersing the specimens completely in 3.5% NaCl solution by weight of the slag with a classic 3-electrode configuration, using the steel bars as working electrode, a graphite bar as counter electrode, and a copper/copper sulphate (Cu/CuSO4) reference electrode. An active surface area of 10 cm2 was marked on the working electrode with an epoxy resin, thus isolating the triple concrete/steel/ atmosphere interface to avoid a possible localized corrosion attack due to differential aeration. Finally, for analyzed corrosion surface process, the superficial morphology was characterized by using a High-Resolution Scanning Electron Microscope (SEM) (Philips® XL 30 FEG).
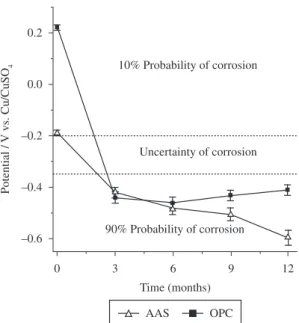
Steel bar corrosion over time was monitored by using three techniques: (i) Corrosion potential (Ecorr) values. The Ecorr parameter may be used to define the probability for OPC/carbon steel system: for Ecorr < −0.35 V vs. Cu/CuSO4 high corrosion probability (∼90%), for −0.35 V < Ecorr < −0.20 V vs. Cu/CuSO4 uncertainty of corrosion, and for Ecorr > −0.20 V vs. Cu/CuSO4 a 10% probability of corrosion16; (ii) Linear polarization resistance (Rp) values.
∆ =
∆
p E R
I
(1)
The steel corrosion rate can be calculated from the Stern-Geary Equation19:
=
corr p B i
R
(2)
applying ∆E ± 20 mV at a scan rate of 0.16 mV/s, A tentative value of 52 or 26 mV for the B constant for steel in the passive or active (corroding) state, respectively. The corrosion level
for OPC/carbon steel system may be defined according to the Durar Network Specification16: for i
corr < 0.1 µA.cm −2
passivity, for 0.1 µA.cm−2 < i
corr < 0.5 µA.cm
−2 low corrosion,
for 0.5 µA.cm−2 < i
corr < 1.0 µA.cm
−2 high corrosion,
and for icorr > 1.0 µA.cm−2 very high corrosion; and (iii) Electrochemical impedance spectroscopy (EIS). EIS measurements were recorded at the Ecorr in a frequency range from 1 × 10⁵ to 1 × 10⁻³ Hz with a logarithmic sweeping frequency of 3 points per decade. The EIS method involved the imposition of a 10 mV amplitude excitation voltage. A Gamry model PCI 4 workstation was utilized for DC and AC measurements. Electrochemical measurements were performed at 0, 3, 6, 9 and 12 months for AAS and OPC specimens.
3. Results and Discussion
Figure 1 shows the evolution of the rebar corrosion potential (Ecorr) measured on AAS and OPC concrete exposed to 3.5% NaCl solution by weight of the slag, during 12 months immersion. For 0 months immersion (28 days of curing) the AAS and OPC concretes presented a 10% probability of corrosion, corresponding to a state of passivity based on the Pourbaix diagram. After 3 months of immersion the tested AAS and OPC concretes showed similar behavior, the active potentials in the range from −0.2 to –0.6 V vs. Cu/CuSO4, indicate presented a 10% of corrosion probability. Ecorr evolutions of OPC concrete were constant after 6 months, AAS specimen present the most negative corrosion potential values after 6 months.
Figure 2 shows Rp and icorr values vs. time for steel rebar embedded in AAS and OPC concrete. The AAS and OPC specimens showed the highest Rp values for 0 months immersion. The Rp values decrease showed the lowest Rp values after 3 months; with Rp values in the range from
Figure 1. Corrosion potential (Ecorr) vs. time for steel rebars
Figure 2. Polarization resistance (Rp) and current density (icorr) vs. time for steel rebars embedded in AAS and OPC concretes immersed
in a 3.5% NaCl solution by weight of the slag.
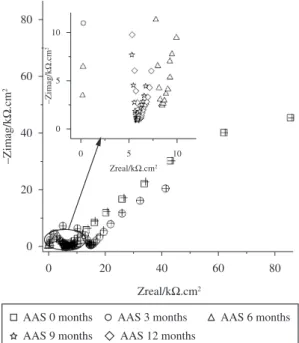
Figure 3. Nyquist plots for steel rebars embedded in AAS concrete
exposed to 3.5% NaCl solution by weight of the slag.
Figure 4. Electrical equivalent circuit used to fit impedance data of steel embedded in AAS and OPC concretes. RΩ is the electrolyte/ concrete interface resistance; CPE1 and CPE2 are constant phase elements defined at high and low frequency, respectively; R1 is the
pore solution resistance; and R2 is the charge transfer resistance
(corrosion).
87 to 5 kΩ.cm2 for AAS and 33 to 13 kΩ.cm2 (Figure 2a). Figure 2b presents corrosion current density (icorr) values, estimated from the Rp measurements using the Stern-Geary equation19, vs. time for steel rebar embedded in the two concretes. The AAS and OPC concrete after 0 months, present similar icorr showed lower corrosion current densities of 0.2 and 0.3 µA.cm−2, respectively (Figure 2b). According to the classification proposed by Durar Network Specification,
this value means generally low corrosion16. The behavior of AAS specimen varied in time, icorr presents an increased trend during the first 3 months, after this period of time the rebar corrosion current density increased values assumed as the threshold between low corrosion and very high corrosion for 12 months. The OPC concrete showed the highest icorr, with a value of 0.8 µA.cm−2 (high corrosion) after 3 months and 2 µA.cm−2 (very high corrosion) after 12 months.
Figure 3 shows typical Nyquist plots for steel rebar embedded in AAS concrete exposed to 3.5% NaCl solution by weight of the slag. Measurements were performed at 0 (28 days of curing), 3, 6, 9 and 12 months. Table 1 includes fitting data yielded using the equivalent circuit of Figure 4. In general, a capacitive behavior was obtained, characterized by a poorly defined and depressed semicircle at high frequencies and a second semicircle associated to the steel corrosion process at low frequencies.
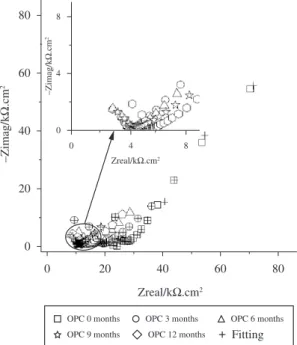
the equivalent circuit of Figure 4. In general, as for OPC concrete, a capacitive behavior was observed, characterized by a poorly defined semicircle at high frequencies and a second semicircle at low frequencies.
Equivalent circuit of Figure 4 contains two distributed constant phase elements (CPE1 and CPE2) to consider the two relaxation time constants (Figures 3 and 5). The CPE1−R1 couple, which predominates at high frequencies, may be originated by the passive film and/or the dielectric properties of the concrete, while the CPE2−R2 couple, controlled at low frequencies, characterizes the corrosion process of the steel/ concrete pore solution interface. RΩ is the electrolyte resistance.
Distributed CPEs are widely used in data fitting to allow for depressed semicircles. The depressed semicircle is generally due to a dispersion in the time constant, caused by irregularities on the steel surface, surface roughness, fractal surface, and in general certain processes associated with an irregular distribution of the applied potential (10 mV) to obtain EIS data. The admittance representation of a CPE (YCPE) shows a fractional-power dependent on the angular frequency (ω):
YCPE = YP(j ω)α (3)
where YP is a real adjustable constant used in the non-linear least squares (NLLS) fitting, and –1 < α < 1 defined as a CPE power.
Table 1 includes optimized fitting impedance parameter values for the AAS/steel and OPC/steel system. The high frequency process had a CPE1 (YP1) for AAS in the range from 0.12 × 10⁻⁸ to 2.71 × 10⁻⁸Fcm s−2 − −α(1 1), for OPC in
the range from 0.1 × 10⁻⁹ to 2.76 × 10⁻⁹Fcm s−2 − −α(1 1). The optimized values for the various parameters are given in Table 1. At lower frequencies a capacitive behavior was observed indicating a situation of passivity for AAS and OPC after 0 months, these value capacitive increments indicating the active condition of the rebar after 3 months of exposure OPC concrete and 6 months for AAS specimens. Although the R2 (corrosion resistance) values for the AAS/steel and OPC/steel system decreased with time, showed a low corrosion resistance after 3 months, see R2 values in Table 1.
The impedance data could be interpreted in the following way. During the first 3 months of testing, the steel appears to show certain inertia to starting the corrosion process due to the passivation of the steel. The fitting process gives a R2 value from 86 to 7 kΩ.cm2 for AAS concrete (Table 1). The effect of chloride content in AAS concrete show that R2 decreases when the time of exposition increases. Accepting that the Stern-Geary equation can be applied, with an approximate B constant value of 26 mV, the resulting corrosion current density is low (icorr = 0.3 µA.cm−2),
Table 1. Parameters used in the fitting of impedance data for steel rebars embedded in alkali-activated slag (AAS) and OPC concretes
immersed in a 3.5 wt. (%) NaCl solution.
Time (months)
RΩ (Ω.cm2)
YP1
(Fcm–2s–(1 – α1))
α1 R1
(kΩ.cm2)
YP2
(Fcm–2s–(1 – α1))
α2 R2
(kΩ.cm2)
AAS concrete
0 602.0 0.12 × 10⁻⁸ 0.59 13.4 1.83 × 10⁻³ 0.52 85.13
3 68.0 0.45 × 10⁻⁸ 0.75 3.67 104 × 10−3 0.85 12.6
6 53.2 0.64 × 10⁻⁸
0.87 2.45 171 × 10−3
0.93 11.3
9 40.6 0.93 × 10⁻⁸
0.93 1.72 221 × 10−3
0.86 7.19
12 27.3 2.71 × 10⁻⁸
0.86 0.57 234 × 10−3
0.72 6.75
OPC concrete
0 645.3 0.010 × 10⁻⁸
0.81 15.9 2.74 × 10⁻³
0.86 58.0
3 36.7 0.140 × 10⁻⁸
0.87 1.13 11.9 × 10⁻³
0.75 14.4
6 42.7 0.199 × 10⁻⁸
0.79 0.80 15.8 × 10⁻³
0.78 11.4
9 34.1 0.24 × 10⁻⁸
0.84 0.73 17.6 × 10⁻³
0.83 10.3
12 29.1 0.276 × 10⁻⁸ 0.92 0.59 25.7 × 10⁻³ 0.92 7.4
which is not far from the icorr results obtained using the Rp measurements (Figure 2b).
For the OPC/steel system the EIS results show a similar picture, with a depressed semicircle at high frequencies and a second semicircle also depressed at low frequencies, yielding an R2 value from 58 to 7 kΩ.cm2 (Table 1). The estimated corrosion current density was low, of the order of 0.4 µA.cm−2. These results agree well with the DC data, see Figure 2b.
A way to determine the kind of corrosion of the materials consist in analyze the morphology of the products generated in the process (oxides and hydroxides). This analysis complements the information obtained by means of field or laboratory electrochemical techniques.
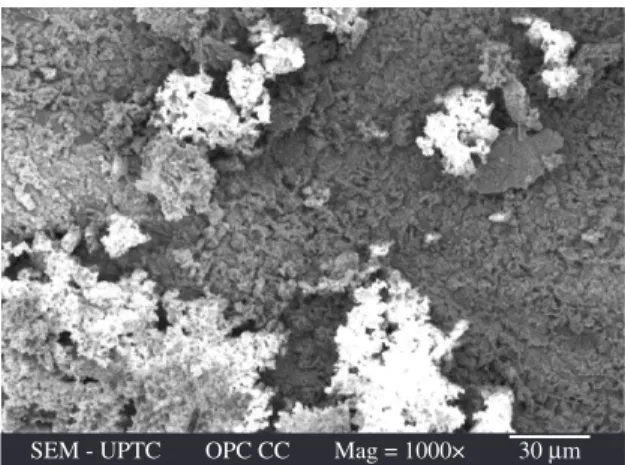
The embedded steel in OPC concrete, in aggressive conditions presented a homogenous distribution of the corrosion products (Figure 6). However when observing bigger increases, it can be noticeable how this cape of oxides do not appear in the totality metal surface. This agrees with the electrochemical data obtained, because although stable values of polarization resistance regarding time are showed, they were not high enough due to the formation of oxide capes not much uniforms.
In aggressive environments, where the chloride was exposed to steel to the chloride ions, it is impossible to evidence the formation of protective films above the same (Figure 7). A uniform protective oxides cape on metal was not generated and the distribution was not homogenous. On the contrary small groups take shape and appear like elements with a darker tonality. Besides it can become evident than ions chloride they break the oxide cape producing a porous surface that does not protect the steel. This is the reason why the polarization resistance in these materials present low values.
The conditions of passivity found in AAS concrete in conditions without treatment are explained by means of SEM observations. It was observed a homogeneous film on metal (Figure 8). This included a group of outstands oxides at some places like small shapely groups on the surface.
Nevertheless, when this film with good protective properties is attacked by the chloride ions loses great part of its characteristics. The steel of the AAS concrete does not lose the passive film completely (Figure 9). Next of
Figure 8. Surface of the steel embedded in AAS concrete, without
treatment.
Figure 9. Surface of the steel embedded in AAS concrete exposed
to 3.5% NaCl solution by weight of the slag.
Figure 6. Surface of the steel embedded in OPC concrete, without
treatment.
the exposition in aggressive environments exist still small oxide crowds on the surface of steel. The inconvenience that these corrosion products consists in that its structure is dense but suffer of cracking that they allow the pass of other contaminants.
Figure 7. Surface of the steel embedded in OPC concrete exposed
4. Conclusions
The open circuit potential values of the AAS concrete samples immersed in a saline solution for 3 months allows predicting the starting time of the corrosive process in the AAS reinforced concrete structures.
The electrochemical impedance spectroscopy is a powerful technique for analyzing the behavior of the electrical characteristics of AAS concrete generated by the migration of chloride ions. The chloride ions in the concrete decrease the polarization resistance values. At low frequencies, the capacitance value increases due to the concrete-steel interface. These results correlate with the reported values of Rp.
For 0 months immersion (28 days of curing) the AAS and OPC concretes presented a 10% probability of corrosion. After 3 months of immersion the tested AAS and OPC concretes showed similar behavior, the active potentials in the range from −0.2 to −0.6 V vs. Cu/CuSO4, indicate a 90% probability of corrosion
Acknowledgements
W. Aperador expresses his gratitude to the Centre of Excellence in Novel Materials (CENM) and COLCIENCIAS of Colombia, Project Geoconcret, for the scholarship granted to him.
References
1. Chung L, Jay JH and Yi ST. Bond strength prediction for reinforced concrete members with highly corroded reinforcing bars. Cement and Concrete Composites. 2008; 30(7):603-611. http://dx.doi.org/10.1016/j.cemconcomp.2008.03.006 2. Meira GR, Andrade C, Padaratz IJ, Alonso C and Borba Junior
JC. Chloride penetration into concrete structures in the marine atmosphere zone - relationship between deposition of chlorides on the wet candle and chlorides accumulated into concrete.
Cement and Concrete Composites. 2007; 29 (9):667-676. http://dx.doi.org/10.1016/j.cemconcomp.2007.05.009 3. Bastidas DM, Fernández-Jiménez A, Palomo A and González JA.
A study on the passive state stability of steel embedded in activated fly ash mortars. Corrosion Science. 2008;50(4):1058-1065. http://dx.doi.org/10.1016/j.corsci.2007.11.016
4. Arya C and Xu Y. Effect of cement type on chloride binding and corrosion of steel in concrete. Cement and Concrete Research. 1995; 25(4):893-902. http://dx.doi.org/10.1016/0008-8846(95)00080-V
5. Choi YS, Kim JG and Lee KM. Corrosion behavior of steel bar embedded in fly ash concrete. Corrosion Science. 2006; 48(7):1733-1745. http://dx.doi.org/10.1016/j.corsci.2005.05.019 6. Song HW and Saraswathy V. Studies on the corrosion resistance
of reinforced steel in concrete with ground granulated blast-furnace slag. An overview. Journal of Hazardous Materials. 2006;138 (2):226-233. http://dx.doi.org/10.1016/j. jhazmat.2006.07.022
7. Aperador W, Mejía de Gutiérrez R and Bastidas DM. Steel corrosion behaviour in carbonated alkali-activated slag concrete. Corrosion Science. 2009; 51(9):2027-2033. http://dx.doi.org/10.1016/j.corsci.2009.05.033
8. Torres R, Aperador W, Vera E, Ortiz C and Mejía de Gutierrez R. Estudio de la corrosion del acero embebido en Concreto aas sometido a cloruros. Dyna. 2010; 77(164):52-59
9. Fernández-Jimenez A and Puertas F. Effect of activator mix on the hydration and strenght behavior of alkali-activated slag cements. Advances in Cement Research. 2003;15(3):129-136. http://dx.doi.org/10.1680/adcr.2003.15.3.129
10. Fernández-Jiménez A, Miranda JM, González JA and Palomo A. Steel passive state stability in activated fly ash mortars.
Materiales de Construcción. 2010; 60(300):51-65
11. Elakneswaran Y, Nawa T and Kurumisawa K. Zeta potential study of paste blends with slag. Cem. Concr. Comp. 2009;31(1):72-76. http://dx.doi.org/10.1016/j.cemconcomp.2008.09.007 12. Ahmed MS, Kayali O and Anderson W. Chloride penetration
in binary and ternary blended cement concretes as measured by two different rapid methods. Cement and Concrete Composites. 2008; 30 (7):576-582. http://dx.doi.org/10.1016/j. cemconcomp.2008.02.005
13. Puertas F, Gil-Maroto A, Palacios M and Amat T. Alkali-activated slag mortars reinforced with a glass fibre. Performance and properties. Materiales de Construcción. 2006; 56 (283):79-90. 14. Roy DM, Jiang W and Silsbee MR. Chloride diffusion in
ordinary, blended, and alkali-activated cement pastes and its relation to other properties. Cement and Concrete Research.
2000; 30(12):1879-1884. http://dx.doi.org/10.1016/S0008-8846(00)00406-3
15. American Society for Testing and Materials - ASTM. ASTM C 989-99 Standard: Standard specification for ground granulated blast-furnace slag for use in concrete and mortars. West Conshohocken: American Society for Testing and Materials, 1999.
16. American Society for Testing and Materials - ASTM. ASTM C 150-02 Standard: Specification for Portland cement test. West Conshohocken: American Society for Testing and Materials, 2002. 17. American Society for Testing and Materials - ASTM. ASTM A 706-08 Standard: Standard specification for low-alloy steel deformed and plain bars for concrete reinforcement. West Conshohocken: American Society for Testing and Materials, 2008.
18. Durar Network. Manual de Inspección, Evaluación y Diagnóstico de Corrosión en Estructuras de Hormigón Armado. CYTED Programe, 1997.
19. Stern M and Geary AL. Electrochemical polarization I. A theoretical analysis of the shape of polarization curves.