ISSN 1517-7076 artigo 11719, pp.501-509, 2016
Corresponding Author: Melisa Cardona Received on: 24/08/2015 Accepted on: 03/02/2016
10.1590/S1517-707620160002.0047
Pores distribution statistical analysis
for metal foams obtained by
casting-dissolution process
Melisa Cardona 1, Jesica Andrea Isaza2 Juan Fernando Ramírez 2, Patricia Fernández-Morales3
1
Universidad Nacional de Colombia, sede Medellín, Facultad de Minas. Carrera 64C No. 63 – 120. Medellín, Colombia. e-mail: [email protected]
2
e-mail: [email protected], [email protected] 3
Universidad Pontificia Bolivariana, Facultad de Ingeniería Industrial. Circular 1ra. No. 70-01. Medellín, Colombia e-mail: [email protected]
ABSTRACT
Interesting properties of metal foams such as light weight, good energy absorption and low thermal conductivity, have promoted the development of new processes to improve properties without sacrificing productivity. This study aims to verify the uniformity pore distribution in an aluminum alloy foam obtained by Casting - Dissolution Process, using a nondestructive analysis. In order to evaluate mechanical properties of a metal foam using computational numerical models, the use of a small reconstructed section of the sample representing an entire volume of metal foam, was validated. In conclusion, it was possible to determine that all parts of the sample have the equivalent superficial area and volume.
Keywords: Metal foam, casting and dissolution process, porosity.
1. INTRODUCTION
Metal foams have several remarkable properties that make them suitable for many engineering uses. They are
frequently used in different fields such as lightweight sandwich manufacturing, packaging and
crashworthiness, because of their energy dissipation capability and their thermal and acoustical properties, which are still under study [1][2][3][4].
Different methods are proposed to get porous metals, starting from vapor phase on polymeric preforms, metal powder mixed with foaming agents, electrodeposited from an aqueous solution, injecting gas in the liquid metal or metal casting and infiltration on preforms [4][5]. It is known that the properties of metal foam and other cellular metal structures depend on the properties of the bulk metal as well as the homogeneity of the structural features such as: cell topology, relative density, cell size, cell shape and anisotropy, which in turn depend on the manufacturing method [6][7].
Several authors had shown limited number of methods to produce open cellular structures that allow obtaining uniform pore distribution. Zhao, et al. [8], developed the lost carbonate sintering process (LCS) for manufacturing metal foams with space holder technique and evaluated the cell structure using a visual analysis with SEM micrographs. They found the foam exhibits uniformly distributed open cells. Surace, et al.
[7] implemented the Sintering-Dissolution Process (SDP), another space holder technique that uses water-soluble materials that allow controlling the cell shape, cell size and porosity. They measured the morphological parameters in a 2D cross section by an image software tool from the obtained samples that were longitudinally sawed cut with diamond blade [7].
Both, the foam structure and the pore morphology, depend on the fabrication method. In general, the SDP technic produces homogeneous foams, but it has not been established if every obtained sample has uniformly distributed pores, in a way that it can be concluded that a small portion of the sample is representative for all the volume in the mechanical response as well as in its geometry.
502 2. MATERIALS AND METHODS
2.1 Metal foam samples processing
Casting-Dissolution Process was used to manufacture the aluminum foams. To make the preform, NaCl particles were sieved to obtain controlled sizes of 2.0 mm, 1.0 mm and 0.5 mm, then they were put into a cylindrical steel mold, and finally were infiltrated with the AlSiMg liquid aluminum alloy under vacuum pressure and at temperature of 700°C. Al/NaCl composites of 10 cm in diameter and 8 in height were obtained. In order to reveal the porous structure, the salt was removed by water. This manufacturing method allows the porous to be present in all direction and with irregular shape replicated from the NaCl particles; so there is an inherent complexity in the structure geometry, where the porous are uniform but with random distribution.
2.2 Visualization, segmentation and morphometry
Different methods of visualization, segmentation and morphometry to analyze the geometry of foams are available. Due to the cell structure damage could be caused using destructive test, it was decided to do a nondestructive technique that allows to acquire detailed, quantitative, geometric datas from the three samples. X-ray micro-computed tomography (μCT) was employed to obtain the required images.
The µCT system used for the tomography of each sample consisted of a micro-focus 150 kV Hamamatsu X-ray source with a tungsten target and a flat panel detector C7942. A 100 kV filament voltage and a current of 100 µA were used. Using a source-sample distance of 77.5 mm and a source-detector distance of 298 mm, it was achieved a magnification factor of 3,8 and a pixel size 13 mm. Additionally, the aluminum foams structure was examined by optical microscopy (Leica DMLM) and scanning electron microscope (JEOL JSM-6490LV SEM) to evaluate how the cells are interconnected.
Recent observations using X-ray μCT showed up the feasibility of the 3D reconstruction and basic measurements on X-ray tomography and prove that this technique is suitable for the investigation of the microstructure of foams, because it enables to obtain a real image of the inside [9],[10].
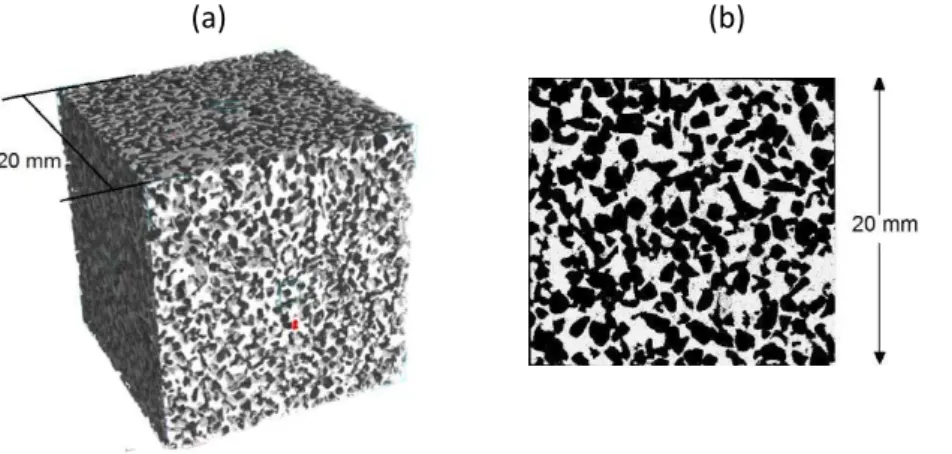
The X-ray μCT images were manipulated using specialized software, Mimics®, from which geometric information including strut length and pore shapes were extracted. Figure 1a. shows the 3D reconstruction from μCT and the Fig 1b. the SEM image for one of the samples.
(a)
(b)
Figure 1: Sample with 0.5 mm pore size: (a) 3D reconstruct using Mimics ® Materialise (b) Sample from SEM
2.3 Porous distribution analysis
As mentioned before, the major parameters to characterize the architecture of a cellular material are the
global density and its fluctuation in the sample, the cell size distribution and the wall thickness distribution.
In this sense, to determine if every obtained sample has uniformly distributed pores, a section of 99 μCT image from each sample was imported to a 3D reconstruction using image analysis software, Mimics ®.
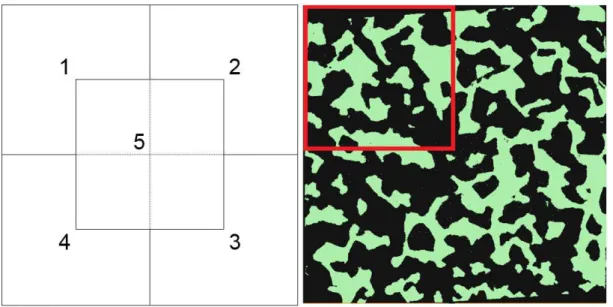
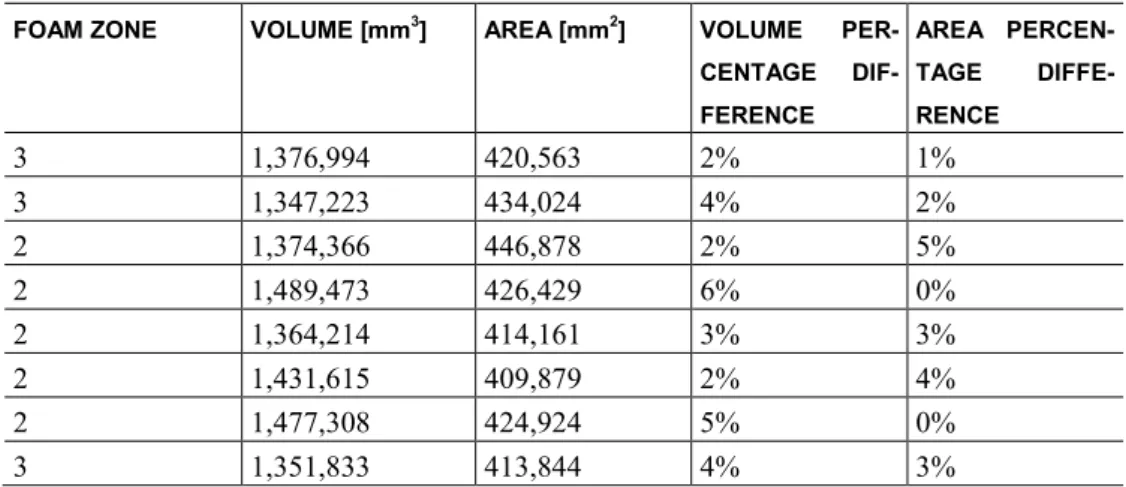
503 The total analyzed images represent a volume of 20mm x 20mm x 10mm, a half of the actual size of the sample. Since the prime purpose is to obtain a minimum meshed volume able to be representative of the foam, the µCT slices were sectioned looking for a rectangular region that at least has a completed and defined pore. Using crop tool, the sample with 0.5mm and 1.0 mm cell size were segmented into sixteen (16) parts, as shown in Figure 2, and four samples with 2.0mm cell size were segmented into five (5) parts carrying out the same purpose, as shown in Figure 3.
Once the 3D reconstruction of every box section was made, the surface area and volume were measured using Mimics measure tools and from each parameter an average was calculated.
An experiment was designed to compare the homogeneity of every box section for each cell size and was implemented using Minitab® software. The experimental factor was the foam zone and the experimental response variables for the Analysis of Variance (ANOVA) were surface area and volume. Experimental factor (foam zone) was divided in three levels: 1 (corners), 2 (boundaries), 3 (center), for 0.5mm and 1.0mm cell size as shown in Figure 2. The experiment has more than one replicate for each level. Further, foam zone of 2.0mm cell size was divided in five levels as in Figure 3. This segmentation ensures that there is at least one completed and defined pore in each part. Four 3D reconstruction of metal foam pore size 2.00 mm were carried out to ensure three replicates for each level.
Figure 2: Sample segmentation foam with 1mm cell size.
504 3. RESULTS
Taking into account the benefits of the non-destructive test to probe complex porous structures, this study goes beyond using 3D reconstruction in order to get every morphological three dimensional parameter. It allows to acquire detailed, quantitative, geometric data from the three samples.
As shown in Figure 4, the reconstructed samples show that foams exhibit well-interconnected open cells. The pores have extensive elongation with a uniform distribution without accumulation in few regions.
(a)
(b) (c)
Figure 4: Reconstructed sample with (a). 2.0mm cell size, (b). 1.0mm cell size and (c). 0.5mm cell size.
In addition, a visual inspection of the μCT shows that the obtained cell shape differs markedly from foams made by other methods starting from powders, as showed by B. H. Smith [4] in the micro-structure sample made by oxide ceramic foam precursor and made by powder metallurgy.
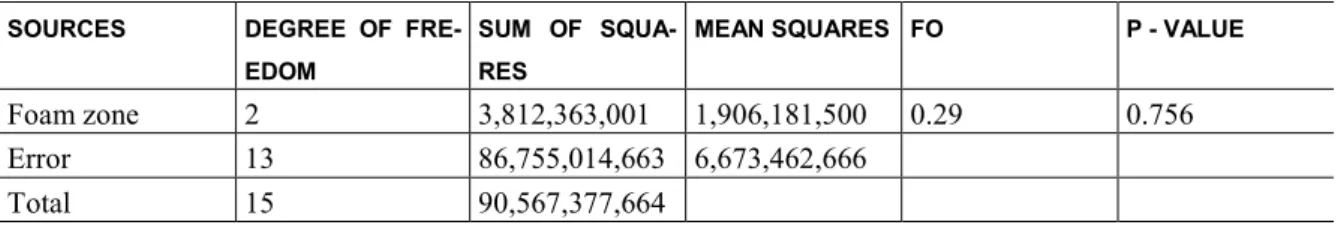
. Experiment design for 0.5mm cell size can be observed in Table 1. The experiment response variables were surface area and volume for each sample (0.5mm, 1.0 mm and 2.0mm cell size), percentage difference is the comparison between the foam zone section area and volume with the average from each sample. In addition, Table 2 and Table 3 shows examples of ANOVA for 0.5mm cell size, the first one has as response volume and the second one has surface area. From the analysis of variance (ANOVA) made with Minitab® it can be concluded that none of the factor levels are significant. The p-value reported is less than 0.05 for confidence percentage of 95%, this means that there is no statistical evidence that shows no homogeneity in the foam. Additionally, box and whisker graphs shown in Figure 5 are useful for comparing groups of data and prove that there is not effect of foam zone. The assumptions of normal distribution, equal variances, and randomization of the residuals were checked to guarantee the validity of the experiment conclusions, respective graphs are shown in the Figure 6 and Figure 7.
Table 1: Volume, superficial area and percentage difference of the 0.5 mm cell size sample.
FOAM ZONE VOLUME [mm3] AREA [mm2] VOLUME
PER-CENTAGE
DIF-FERENCE
AREA
PERCEN-TAGE
DIFFE-RENCE
3 1,376,994 420,563 2% 1%
3 1,347,223 434,024 4% 2%
2 1,374,366 446,878 2% 5%
2 1,489,473 426,429 6% 0%
2 1,364,214 414,161 3% 3%
2 1,431,615 409,879 2% 4%
2 1,477,308 424,924 5% 0%
505
2 1,524,831 424,946 9% 0%
1 1,415,271 447,563 1% 5%
1 1,416,070 436,134 1% 3%
1 1,222,860 409,974 13% 3%
3 1,473,876 436,016 5% 3%
2 1,337,973 406,492 5% 4%
1 1,482,484 436,419 6% 3%
2 1,333,099 408,249 5% 4%
Table 2: One-way ANOVA: Volume versus Foam zone.
SOURCES DEGREE OF
FRE-EDOM
SUM OF
SQUA-RES
MEAN SQUARES FO P - VALUE
Foam zone 2 3,812,363,001 1,906,181,500 0.29 0.756
Error 13 86,755,014,663 6,673,462,666
Total 15 90,567,377,664
Table 3: One-way ANOVA: Area versus Foam zone.
SOURCES DEGREE OF
FRE-EDOM
SUM OF
SQUA-RES
MEAN SQUARES FO P - VALUE
Foam zone 2 411,432,113 205,716,057 1.13 0.354
Error 13 2,373,939,890 182,610,761
Total 15 2,785,372,004
(a) (b)
Figure 5: Box and whisker graphs: (a). Boxplot of Volume and (b). Boxplot of Area
3 2 1 450000 440000 430000 420000 410000 Foam zone A re a
Boxplot of Area
3 2 1 1550000 1500000 1450000 1400000 1350000 1300000 1250000 1200000 Foam zone V o lu m e
506
Figure 6: Residual plots for volume.
Figure 7: Residual plots for area.
507 statistical evidence that shows no homogeneity in the foam.
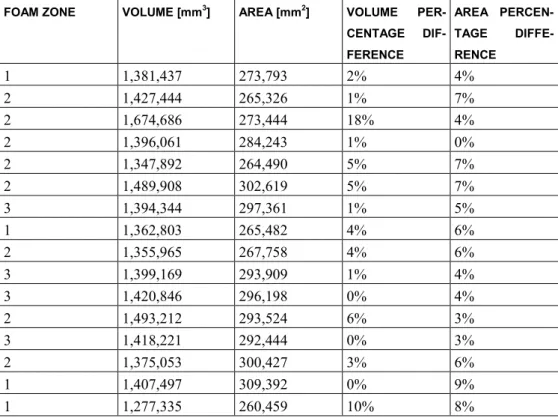
Table 4: Volume, superficial area and percentage difference of the 1.0 mm cell size sample..
FOAM ZONE VOLUME [mm3] AREA [mm2] VOLUME
PER-CENTAGE
DIF-FERENCE
AREA
PERCEN-TAGE
DIFFE-RENCE
1 1,381,437 273,793 2% 4%
2 1,427,444 265,326 1% 7%
2 1,674,686 273,444 18% 4%
2 1,396,061 284,243 1% 0%
2 1,347,892 264,490 5% 7%
2 1,489,908 302,619 5% 7%
3 1,394,344 297,361 1% 5%
1 1,362,803 265,482 4% 6%
2 1,355,965 267,758 4% 6%
3 1,399,169 293,909 1% 4%
3 1,420,846 296,198 0% 4%
2 1,493,212 293,524 6% 3%
3 1,418,221 292,444 0% 3%
2 1,375,053 300,427 3% 6%
1 1,407,497 309,392 0% 9%
1 1,277,335 260,459 10% 8%
Table 5: Volume, superficial area and percentage difference of the 2.0 mm cell size sample..
FOAM ZONE VOLUME [mm3] AREA [mm2] VOLUME
PER-CENTAGE
DIF-FERENCE
AREA
PERCEN-TAGE
DIFFE-RENCE
3 5,942,603 856,090 4% 3%
4 6,392,855 823,117 12% 1%
4 5,772,441 796,834 1% 4%
4 5,879,794 930,776 3% 12%
5 5,657,577 860,088 1% 3%
1 5,279,422 831,757 7% 0%
1 5,933,495 863,018 4% 4%
2 5,413,087 860,690 5% 3%
2 5,148,404 802,194 10% 4%
4 4,704,339 700,987 18% 16%
1 5,542,439 846,233 3% 2%
3 6,126,942 796,116 7% 4%
3 5,416,844 842,066 5% 1%
5 5,814,134 823,313 2% 1%
5 5,570,315 893,318 2% 7%
508
Table 6: Summary of results.
CELL SIZE EXPERIMENTAL
RESPONSE
MEAN STANDARD
DEVIATION
P-VALUE
0.5mm Volume [mm3] 1,401,218 77,703 0.756
Area [mm2] 424,781 13,627 0.354
1.0mm Volume [mm3] 1,413,867 86,727 0.268
Area [mm2] 283,804 16,236 0.275
2.0mm Volume [mm3] 5,705,143 402,076 0.629
Area [mm2] 833,286 54,679 0.374
4. DISCUSSION
There are a number of studies on the effects of pore size on the mechanical properties of aluminum, titanium and magnesium and their alloy foams. It was found that the relationship between the compressive strength and the porosities is completely linear relation beyond the effect of pore size distributions on the mechanical properties [11]. Furthermore, it is worth noting that both the foam structure and the pore morphology depend on the fabrication method, utilized during manufacturing of the foams, which in turn determine the mechani-cal properties [12].
Several authors had shown limited number of methods to produce open cellular structures that allow obtaining uniform pore distribution [12]. In order to probe complex porous structures, high resolution X-ray computed tomography (XCT) or MRI techniques have been used in recent years. Bekoz et al [12], calculated the area of each pore on the SEM image and measured the pores size, shape and size distribution using Cle-mex Vision PE commercial image-analyzer software.
Saadatfar et al [13], used tomographic imaging technique to distinguish small changes in density, pore size distribution and pore geometry/topology of samples of different precursor sizes and geometries, made under gravity.
In this study, taking into account that usually cellular materials having small bubbles with uniform size and spherical shape are guarantee for better mechanical properties, it was found that despite of irregular morphology of pores; the high uniformity in pores distribution obtained with the evaluated process and the presence of numerous channels between the cells, makes CDP foams a sort of materials with oustanding mechanical properties.
5. CONCLUSIONS
The manufacturing and reconstruction process guarantee to obtain physical and virtual foams with a homogenous pore distribution.
It is widely accepted that foams with a uniform pore distribution and defects free, are desirable. It is worth noting that foams made by Casting - Dissolution Process provide uniform pore distribution in an aluminum alloy foam. Furthermore, all sections of metal foams are a representative sample of the entire volume and make useful to evaluate mechanical properties of the foam using computational numerical models, as it was proved by statistical method.
Due to the destructive test disturb the cell structure, 3D image analysis is a worthy method to extract a range of geometrical and topological properties including porosity, pore volume, size distribution and cell connectivity, which are directly measured on the images.
6. BIBLIOGRAPHY
[1] GRISHIN, A. A Mesh-Free Finite Element Solution for Unilateral Contact Problems, Ph.D, Arizona State University, Arizona, United States, 2010.
[2] JARILLO, J.M. Modelización del comportamiento mecánico de una espuma metálica, M. Sc. Universidad Carlos III de Madrid, Madrid, España. 2009.
509 [4] SMITH, B.H., SZYNISZEWSKI, S., HAJJAR, J.F., et al., “Steel foam for structures: A review of applications, manufacturing and material properties”, Journal of Constructional Steel Research, v 71, pp. 1–10, Apr. 2012. [5] BANHART, J. “Manufacture, characterisation and application of cellular metals and metal foams”. Progress in Materials Science, v 46, pp. 559-632, Jan 2001.
[6] PARVANIAN, A,M., SAADATFAR, M., PANJEPOUR, M,. et al,. “The effects of manufacturing parameters on geometrical and mechanical properties of copper foams produced by space holder technique”, Materials & Design., v. 53, pp. 681–690, Jan. 2014.
[7] SURACE, R., FILIPPIS, L., LUDOVICO, A., et al, “Influence of processing parameters on aluminium foam produced by space holder technique”, Materials & Design., v. 30, n. 6, pp. 1878–1885, Jun. 2009.
[8] ZHAO, Y.Y., FUNG, T., ZHANG, L.P., et al., “Lost carbonate sintering process for manufacturing metal foams”, Scripta Materialia., v. 52, n. 4, pp. 295–298, Feb. 2005.
[9] MAIRE, E., FAZEKAS, A., SALVO, L., et al., “X-ray tomography applied to the characterization of cellular materials. Related finite element modeling problems”, Composites Science and Technology., v. 63, n. 16, pp. 2431–2443, Dec. 2003.
[10] BOCK, J., JACOBI, A.M., “Geometric classification of open-cell metal foams using X-ray micro-computed tomography”, Materials Characterization., v. 75, pp. 35–43, Jan. 2013.
[11] WANG, X., LI, J., HU, R., et al,“Mechanical properties of porous titanium with different distributions of
pore size,” Trans. Nonferrous Met. Soc. China, v. 23, no. 8, pp. 2317–2322, Aug. 2013.
[12] BEKOZ, N., OKTAY, E. “Mechanical properties of low alloy steel foams: Dependency on porosity and
pore size,” Mater. Sci. Eng. A, v. 576, pp. 82–90, Aug. 2013.