DATA ENVELOPMENT ANALYSIS – DEA AND FUZZY SETS TO ASSESS THE PERFORMANCE OF ACADEMIC DEPARTMENTS:
A CASE STUDY AT FEDERAL UNIVERSITY OF SANTA CATARINA – UFSC
Ana Lúcia Miranda Lopes *
Production Engineering Department, UFSC
Graduate Program in Business Administration, UNISUL Florianópolis – SC
E-mail: ana@eps.ufsc.br
Edgar Augusto Lanzer
Graduate Program in Business Administration, UNISUL Florianópolis – SC
E-mail: ealanzer@unisul.br
* Corresponding author / autor para quem as correspondências devem ser encaminhadas
Received September 2001; accepted October 2002 after one revision.
Abstract
This paper address the issue of performance evaluation – productivity and quality – of academic departments at an University. A DEA model was used to simulate a process of cross-evaluation between departments. The results of DEA in the dimensions of teaching, research, service and quality were modeled as fuzzy numbers and then aggregated through a weighted ordered aggregator. A single index of performance for each department was generated. The proposal is to identify departments with low performance in one or more dimensions that should receive additional evaluation from an external auditing committee. A by-product of the model is to enlarge the possibility of working with more variables than a conventional DEA model. The model applied to a set of fifty-eight departments of a Brazilian University showed fifteen with low performance. Zero correlation between department teaching, research and service were observed. Weak correlation was detected between research productivity and quality. Weak scale effects were detected.
Keywords: data envelopment analysis, productivity analysis, fuzzy logic.
Resumo
Este artigo trata da avaliação do desempenho – produtividade e qualidade – de departamentos acadêmicos de uma Universidade. Um modelo DEA foi usado para simular um processo de avaliação cruzada entre departamentos. Os resultados de DEA nas dimensões de ensino, pesquisa, extensão e qualidade foram modelados como números difusos e então agregados através de um agregador ponderado. Um único índice de desempenho para cada departamento foi gerado. A proposta é identificar departamentos com fraco desempenho em uma ou mais dimensões que deveriam receber priorização para avaliação por um comitê externo. Um resultado adicional do modelo proposto é a possibilidade de inclusão de um número maior de variáveis do que no DEA convencional. O modelo aplicado a cinqüenta e oito departamentos de uma Universidade Brasileira apontou quinze com baixo desempenho. Nenhuma correlação entre produtividade em ensino, pesquisa e extensão foi observada. Uma correlação fraca foi encontrada entre produtividade em pesquisa e qualidade. Fracos efeitos de escala foram detectados.
1. Introduction
The evaluation of the performance of academic departments is part of the process of resource allocation within a University, a politically difficult task on most Public and Private Universities [see, e.g., Arcelus & Coleman (1997)]. Specialists on education management frequently recommend that each department be evaluated by a group of external referees of the same area of knowledge. This procedure has many merits, but also a few important disadvantages: it is time consuming and it is expensive. Vroeijenstijn (1996) refers to a study of 1993 by Fredericks et al who concluded that very few results were obtained after five years of a program based on external assessments for improvement of the quality of dutch universities, in spite of the significant resources allocated to that process.
In this research we address the following question: can we devise a procedure which is relatively fast and little expensive, but still reliable, to evaluate the performance of all departments from a University, with relatively low data requirements, so that it could be used as a part of the process of resource allocation within the University?
To answer this question we start from the observation that academic departments compete and cooperate with others within a University. They certainly compete for some scarce resources (e.g.: buildings, professors pay-roll) but they also cooperate among them in the production of teaching, research and extension, for this can enhance their capacity of gathering more resources for the whole group (whether it be in the form of attracting more students and higher fees or in the form of a large share of public funds for their University). This means that there exists a permanent process of cross-evaluation of departments within the University. This process is sometimes formal, but not necessarily: peers from the same department exchange objective and subjective information on the performance of other departments, making value judgements presumably according to academic values that are, more or less, shaped by their own departmental life and beliefs. In other words: if, say teaching is very important to a given department, then it will tend to value this activity more than, say, research when it comes to make an informal appraisal of the performance of another department from the same University. Could this process of departmental cross-evaluation be simulated to be used as management tool by University decision-makers?
A referee usually begins his evaluation of a department by examining several indicators (“proxies”) for teaching, for research, for extension (service) and for the quality of the department. He does so in order to form an opinion about the “quantities” that the department has produced of those variables on the past few years. Moreover, the estimation of such “quantity”, say research, depends on the weights that the referee attaches to each of the many several research indicators (papers published on SCI journals, number – and amount – of research grants, papers presented on scientific meetings, cohesion of research teams, etc.). The estimated “quantities” may vary considerably amongst referees, although there is a hope that they will not if the referees belong to the same field of knowledge (even though they may work for different universities and may have different cultural and personal backgrounds, not to mention different specialties within the field of knowledge and, possibly, close friends – or competitors – at the department under evaluation). How to aggregate evaluations made by different referees from the same data on the same subject? In this paper we propose to represent the result of such aggregation as a fuzzy number (the referees will not be persons, but departments instead).
work, following the conclusions of a report of the Carnegie Foundation for the Advancement of Teaching [see, e.g., Magner (1997)], we assume that the answer to this question is “yes”. Under such assumption, we shall develop a model which simulates a “rational academic department cross-evaluation” over common sets of indicators for the productivity of teaching, of research, of service and for academic quality (“rationality” here will stand for the choice of weights that are most beneficial for the self evaluation of a department). The model is based on Data Envelopment Analysis [Charnes et al. (1978); Fried et al. (1993); Cooper et al. (2000); Coelli et al. (2000)] and Fuzzy Set Theory [Zadeh (1965); Klir et al.
(1995)] and was applied, as a case study, to the performance evaluation of academic departments of the Universidade Federal de Santa Catarina – UFSC (a public University on southern Brazil). The idea of using DEA to evaluate academic departments has been already used by Kwinbere (1987), Tompkins & Green (1988), Beasley (1990; 1995) and Johnes & Johnes (1992; 1995). Cross-evaluation in DEA has been examined by Doyle & Green (1994). In this study we go a little beyond this in the sense that cross-evaluations on several dimensions (teaching, research, service, quality) are integrated in a single fuzzy indicator of overall performance through concepts of fuzzy set theory.
2. Materials and Methods
The Universidade Federal de Santa Catarina has 36 undergraduate programs, 29 master programs and 10 doctorate programs. Its staff adds up to 1649 permanent professors grouped into 58 departments. A total of 1889 students completed undergraduate studies, 341 students presented their master’s dissertations and 54 students received their doctorate degree in 1995.
The data for the research came from sparse sources of the central administration of the University and from published material; no primary data were collected at the academic department level. From the available data, the following indicators were built (all indicators of teaching, research and service productivity are per full-time professor equivalent per
year; the quality indicators are dimensionless):
• Teaching Productivity Indicators IT (for the k-th department)
1. IT(1,k) – number of recipients of Bachelor degrees (BS or equivalent) granted by the department (in proportion to department’s teaching load on each Bachelor program of the University) – 1994/1995 average – the number of recipients were adjusted by a factor which reflects the intensity of professor supervision of the area of knowledge according to the Brazilian Ministry of Education recommendations (e.g.: the number of B.S. degrees granted in Medicine receives a weight of two, while the number of B.S. degrees in Economics received a weight of one; suppose the Department of Mathematics teaches 5% of the class hours of the Medicine undergraduate program and 20% of the Economics undergraduate program; then this indicator for the Math department would include 5% of twice the number of Medicine BS degrees granted in the year plus 20% of the number of BS degrees in Economics granted in the same year);
2. IT(2,k) – number of recipients of Master degrees (M) granted by the department (in proportion to department’s teaching load on each Master program of the University) – 1994/1995 average – adjusted as in the previous indicator;
4. IT(4,k) – teaching load of the department; an index computed by the university administration which takes into account the number of hours taught by the department on graduate and undergraduate programs plus hours for student advising – 1995;
5. IT(5,k) – undergraduate work volume (sum of [number of students enrolled on a course times the number of credit hours of the course] for all courses of all undergraduate programs taught by the department) – 1995. Example: if the Math Department teaches a course of 4 hours of classes per week (one credit hour) for 25 students enrolled on the undergraduate program of Economics plus a course of 8 h/w (or 2 credit hours) for 30 students enrolled on the undergraduate program of Sociology, then the Math Department undergraduate work volume is 1*25 + 2*30 = 85.
• Research Productivity Indicators IR (for the k-th department, 1995)
1. IR(1,k) – number of papers published in scientific journals indexed by ISI (Institute of Scientific Information);
2. IR(2,k) – number of papers published on scientific journals not indexed by ISI (this included most of the Brazilian scientific journals, the majority of which do use a referee process);
3. IR(3,k) – number of abstracts published in proceedings from national scientific meetings; 4. IR(4,k) – number of papers published in proceedings from national scientific meetings; 5. IR(5,k) – number of abstracts published in proceedings from international scientific
meetings;
6. IR(6,k) – number of papers published in proceedings from international scientific meetings;
7. IR(7,k) – number of papers presented at the “Research Week” at UFSC (the Federal University of Santa Catarina promotes an annual “research week” where academic staff and students present their work to the community);
8. IR(8,k) – number of books published by department professors; 9. IR(9,k) – number of book chapters published by department professors; 10. IR(10,k) – number of books edited by department professors.
• Service (or Extension) Productivity Indicators IS (for the k-th department, 1995)
1. IS(1,k) – number of social assistance activities registered in the central office for university service (or university extension work);
2. IS(2,k) – number of cultural activities registered in the central office for university service;
3. IS(3,k) – number of scientific meetings (national or international) and conferences organized by the department;
4. IS(4,k) – number of consultant activities delivered to private firms; 5. IS(5,k) – number of courses delivered to the local community;
6. IS(6,k) – number of seminaries, lectures and symposiums delivered to the local community;
7. IS(7,k) – number of technical services delivered to the local community;
8. IS(8,k) – number of student scholarships granted to extension projects developed by the department;
• Quality Indicators IQ (for the k-th department)
1. IQ(1,k) – percentage of the undergraduate teaching load of department k devoted to undergraduate programs which ranked amongst the “Brazilian Top Three Undergraduate Programs”, an independent survey which was financed and published by the Brazilian Playboy Magazine (1996);
2. IQ(2,k) – same as above, except that the “Top Ten” classification was used;
3. IQ(3,k) – same as above, except that in this case we used the set of “Brazilian Recommended Undergraduate Programs”, an independent evaluation of the Abril Guide of Professions (1996);
4. IQ(4,k) – percentage of Master degrees granted by graduate programs that rank amongst the “Brazilian Recommended Graduate Programs” according to the Abril Guide of Professions (1996) and whose teaching load was fully or mostly delivered by the department k;
5. IQ(5,k) – average of points given by CAPES (an office of the Brazilian Ministry of Education whose evaluations are made by ad hoc consultants) to Master programs in which the department k taught over 1/4 of the program load;
6. IQ(6,k) – same as above for doctorate programs; if the department did not participate of any doctorate program, this indicator was given a value of zero;
7. IQ(7,k) – proportion of department professors that had research grants from CNPq (Brazilian National Research Council; these grants are given on a competitive basis); 8. IQ(8,k) – proportion of department professors that were accredited as academic ad-hoc
consultants or referees at CAPES;
9. IQ(9,k) – staff qualification index – this index is an average of the number of professors of the department weighted by their academic degrees (takes a value of 4 if all department professors have a doctorate degree, 3 if all are MS, 2 if all are specialists and 1 if all are BS or BA only or intermediate values according to the respective proportions); 10. IQ(10,k) – teacher performance evaluation by students; average over all courses taught by
department k (max=100).
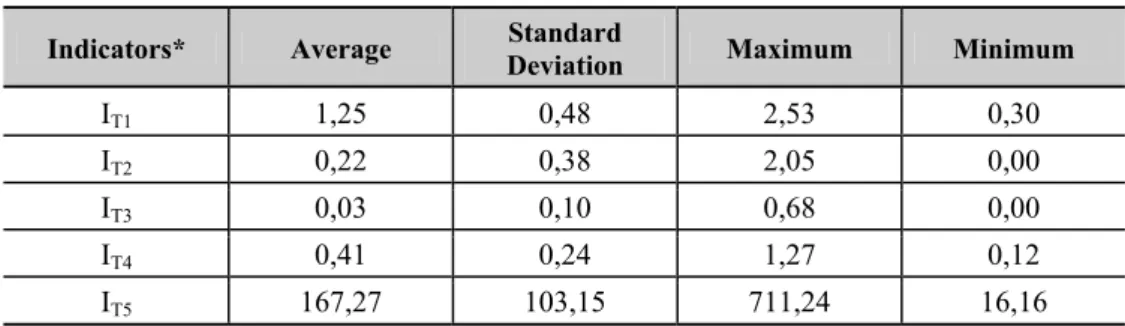
The Tables 1, 2, 3 and 4 as follows show the statistical summary of the productivity indicators used in this research. The data are per full-time equivalent professor per year (except for the quality indicators which are dimensionless).
Table 1 – Statistical Summary of Teaching Productivity Indicators
(per full-time professor equivalent basis per year)
Indicators* Average Standard
Deviation Maximum Minimum
IT1 1,25 0,48 2,53 0,30
IT2 0,22 0,38 2,05 0,00 IT3 0,03 0,10 0,68 0,00
IT4 0,41 0,24 1,27 0,12
IT5 167,27 103,15 711,24 16,16
* IT1 – number of recipients of Bachelor degrees; IT2 – number of recipients of Master degrees (M); IT3 – number of
Table 2 – Statistical Summary of Research Productivity Indicators
(per full-time professor equivalent basis per year)
Indicators* Average Standard
Deviation Maximum Minimum
IR1 0,08 0,18 1,05 0,00
IR2 0,22 0,28 1,73 0,00 IR3 0,80 1,15 6,64 0,00
IR4 0,19 0,41 2,35 0,00 IR5 0,11 0,21 1,24 0,00
IR6 0,08 0,19 0,76 0,00 IR7 0,27 0,56 3,92 0,00
IR8 0,03 0,07 0,47 0,00 IR9 0,02 0,05 0,23 0,00
IR10 0,02 0,06 0,31 0,00
* IR1 – number of papers published in scientific journals indexed by ISI; IR2 – number of papers published on
scientific journals not indexed by ISI; IR3 – number of abstracts published in proceedings from national scientific
meetings; IR4 – number of papers published in proceedings from national scientific meetings; IR5 – number of
abstracts published in proceedings from international scientific meetings; IR6 – number of papers published in
proceedings from international scientific meetings; IR7 – number of papers presented at the “Research Week” at
UFSC; IR8 – number of books published by department professors; IR9 – number of book chapters published by
department professors; IR10 – number of books edited by department professors.
Table 3 – Statistical Summary of Service Productivity Indicators
(per full-time professor equivalent basis)
Indicators* Average Standard
Deviation Maximum Minimum
Is1 0,0361 0,1474 0,9412 0,00
I s2 0,0160 0,0679 0,3889 0,00
I s3 0,0030 0,0099 0,0476 0,00
IS4 0,0540 0,0515 0,2083 0,00
IS5 0,0998 0,1030 0,4746 0,00
IS6 0,0335 0,0542 0,3056 0,00
IS7 0,0295 0,0383 0,1429 0,00
IS8 0,0987 0,1687 0,6786 0,00
IS9 0,2943 0,7364 3,8824 0,00
* IS1 – number of social assistance activities; IS2 – number of cultural activities; IS3 – number of scientific meetings
(national or international) and conferences organized; Is4 –number of consultancies delivered to private firms; Is5
– number of courses delivered to the local community; Is6 –number of seminaries, lectures and symposiums
delivered to the local community; Is7 – number of technical services; Is8 – number of student scholarships granted
to extension projects; Is9 – number of “specialist” diplomas (post-graduation lato sensu) granted by the
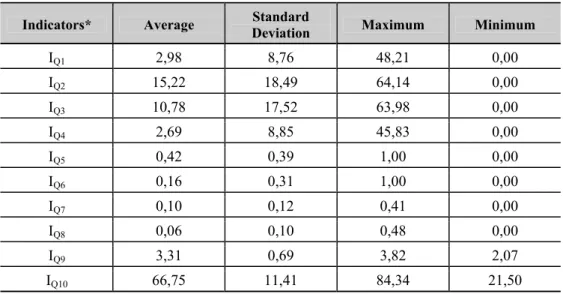
Table 4 – Statistical Summary of Quality Indicators
Indicators* Average Standard
Deviation Maximum Minimum
IQ1 2,98 8,76 48,21 0,00
IQ2 15,22 18,49 64,14 0,00
IQ3 10,78 17,52 63,98 0,00
IQ4 2,69 8,85 45,83 0,00
IQ5 0,42 0,39 1,00 0,00
IQ6 0,16 0,31 1,00 0,00
IQ7 0,10 0,12 0,41 0,00
IQ8 0,06 0,10 0,48 0,00
IQ9 3,31 0,69 3,82 2,07
IQ10 66,75 11,41 84,34 21,50
* IQ1 – first three places at Playboy Ranking; IQ2 – first ten places at Playboy Ranking; IQ3 – Abril student guide
indication; IQ4 – Best master courses according Abril Magazine ranking; IQ5 – Master grade point given by
CAPES; IQ6 – Doctor grade point given by CAPES; IQ7 – proportion of department teachers that are CNPq
researchers; IQ8 – proportion of department professors that were accredited as academic ad-hoc consultants or
referees at CAPES; IQ9 – Department Staff Qualification Index; IQ10 – Student evaluation of the teacher
performance.
All indicators were re-scaled to the 1-101 range and transformed to their logarithms. This procedure was used to reduce eventual effect of outliers on the range of performance indices computed through the DEA models that will be described below.
In order to get the data for the departmental cross-evaluation of teaching, research and extension productivity and quality, we have performed four Data Envelopment Analysis (DEA) models, one for each set of indicators, i.e., teaching (T), research (R), extension work or service (S) and quality (Q). Fuzzy measures of departmental performance in each of these dimensions were derived from the set of performance evaluations that each department received when its indicators were valued under its own optimum choice of indicator weights or “prices” (self-evaluation) and under the choice of indicator weights (“prices”) found as best by each one of the other departments. The basic DEA model for generating the sets of data for performance evaluation of dimension D was:
j 0.03 k) P(j, l 1 l) (j, I * k) P(j, s.t. k) (j, I * k) P(j, PERF Max : k j D j D D k, ∀ ≥ ∀ ≤ = ∀
∑
∑
(1)dimension D. Notice that the set of restrictions sets a range of zero to one for the performance indices of every department. Their left-hand side is the evaluation of the performance index of department l on dimension D under the “prices” chosen by department k. The “prices” chosen by department k are the ones which maximize its own index of performance. Lower bounds on prices were set in order to guarantee that every indicator would get some positive consideration on the performance index of each department, a condition that seemed important to maintain if the sets of indicators had been in fact originated from an agreement among departments (the value of 0.03 was arbitrary and used as an example only). Notice that all indicators are outputs. The only department input we had was its number of full time equivalent professors. In any event, professors pay-roll add-up to over three fourths of operational costs of Brazilian public universities [for a thorough discussion on academic department inputs see Madden, Savage & Kemp (1997)].
Therefore, applying model (1) to each department at a time, generates a set of performance indices for each department on dimension D. At the end, we get the index of performance of department k under its own choice of weights for the several indicators of D and also under the choice of weights most favorable to each of all other departments (cross-evaluation). Thus, at this point, the performance index of department k on dimension D is, in fact, a set (or frequency distribution) of 58 numbers (there were 58 departments in the study). We also decided to give a weight of 5 to the performance index of department l when it was computed according to “prices” set by department k if both l and k were from the same general field of knowledge (“close” peers) and a weight of one in the other cases.
For each department k, and dimension D, its computed performance indices were ordered and smoothed through a moving average procedure. Since most of the resulting smoothed relative frequency distributions resembled the figure of a triangle, we decided to represent each of them as a triangular membership function fuzzy number (Klir & Yuan, 1995). The median was taken as the point of maximum membership function of the departments fuzzy performance index in a given dimension. The representation of the aggregate appraisal of the performance of department k on dimension D through a fuzzy number rather than a probability distribution of opinions of peers comes from the fact that little room is left for chance in this modeling of the evaluation process. Yet, the outcome can not be represented as a single crisp number, which makes the choice of fuzzy sets an interesting alternative to deal with the lack of unanimity.
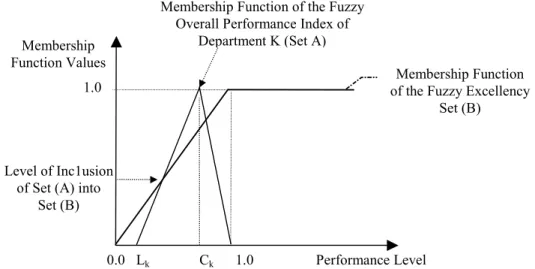
Finally the four fuzzy partial performance measures (T, R, S, Q) of each department were integrated into a single overall (fuzzy) performance measure through an ordered weighted aggregator – OWA (Yager, 1993). This OWA was designed to represent a department choice of weights for its own (fuzzy) performance on the dimensions T, R, S and Q in order to maximize its overall (fuzzy) performance. This idea was put in practice through the maximization of the level of inclusion of the fuzzy set “overall department performance” into another (fuzzy) set which represents “Excellency” (see Figure 01, below). The set of “Excellency” can be seen as one where “full excellency” demands a crisp unity in each one of the four dimensions of academic productivity and quality of a department (so that the overall performance is also a crisp unity). Partial excellency is given by the level of inclusion of the fuzzy overall department performance into the fuzzy excellency set.
5 . 0 W(D)
15 . 0 W(D)
1.0 = W(D)
o subject t
(D))) L -(D) C ( * (W(D)
-1
(D)) L * (W(D) Max
D
D K K
D K
≤ ≥ ∑
∑ ∑
(2)
where W(D) is the weight associated to performance on dimension D (D = T, R, S, Q); Lk(D) is the left bound of the triangular fuzzy number representing the performance of the k-th department on dimension D; and Ck(D) is the value corresponding to the maximum of the membership function of the fuzzy number representing the k-th department performance on dimension D. Lower and upper bounds on weights represent the condition that no dimension should be totally overviewed on an academic evaluation (bound values are, of course, arbitrary in this study – in an actual application, these bounds should be negotiated among the departments).
Membership Function of the Fuzzy Excellency
Set (B) Membership Function of the Fuzzy
Overall Performance Index of Department K (Set A) Membership
Function Values
Level of Inc1usion of Set (A) into
Set (B)
0.0 Lk Ck 1.0 Performance Level
1.0
Figure 01 – Inclusion of the Fuzzy Overall Performance of a Department into the Excellency Set
3. Results
Teaching Research Extension Quality
Performance Index
Membershi
p
D
e
gree
0.0 0.2 0.4 0.6 0.8 1.0
0.0 0.1 0.2 0.3 0.4 0.5 0.6 0.7 0.8 0.9 1.0
Figure 02 – Fuzzy Performance of Aquiculture Department
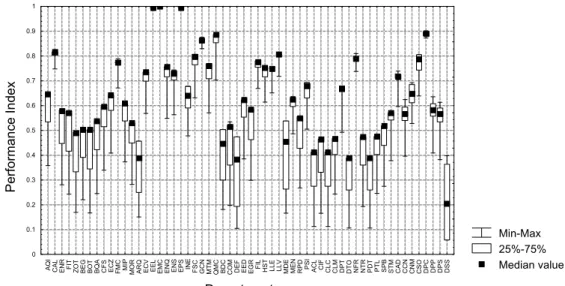
Fuzzy productivity in teaching was relatively homogeneous among departments. The same was not observed for research and extension productivity as well as for quality. Figure 03, below, shows the performance of the 58 academic departments on the quality dimension (notice, however, that the triangular fuzzy numbers for the performance indices were taken from the inner 10-90 % relative frequency distribution decils; this was a consequence of the smoothing of the distributions via a moving average process).
Min-Max 25%-75% Median value
Departments
Performance Index
0 0.1 0.2 0.3 0.4 0.5 0.6 0.7 0.8 0.9 1
AQI CAL ENR FI
T
ZOT BEG BOT BQA CFS ECZ FMC MI
P
MOR ARQ ECV EEL EMC ENQ ENS EPS IN
E
FSC GCN MTM QMC BDC COM DEF EED EGR FI
L
HST LLE LLV MDE MEN RPD PSI ACL CI
F
CLC CLM DPT DTO NFR NTR PDT PTL SPB STM CAD CCN CNM CSO DPC DPP DPS DSS
Figure 03 – Distribution of Quality Performance Index of UFSC Departments
research productivity and quality was the largest one, but still around a percentage determination of 25% only; see Table 05). The virtual zero correlation between productivity levels in teaching, research and extension is somewhat surprising, particularly if one assumes that all department professors are using all of their work time in those activities only: quite a few strong negative correlations would be expected in this case. However, many professors may be engaged on duties of higher administration, for, by and large, Brazilian universities are run by their professors (this data was not available for this research and may vary considerably among departments). Moreover, institutional requirements for group decision making procedures in virtually all aspects of academic life may become highly time consuming (this also may vary considerably among departments). In any event the lack of strong negative coefficients between alternative productivities gives room to the hypothesis of resource slackness and need for better management practices in some departments. We also note that low correlations between research and teaching productivities was also the conclusion reached by Hattie & Marsh (1996) on a meta-analysis of 58 studies on this topic.
Table 05 – Correlation Coefficients Between the Four Performance Dimensions
Teaching Research Service Quality
Teaching 1.00 -0.23 -0.10 0.02
Research -0.23 1.00 0.09 0.51*
Service -0.10 0.09 1.00 -0.02
Quality 0.02 0.51* -0.02 1.00
* indicates that the coefficient differs from zero at α = 0.05
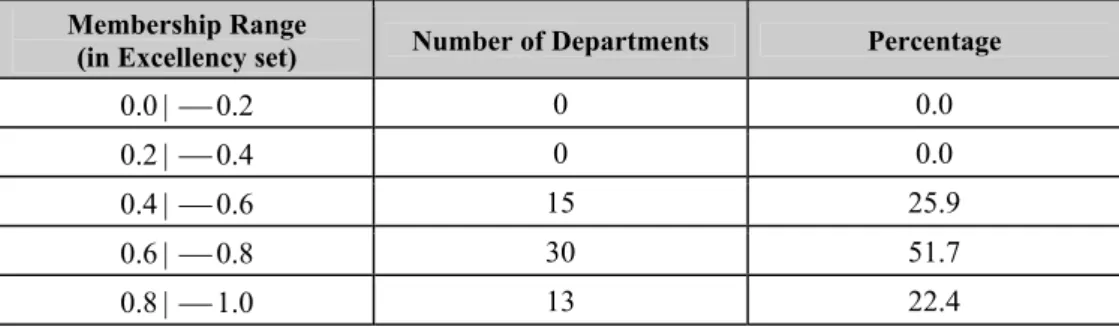
At a more aggregate level, using the computed degrees of membership of each department in the excellency set, i.e., the overall performance index, it was possible to identify 15 departments which should receive priority for (possibly external) auditing and advising processes (Table 06, below).
Table 06 – Distribution of the Inclusion of UFSC Academic Departments in the Excellency Set
Membership Range
(in Excellency set) Number of Departments Percentage
0.0 | 0.2 0 0.0
0.2 | 0.4 0 0.0
0.4 | 0.6 15 25.9
0.6 | 0.8 30 51.7
0.8 | 1.0 13 22.4
upper tail of overall performance is in line with the (local) belief that these areas are the ones which contribute most to UFSC visibility in the national context. This result, in a sense, helps to validate the model. On the other hand, a more detailed analysis of the performance of individual departments on each dimension of performance (T,R,S,Q) may help to design specific policies for their overall performance improvement.
Table 07 – Distribution of Departments in Overall Performance Classes According to Areas of Knowledge
Classes of Overall Performance Area of Knowledge
0.4 |- 0.6 0.6 |- 0.8 0.8 |- 1.0 Total
Agricultural Sciences 1 4 1 6
Biological Sciences 2 4 1 7
Exact Sciences 0 2 2 4
Engineering 1 3 4 8
Humanities 1 6 3 10
Languages & Arts 1 2 0 3
Social Sciences 3 4 1 8
Health Sciences 6 5 1 12
Total 15 30 13 58
Finally, scale effects with regard to partial productivities, quality and overall performance were evaluated through a simple correlation analysis (fuzzy numbers taken at maximum of membership function). A correlation analysis, in this case, was more straight forward than the use of the DEA model for scale effect evaluation. This is because the DEA model variables were measured on a per professor basis and the evaluation of scale effects within the model would demand going back to variable definitions. A weak (significant at α = 0.05) positive correlation was found between research productivity and department size (R = 0.37), while a weak negative correlation was found for teaching productivity and department size (R = -0.42). This result is similar to the findings of Gauder (1995) for the productivity of the departments of the Utah University. Service (or extension) were not correlated to department size (R= 0.16; not significant at α = 0.05). Department quality and overall performance were found to correlate positively – though weakly – with department size (R = 0.54 and 0.37, respectively). Kyvik (1995) did not find scale effects in this regard on a study at departmental level of the four main Norwegian Universities. Therefore our results are in line with similar research in the matters of productivity and quality as associated with academic department size.
4. Conclusions
incorporates the notion of equity in the sense that each DMU evaluates, and is itself evaluated by, all other DMU’s. This seems to be more appropriate in the context of evaluation of academic departments and generates, rather naturally, a fuzzy interpretation of the evaluation scores because of the dispersion of opinions. On the other hand, the data requirements of the model are relatively easy to find within the central administration files of most Universities (a bootstrap benchmarking process is implicit in our model). This, together with the relative simplicity of its main concepts, could help model acceptance in a practical setting [see, however, Massy & Wilger (1995) on University professor’s points of view with regard to productivity evaluations]. Finally, model extensions can also be devised in the sense of making predictions of performance impacts from resource allocation alternatives along the general lines developed by Ehrenberg & Hurst (1996), as well as for ex-post policy evaluations. However, this kind of model should be seen as a decision aid only: the use of allocation rules strictly based on quantitative performance is subject to well grounded criticism, at least within the academy [see Watson (1996) and Arcelus & Coleman (1997)].
References
(1) Arcelus, J.F. & Coleman, D.F. (1997). An efficiency review of university departments.
International Journal of Systems Science, 28(7), 721-729.
(2) Beasley, JE. (1990). Comparing university departments. Omega, 18, 171-83.
(3) Beasley, JE. (1995). Determining teaching and research efficiencies. Journal of the
Operational Research Society, 46, 441-452.
(4) Charnes, A.; Cooper, W.W. & Rhodes, E. (1995). Measuring the efficiency of decision making units. European Journal of Operational Research, 2(6), 429-444.
(5) Coelli, T.; Prasada Rao, D.S. & Battese, G.E. (2000). An introduction to efficiency and
productivity analysis. Kluwer Academic Publishers, Boston/Dordbrecht/London.
(6) Cooper, W.W.; Seiford, L.M. & Tone, K. (2000). Data Envelopment Analysis: A comprehensive text with models, applications, references and DEA-solver software.
Kluwer Academic Publishers, Boston/Dordbrecht/London.
(7) Doyle, J.R. & Green, R.H. (2000). Cross-evaluation in DEA: improving discrimination among DMUs. INFOR; 33, 205-222.
(8) Ehrenberg, R.G. & Hurst, P.J. (1996). The 1995 NRC ratings of doctoral programs: a hedonic model. Change; 28(3) 46-54.
(9) Fried, H.O.; Lovell, C.A.K. & Schmidt, S.S. (1993). The measurement of productive efficiency – techniques and applications. Oxford University Press, Oxford.
(10) Gauder, J.P. (1995). Academic research and teaching productivities: A case study.
Technological Forecast and Social Change, 49(3), 319-328.
(11) Hattie, J. & Marsh, H.W. (1996). The relationship between research and teaching: a meta-analysis. Review of Educational Research, 66(4), 507-542.
(13) Johnes, G. (1995). Scale and technical efficiency in the production of economic research. Applied Economic Letters, 2, 7-11.
(14) Johnes, J. & Johnes, G. (1995). Research funding and performance in UK university departments of economics – a frontier analysis. Economics of Education Review, 14, 301-314.
(15) Klir, G. & Yuan, B. (1995). Fuzzy sets and fuzzy logic: theory and applications.
Prentice-Hall, New Jersey.
(16) Kyvik, S. (1995). Are big university departments better than small ones? Higher
Education, 30(3), 295-304.
(17) Kwimbere, F.J. (1987). Measuring efficiency in not-for-profit organizations: an attempt to evaluate efficiency in selected UK university departments. M.Sc. thesis, School of Management, University of Bath.
(18) Madden, G.; Savage, S. & Kemp, S. (1997). Measuring public sector efficiency: a study of economy departments at Australian universities. Education Economics, 5(2), 153-168.
(19) Magner, D.K. (1997). Report says standards used to evaluate research should also be used for teaching and service. The Chronicle of Higher Education, Washington, 5.
(20) Massy, W.F. & Wilger, A.K. (1995). Improving productivity. Change, 27(4), 10-19.
(21) Podinovski, V.V. (1999). Side effects of absolute weight bounds in DEA models.
European Journal of Operational Research, 115, 583-595.
(22) Tompkins, C. & Green, R. (1988). An experiment in the use of data envelopment analysis for evaluating the efficiency of UK university departments of accounting.
Financial Accountability and Management, 4, 147-164.
(23) Vroeijenstijn, A.I. (1996). Avaliação externa da qualidade no ensino superior. Conselho de Reitores das Universidades Brasileiras, Brasília, Brazil.
(24) Yager, R.R. (1993). Families of OWA operators. Fuzzy Sets and Systems, 59(2), 125-148.
(25) Watson, L. (1996). Public accountability or fiscal control? Benchmarks of performance in Australian schooling. Australian Journal of Education, 40(1), 104-123.