DOI: http://dx.doi.org/10.1590/1980-5373-MR-2016-1084
Assessment of Percolation Threshold Simulation for Individual and Hybrid Nanocomposites
of Carbon Nanotubes and Carbon Black
Paulo Henrique da Silva Leite Coelhoa*, Victor Antonio de Deus Armellinib, Ana Rita Moralesb
Received: December 14, 2016; Revised: June 28, 2017; Accepted: August 17, 2017
Modeling electrical conductivity of polymer composites with conductive illers has great
applicability to predict conductive materials behavior. In this study, the electrical behavior of simple and hybrid systems prepared from Carbon Black (CB) and Carbon Nanotubes (CNT) was studied. There have been few advances reported in the literature regarding the modeling of hybrid systems,
which motivated the development of this study. More speciically, a program was developed with the intention to describe the electric percolation threshold and the efect of synergism between the conductive illers. Simulation was performed using the Monte Carlo method and Fortran programming language, considering concentration and geometry of conductive illers to the system in two dimensions. Finally, simulation results were compared with the experimental results and this method proved to be efective
in predicting the systems percolation threshold, being an important contribution to predict material behavior, which allows reducing the number of samples to be prepared in an experimental study.
Keywords: Percolation, Polymer nanocomposites, Simulation, Hybrid illers, Monte Carlo method.
*e-mail: [email protected]
1. Introduction
Adding electrically conductive particles such as carbon black (CB) and carbon nanotubes (CNT) above critical concentrations in an insulating polymer resin has been a resource for obtaining conductive composites1.
Combining diferent carbon illers is an alternative for
obtaining a system with balanced properties and costs. The
mixture of these types of illers can be more eicient when forming conductive networks, since illers with high aspect ratios such as CNT can act as carriers for electrical illers,
and particles with lower aspect ratio such as CB can have
the function of illing the spaces, promoting interconnection between the nanotubes in the polymer compound. The diferent characteristics of carbon conductive illers may provide, to
the composite, an electrical percolation threshold at lower concentrations, when compared to composites with only
one type of iller2,3.
The main issue about the conductive polymer nanocomposites is the conductivity variation as function of conductive particles concentration, where a critical concentration can be observed, from which an increase in the system conductivity occurs. This phenomenon can be explained by percolation
theory. Several percolation models have been developed to
describe this phenomenon, and there is a comprehensive review described in the literature4. However, almost all of
these models describe the phenomena to only one type of
conductive iller, and very little has been discussed on a suitable model for systems with diferent conductive carbon particles. The works of Sun et al.,5 and Socher et al.,6 described,
from the excluded volume theory, electrical percolation of
individual CNT and CB illers and their mixtures as a function
of volume fraction of these particles.
Among the methods used in the simulation of these models that describe percolation, the Monte Carlo method has provided satisfactory results since it is associated with the generation of random numeric data for obtaining values
deterministically diicult to deine7. It has been widely used
in solving several models in which an analytical resolution cannot be found.
The evaluation of percolation threshold of simulated
systems consists in randomly generate a predeined fraction of elements deined as conducting particles, in a fully
insulating matrix of suitable size. This procedure is derived from the classical percolation theory by site8, and leads to
a theoretical value for the percolation threshold, which
is generally deined by square lattices (two-dimensional systems) or cubic (three-dimensional systems)9. The matrix
fraction occupied by conductive elements is provided to the program, representing the fraction of the volume of conductor additive in the composite. Upon reaching a concentration where an interconnected network of conducting elements is formed, the program encounters the critical value called the percolation limit (pc)4.
The vast majority of theoretical works cited in the literature10-13 describes models in which conductive illers
aChemical Engineering, Federal Univesity of Maranhao, 65080-805, São Luis, MA, Brazil.
are considered to be straight or rigid rods. However, this is
not the CNT structure reality. The lexibility in these existing illers and high aspect ratio form interlaced nanotubes in the
polymer matrix. This structure complicates the modeling and
simulation process because the itting leads to a diversity of particles coniguration.
In order to create a simulator, some important aspects
must be deined, such as the core feature, which determines
how the simulator will handle the overlapping particles. While many modeling studies consider CNT as permeable cylinders or with "soft core", assuming that the electrical percolation threshold and the geometric percolation occur simultaneously9, other studies consider a more realistic
situation: CNT has no direct overlap with each other, being called "hard core", and are wavy instead of rigid rods14,15. In
simulation by Monte Carlo method it is possible to observe an inverse proportionality between the percolation threshold and the excluded volume for both "soft core" and "hard core". But, the "hard core" model is more appropriate for modeling composites where the mechanism of electrical conduction is
by tunneling. Furthermore, the proportionality constant was found to be governed by the illers aspect ratio14. Considering a system where illers are iber-shaped, if these are highly curved or even curled, there is a signiicant diference in the modeling for rigid or lexible ibers. For shorter ibers, the curvature efect is much more pronounced than for longer ibers in percolation threshold prediction15.
The “hard-core” model is considered to be more faithful to the laws of physics; however, the use of “soft-core” model is more common in the literature since it is simpler
to be implemented and requires less computing resources.
However not always the results obtained by this model are close to the experimental results and their use should be evaluated in each case15.
Another important parameter to consider is spatial
discretization, which is a consequence for the use of a discrete
matrix to represent the full or empty sites.
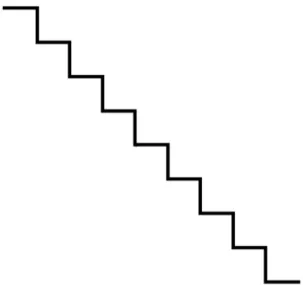
Due to discretization a iber or tube can be represented
as a zig-zag parallel or orthogonal segment to the matrix
axes (Figure 1), which represents the discretized space and is similar to the curling behavior of the ibers as previously
discussed in the literature15,16. These works consider that this curling can afect the percolation threshold. The discussion is supported by theoretical analysis of curling ibers inluence in percolation threshold, showing that the curling efect in
the percolation threshold is negligible at aspect ratios smaller
than 100, and even for larger aspect ratios the efect is small. For CB, particles in the insulating matrix does not
generate a concern regarding the discretization. Typically, these particles are considered as spherical; however, what
apparently seems to facilitate the simulation, in fact the iller geometry leads to a diiculty, since CB particles are always aggregated presenting diferent conformations in the matrix.
Figure 1. Scheme of CNT discretized.
Considering the potential application for iller hybrid
systems and that investigations are still necessary concerning
the synergism efects between illers, the aim of this study
was to develop a program that simulates percolation threshold
for particles with diferent aspect ratios. The study was based
on Monte Carlo method, supported by excluded volume
model, and programmed in Fortran language. The program was developed in order to it the percolation threshold of
nanocomposites experimentally prepared with individual
CB and CNT illers and with illers blends, called hybrid
systems. The results of the mathematical simulation were compared with those obtained for a polymer matrix of PMMA. This work considered a perfect system, which excluded the
efect of parameters that could inluence the behavior of
conductive composites. We considered the particles to be not agglomerated, i.e. individual, an average aspect ratio, a perfect dispersion and a homogeneous system.
2. Materials and Methods
The CNT material was a multi wall carbon nanotube, TNM2 from Chengdu Organic Chemicals Co. Ltd fabricated by chemical vapor deposition, with 95% of purity, average external diameter of 11.5 nm and average length of 50 µm. The conductive Carbon Black (CB) was high structure Printex XE2, from Evonik Degussa GmbH, average particle size of 30 nm. The monomer was the methyl methacrylate (MMA)
M/4950/08 from Fischer Scientiic that was previously puriied to remove hydroquinone. The solvent employed was acetone PA-ACS from QUEMIS. The polymerization was conducted in solution of acetone PA-ACS from QUEMIS in presence of the initiator 2,2′-Azobys (2-methylpropionitrile)
(AIBN) Vaso 64, DuPont.
Pre-mixtures were prepared by adding different
MMA, and AIBN. The solutions were purged with N2, and
then submitted to ultrasonic stirring using a UP400S probe (Hielscher) at 100 W and constant pulse frequency of 24 KHz
for 20 minutes. To complete the polymerization, the samples
were kept at 80 °C for 24 hours. The ilms are obtained by
casting with diameter of 55 mm and thickness of 0.5 mm,
approximately. In order to calculate the illers volume fraction (V) the density of the illers were determined by gaseous pycnometry, and for PMMA, by liquid pycnometry. Single-conductive-iller illed systems (SCFFS) formulations were
previously studied to obtain the pc published as pc = 0.2 vol.% for CNT17 and p
c = 1.5 vol. % for CB
18. From these p c and CB illers were prepared as shown in Table 1. The Sun's model, described by Equation 1 was used to describe the condition for additive behavior, i.e., the MCFFS presents percolation5.
(1)
where pc,CNT and pc,CB are percolation threshold of single
illers systems, and VCNT and VCB are individual volumetric fraction of respective illers.
obtained in an Ultramicrotome LEICA model ULTRACUT - UCT 020, cutting speed of 1 mm/s using a diamond knife Diatome, Cryo-Wet.
3. Simulation
The simulation algorithm for the Monte Carlo method was
programmed in FORTRAN language (Frtran 95 - Silverfrost
Plato Version 4.61).
The program was developed to simulate percolation threshold, pc, of two-dimensional square matrices for particles with diferent shapes and aspect ratios. For comparison of
simulated particles geometries with experimental particles,
it was considered that each point of the matrix would ill
the space referring to 10 nm. Thus, the adoted aspect ratio of 1000 for the CNT was represented by a diameter of 10 nm and a length of 1 µm.
A two-dimensional square matrix with n x n elements was associated to insulating matrix of experimental PMMA,
and simulated for diferent values of n.
The 2D square network of nxn elements was deined as follows:
• "0" represents the polymer matrix (insulating elements);
• "1" represents the illers (conductive elements).
The irst step was constructing an insulating matrix
network formed by elements 0. After generation, the algorithm converts a fraction initially set by the user in conductive elements randomly positioned by a generator of random numbers (Monte Carlo method) in the conductive matrix.
This fraction represents the amount of conductive illers
present in the polymer. Three simulators were developed,
one for each iller and another to hybrid systems, where the diference was the illers geometry. CNT were considered to have length equal to their aspect ratio and diameter as the matrix point value. In order to equalize the dimensional representation between the illers, the CB aggregates were considered square whose side value is a multiple of point value, which in turn was assumed equal to the CNT diameter.
4. Results and Discussion
4.1 Experimental
PMMA-based SCFFS and MCFFS containing CNT and
CB were developed aiming to analyze the electrical percolation threshold (pc), the conductivity values and the dispersion of
the illers. Figure 2 shows the MCFFS and SCFFS electrical
conductivity. The results for the single systems are published elsewhere17,18 and were shown here to compare the diferent systems. Samples 1-4 presented electrical conductivity while
for samples 5-8 no conductivity was observed, evidencing
that Sun's model its the studied systems.
p
V
p
V
1
, ,
c CNT CNT
c CB CB
+
=
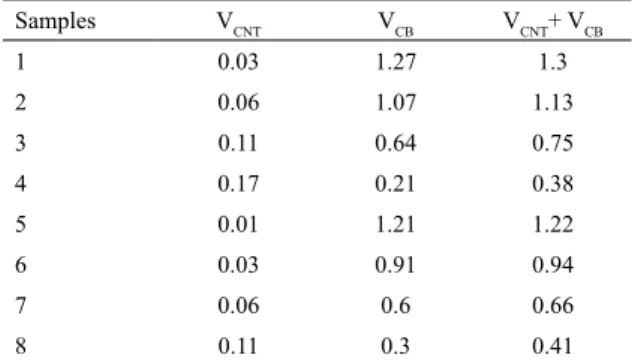
Table 1. Volumetric fraction (V) (%) of CNT and CB in the MCFFS Samples VCNT VCB VCNT+ VCB
1 0.03 1.27 1.3
2 0.06 1.07 1.13
3 0.11 0.64 0.75
4 0.17 0.21 0.38
5 0.01 1.21 1.22
6 0.03 0.91 0.94
7 0.06 0.6 0.66
8 0.11 0.3 0.41
MCFFS were prepared by varying VCB for a ixed VCNT. Total iller concentration on the systems was always below the sum of the critical concentration of the individual illers,
i.e., pc,CNT + pc,CB < 1.7 vol. (%). To test the Sun's model for our system we tested diferent scenarios. Samples 1-4 from
Table 1 represent the additive condition VCNT/ pc,CNT + VCB/ pc,CB
= 1; when VCNT/ pc,CNT + VCB/ pc,CB > 1, the conductive illers
connect to each other, and the material is conductive; when
VCNT/ pc,CNT + VCB/ pc,CB < 1, the conductive illers separately
disperse in the polymer matrix, and the electrical conductivity is not expected and samples 5-8 represent this condition.
Volumetric electrical conductivity was determined by a four-point probe test, Jandel Universal Probe RM3, supplied with a 100 Ohm test resistor and with aligned probes and 0.1 cm spacing. Measurements were made in the range of 10 nA-10 µA.
Morphology was studied by using a High Resolution Transmission Electron Microscopy (HR-TEM) JEOL 3010
4.2 Simulation
4.2.1 Veriication of Simulator for scattered points.
In order to evaluate the simulator capacity to generate random numbers, the initial tests on the simulator were
performed assuming illers as individual points of the matrix
lattice, according to the routine described hereinafter for
which Figure 3 illustrates the program response of a 5X5 elements matrix with the concentration of 60% illers.
Figure 2. Experimental volumetric electrical conductivity as a function of MCFFS and SCFFS concentrations.
In order to determine the critical percolation threshold
on electrical conductivity, for MCFFS the power relationship was applied (Eq. 2) on the double logarithmic graphic log σ vs. log σ (p - pc).
(2)
where the percolation threshold (pc) was obtained relating the volumetric electrical conductivity (σ) to the volumetric
concentration of conductive iller into the matrix (p). The t is the critical exponent and is related to the network dimensional
aspects. Figure 2 shows the results.
The experimental pc value was 0.195 vol. (%) (VCNT
+ VCB). In general, the critical exponent t depends on the system dimension and depends strongly on the particle type, whose value is set between 1.65 and 2 for three-dimensional network19-21. However, for CB composites, the t obtained was 1.18 ± 0.09 for a regression coeicient of 0.96. This diference occurred due the complex geometry and the
structure of the aggregates formed and to the conduction
efect between the aggregates1,20,22. For CNT, t = 2.34 ± 0.19, for a regression coeicient of 0.94, which is an evidence of
a three-dimensional conductive network as already found
by Kim et al.,23, that related critical exponent t of 2.4 and pc = 0.3 wt % for CNT/PMMA composites. For MCFFS,
the t value is not usually found in the literature. However, as the nanotubes are mainly responsible for the percolative network formation, we can compare the t with the values found in other studies. The range of critical exponent values
from experimental measurements obtained by diferent
situations indicates that t is not universal. For CNT, Bauhofer
and Kovacs1 have related experimental t values for
three-dimensional percolating systems between 1.3 and 4, which
would be consistent with the MCFFS value t = 2.21 ± 0.15. Other studies have also shown that the percolation threshold
is dependent of conductive illers morphology (size, shape
and the aspect ratio)24-27.
,
p
p
ct
v a
Q
-
V
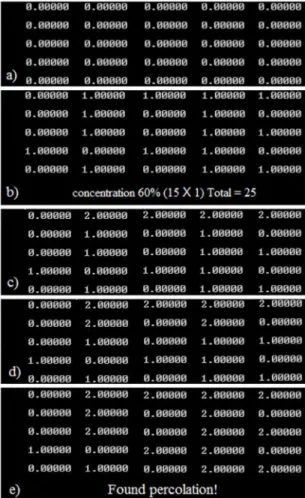
Figure 3. Matrices of veriier of Simulator of elements 5X5 with the concentration of 60% conductive illers.
The distribution of scattered points is not a real situation of electrically conductive composites; however, this method of particles distribution has been widely adopted for comparison with known percolation threshold values28-31.
4.2.2 Algorithm:
- generation of the insulating matrix formed only
by elements "0" (Figure 3a);
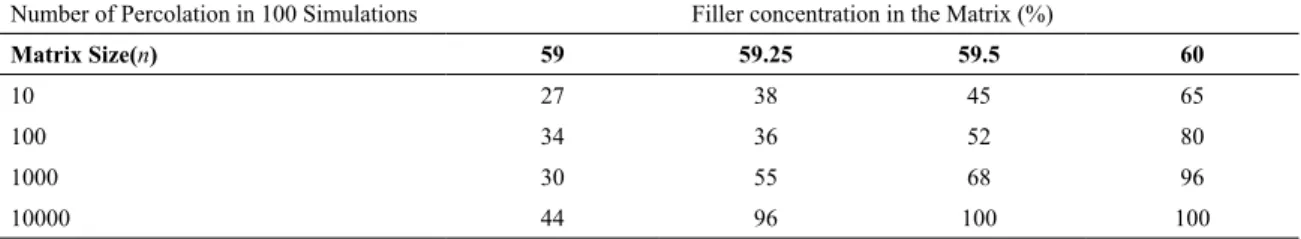
Table 2. Number of percolation in 100 simulations for diferent size matrices.
Number of Percolation in 100 Simulations Filler concentration in the Matrix (%)
Matrix Size(n) 59 59.25 59.5 60
10 27 38 45 65
100 34 36 52 80
1000 30 55 68 96
10000 44 96 100 100
- analysis whether the random position is occupied or not by a conductive element. If not, the position turns the number "0" into "1" (insulating - conductor); if yes, the generator processes a new number probably
in a diferent position;
- maintenance of generation of conductive elements until the number of elements, which represents the
desired volume fraction of conductive illers, is found (Figure 3b).
After the distribution of conductive elements, it was necessary to analyze the generated matrix and verify if the percolation value was enough to form a continuous path of
illers that allows the movement of electrons and becomes
composite conductor. Thus, the simulator analyzed the interconnectivity of the conductive elements. This procedure was performed with the following algorithm:
- scanning the irst line to conductive elements identiication ("1"). When found, the program transforms it on value "2" (Figure 3c);
- analysis of the existence of a neighbor around this point that is also a conductor element ("1"). After that the program also transforms these neighboring connected elements to value "2". If it does not occur, the simulator performs the same procedure
for another conductor element (Figure 3d).
- after complete scanning and processing of the matrix for connected elements, the occurrence
in the last line of elements "2" is veriied. If this happens, the frequency of appearance is equal to
the number of pathways percolated in the system
(Figure 3e).
The structure coniguration deined by the simulator relects the conditions for the percolation as described by the
theory and the pc values can be deined to points scattered randomly in the two-dimensional square lattice case. We
found pc = 59.3%. The aim at this stage is mainly to vary the matrix size, n, to verify the simulator randomness capacity.
As the simulator is representative of illers with high aspect
ratio (ar), the matrix will have to present high n values, so that not only ar, but also the concentration of values less than 1% can be represented by scattered points. As a result of this evaluation of the simulator capacity, the pc values
for two-dimensional square lattices were simulated for 100
consecutive matrices and the results obtained are reported in Table 2.
Analyzing the results in Table 2 it can be said that the simulator
describes, with conidence above 95%, that, for a matrix with
edge n equal to 10000, pc has values varying between 59.25 and 59.5 %, that is, very close to 59.3 %. This n value will also enable ar representation above 1000, possible for CNT, and will generate the possibility of allocating 100,000,000 sites, essential
for the simulation of small concentrations. For these reasons,
the value n = 10,000 was deined for the remaining simulations carried out in this study.
Before discussing the results for systems with single
and hybrid illers, a fundamental fact in the interpretation
of later results should be emphasized, the dimensionality of simulated network. It is known in the literature that percolation values are tabulated9, and for diferent types of network geometry, a signiicant decrease of this threshold
occurs when comparing the change in dimension of the network formation, from 2D to 3D. In the case of scattered
points for square and cubic networks, the pc 2D value of
59.3 %, found by the simulator, should be closer to 31.1 % if it was developed for 3D system formation. This reduction should be considered when comparing the experimental results with simulated results.
4.2.4 Simulation of composite with Carbon Nanotubes
In this part of the study, the simulator was adjusted to calculate the percolation threshold of nanocomposites as
discretized ibers. For the simulation, entering the information as concentration and aspect ratio of the conductive illers was
necessary. The way of nanotubes random distribution was performed by the Monte Carlo method in accordance with algorithm. The provision of nanotubes was considered to be random and oriented at 45°, based on the excluded volume
model. Figure 4 shows the iller real morphology (Figure 4a) and the individual CNT simulated model (Figure 4b).
The iber diameter was deined as unitary, so that the ar
value entered into the programming was the CNT length.
However, as shown in Figure 4, the zig-zag coniguration, that
is, the discretization of nanotubes represented a diameter with two points, which would double the tubes length. To minimize
this length efect and to ensure nanotubes concentration in the matrix, Equation 3, based on the excluded volume
model, was applied to determine the CNT number entered for percolation (Nc,CNT).
(3)
n = size in points of matrix edge
VCNT = volumetric fraction of CNT simulated
ar = (aspect ratio).
.
/
/
N
c CNT,n V
CNTar
2
2
Figure 4. (a) Morphology and (b) Scheme of volume representation of CNT structure in simulator perspective.
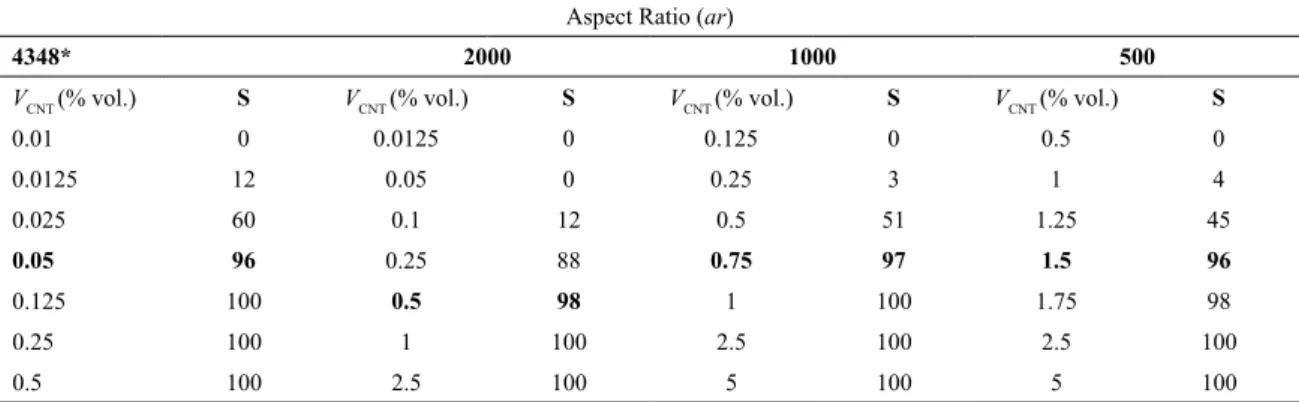
Table 3. Simulation of pc,CNT with ar variable of CNT and evaluation of percolation success in 100 consecutive simulated matrices.
Aspect Ratio (ar)
4348* 2000 1000 500
VCNT (% vol.) S VCNT (% vol.) S VCNT (% vol.) S VCNT (% vol.) S
0.01 0 0.0125 0 0.125 0 0.5 0
0.0125 12 0.05 0 0.25 3 1 4
0.025 60 0.1 12 0.5 51 1.25 45
0.05 96 0.25 88 0.75 97 1.5 96
0.125 100 0.5 98 1 100 1.75 98
0.25 100 1 100 2.5 100 2.5 100
0.5 100 2.5 100 5 100 5 100
*Aspect ratio based on CNT provider data and study of COELHO et al.,24
The ar division by the constant correction 2 minimizes
the diameter efect on the concentration, turns it into unitary, and does not inluence the CNT contact capacity created by
the simulator.
Moreover, it was necessary to determine which core model would be used in simulations, the “hard-core” model, which prevents two particles from occupying the same space or the “soft-core” model that allows this to occur. Relying on
the fact that overlapping favorably inluences the simulation time, the “soft-core” model was used overlapping of illers
in the two-dimensional space is allowed.
One factor that should also be considered is ar
polydispersity of nanotubes and particles distribution32,33. Due to the diiculty in representing this polydispersity in
the programming, the average size was taken as a basis for calculating ar of particles in most models described in the literature10. However, it is important to point out that in dispersion processes, such as soniication, the percolation threshold is inluenced by the time, the mode and the power used in the dispersion of the illers that will directly inluence in the aspect ratio due the possible break of the
nanotubes that can increase the polidispersivity. Therefore major errors can occur when average size was taken as a basis for calculating ar of particles.
As there is an inluence of dispersion and the sizes of conductive iller in percolation threshold, to analyze this efect, simulations were performed for diferent ar values,
varying iller volume concentration (VCNT) in the matrix.
The percolation success (S) was evaluated in 100 successive
simulations and a pc value was admitted when success
ensured conidence above 95%. Table 3 shows the results.
Table 3 shows that the simulator presented consistency in the simulation results, as by increasing VCNT values, the
success, S, also increases, reaching values of 100% percolated
matrices when the pc value was simulated, highlighting pc
values, which showed a decrease with ar increasing. For better results viewing, an ar versus pc graph was constructed, which
is shown in Figure 5. It can be seen that pc is ar function.
Figure 5. Graph of ar values in pc function for 100 consecutive simulations.
Considering the coniguration adopted for discretized
nanotubes and randomly arranged at 45º in the matrix, it was found that ar decrease in approximately 9 times, from 4348 to 500, generating a pc increase of about 30 times, suggesting that for low critical concentration of percolation, a high ar was required by the simulator. Another observation is that for ar values below 500, the curve tends to present a plateau, indicating that small reductions in ar have a strong
inluence on pc increase.
To check the program eiciency, the simulated results
were compared with experimental values. The pc value found
experimentally for CNT/PMMA was 0.2 % vol. For this value in the graph in Figure 5, the vertical line indicates that an ar
percolation was conirmed, S, on 98 of 100 matrices created (Figure 5). Therefore, it can be assumed that the program
determined a pc value of 0.2%, also found experimentally for ar below the number provided by the CNT manufacturer. These results show that the simulator generated consistent values in pc determination compared with those found in the literature10 and evaluated by theoretical approach of random particle distribution. Some studies state low pc values with low ar values11-13. This diference occurred because the simulation
was performed in 2D, resulting in values higher than would be the actual condition, 3D, where the possibility of contact
between the particles would be higher, thus requiring lower illers concentrations to the percolation. Celzart et al.,11,
following this approach, calculated the percolation threshold in 3D for compounds containing CNT randomly oriented in the epoxy matrix, to aspect ratio of 500, and found a 0.5% critical mass concentration. This result is consistent with pc
experimental value of CNT/PMMA of 0.2 % vol.17, which
when converted to mass value is 0.45%. This suggests the suitability of the current 3D simulator may be more representative when determining the percolation threshold. 4.2.5 Simulation of composites with Carbon Black
For CB systems, adjustments were made in the simulator
based on the same principles of random distribution of particles; however, the program was used to calculate the
percolation threshold of aggregated spherical particles. For the simulation, deining the geometry and the household size was necessary, in addition to conductive illers concentration. The
process for distribution of CB spherical particles (considered
circular - 2D) was similar to the ibers process; however, the diiculty was in deining the geometry of aggregates of
particles. The primary particle size and surface area, usually
deined by the supplier, are not suicient to describe the
distribution phenomenon in polymer matrices. It is known that
the provision of these particles is "grape-like", with diferent
aggregate sizes34. This geometry precludes representative
simulation of this primary structure, because, if the circular unitary particles of CB were randomly placed by the simulator, this trend of aggregation would be hardly expected. To solve this problem, the structural dimension of the aggregate was
assumed to be multiple of unitary points (1 illed site is 10 nm), related to the diameter on CNT simulation. Deining the
geometry of the aggregate structure was fundamental when
simulating CB, as this would inluence both the extent of contact between the illers and the CB concentration in the
matrix. This dispersion behavior of the spherical particles
in forming the structure is shown in Figure 6, and allowed the deinition of the aggregate structure and a model that
could represent the exclusion of voids.
The literature usually deines CB geometry of aggregates
as spherical10; however, in the simulator programming, square-shaped geometry was the one that best suited the
possibility of representing the branched structure. Besides
it still has the capability of contact when the square side was deined with the same size of the particle diameter. The square
geometry was chosen because it represents the dimensional
limit of the micrograph Figure 6a. Thus, one can evaluate how a real square plot of material would be summated by the
program. Moreover, as there is no separation of individual particles and the structure is highly branched, there is a
signiicant void area that interferes in the generation of an
average geometry for the simulation. Therefore, these gaps
should be disregarded for the simulator, since the squares
generated will have the same contact ability of the branched structure, but are directly interfering in the matrix composite
concentration. To consider this efect the excluded volume model was taken as base, and it was deined that, in two dimensions, the excluded area of the aggregate is the square area. However, this square area cannot be representative of
CB concentration, and a correction factor was deined in Equation 4, designed for calculating the number of aggregates
in the matrix, Nc, CB.
(4)
n = size in points of matrix edge
VCB = simulated volume fraction
Lq = size in square side points.
α = correction factor, which deines the ratio between the total concentration of the square (total number of points) and the concentration of spaces illed by aggregated spherical
particles (number of points considered as concentration).
Figure 7 shows the aggregate scheme in the simulator perspective (Figure 7a) and representative α ratio of branched particle, responsible for correction of CB concentration in
the matrix (Figure 7b).
Another diiculty in simulating the CB system was to determine the square size that was representative of the
agglomerates and the representative α value of the illers
concentration. Therefore, the simulation was done to deine
percolation thresholds, pc, based on the variation of some
α values for diferent square dimensions. Table 4 shows
the results.
By adopting α = 0, that is, by considering a square illed
by conductive illers, the simulator basically behaved in the
same proportion of scattered points found in the previous simulator test, that is, pc values close to 60 % vol. The α
values equal to 5 and 10 represent, respectively, that the square is illed with 1/5 and 1/10 of conductive illers, as the remainder of the square illing are empty spaces. Thus,
the excluded area of CB cluster, which is closely connected
to contact capacity between illers, will be the same as the
.
/
.
N
c CB,n V
CBL
q2 2 1
a
=
Q
-V
Figure 7. Scheme of volumetric representation of CB aggregate in the matrix: (a) aggregate in the simulator perspective; (b) aggregate after applying α correction factor.
Table 4. Percolation threshold values for CB systems: variation of Lq and value of α.
α 0 5 10
Lq (points) pc(% vol.) pc(% vol.) pc(% vol.)
50 60 45 35
100 55 30 25
200 50 20 12.5
400 60 17.5 7.5
square. Higher values of α indicate higher values of Nc, that is, the number of particles dispersed in the matrix increases, allowing a greater possibility of forming a pathway for
electric current passage, generating a consequent reduction
of percolation threshold. In order to evaluate the best α
correction and to verify the program eiciency, the simulated
results were compared to the percolation threshold found experimentally. The value of α = 10 applied to the model was the best concentration simulated correction, since the simulated pc value of 7.5% vol. for L
q of 400 was the one
closest to the experimental value of 1.5 % vol., even though it was 5 times lower. Therefore, it is assumed that this α value
is a valid relation, and the graph of Figure 8, may suggest
a better approximation of these results.
Emphasizing the direct association of Lq with pc, one may suggest that for the simulated value be even closer to the experimental, the aggregate size should have a diameter greater than 400 points, that is, an actual value of 4 µm side, if again the enforced relationship for CNT is considered: 1
point is equivalent to 1 nm. When comparing this value with
respect to the primary particle diameter, 30 nm, the aggregate side would have thousands of unitary spheres to complete the
Figure 8. Lq in function of pc for 100 consecutive simulations for the correction factor α = 10.
However, reviewing the work of Hauptmanc et al.35 for CB
Printex XE 2 B, it was found that the average aggregate size was approximately 8 µm in diameter, two times greater than the 400 simulated points. This would probably lead to a smaller pc value. To evaluate this assumption, the linearization of a curve of Lq as a function of pc, Fig 8, was performed.
This applied mathematical analysis on a logarithmic scale allowed adjusting a pc 5% vol. value to a 8.6 µm diameter, near to the found in the literature35, for a linear regression coeicient, R, close to 99% as shown in Figure 9.
Figure 9. Linear adjustment of log curve (Lq) vs log (pc) for CB.
Thus, in the simulation the 8.6 µm diameter was adopted, which converted into points resulted in Lq of 860 occupied sites. The 5 % vol. was simulated and success was obtained in 97 of 100 simulated matrices. This simulated value was the closest to the experimental value, and therefore adopted for calculating the percolation threshold of hybrid nanocomposites.
4.2.6 Simulation of Hybrid Nanocomposites
At this stage of the work, the percolation threshold
determination was developed for hybrid illers, pc,H, by
a simulator in FORTRAN, by applying the Monte Carlo
method. Therefore, deining the simulator capacity to assess the random dispersion of individual illers was necessary. Previously items conirmed that the program has shown eiciency in the approximation of values of pc,CNT and pc,CB experimental of individual illers, since the results were
close to experimental values in the literature, after ar and
Lq deinition, for CNT, and CB. Based on this analysis, to
study pc,H, the process was deined based on values of pc,CNT
and pc,CB simulated and assumed to be 0.2% vol. with aspect ratio of 3500 for CNT, and 5% vol. for the aggregate size of 860 sites for CB. Experimental comparison for evaluating the simulator capacity to meet the percolation threshold
for the hybrid system was subsequently performed. In this
stage the values of simulated concentrations were the same
calculated by the Sun et al.5, model, described in Equation
1, and shown in Table 1.
To evaluate the simulator eiciency, the simulated results were compared with the experimental values, Figure 3, and
are shown in Table 5. Taking these settings as bases, samples from 1 to 4, which satisfy the condition VCNT/ pc,CNT + VCB/
pc,CB = 1 of percolation proposed in the Sun model, and for
samples from 5 to 8, which are below the provided in the model, VCNT/ pc,CNT + VCB/ pc,CB < 1.
One has to point out that the values calculated for
samples 1-4, by the Sun’s model, were obtained from the
experimental percolation threshold, pc,CNT e pc,CB, 0.2% vol. and 1.5% vol. respectively. The simulated pc,CB value for the CB was found to be 5.0% vol., which was higher than the experimental pc,CB. As the same algorithm was applied in the hybrids simulation, it would be expected that no sample of hybrid system would success in percolation, because the
equation 1 (Sun´s model) would not be fulilled. However, when analyzing the results of Table 5, with 95% conidence
it was observed that samples 3 and 4 percolated, even though with values well below the experimental percolation threshold, showing that the program provides the synergism
efect between illers. In order to perceive the synergetic results of the hybrid systems Table 5 and Figure 3 should
be analyzed simultaneously. When comparing, for example, sample 3, where the simulated percolation was 0.11 % vol CNT + 0.64 % vol. CB = 0.75 % vol, with simulated values
for individual illers, 0.2 % vol. CNT and 5% vol. CB, one
can observe a reduction of almost 1/2 the CNT concentration and 1/8 the CB concentration, still describing the hybrid nanocomposite as a conductor.
Another important aspect was to relect on the importance
of high CNT aspect ratio on simulated percolation, since as well as in the experimental part, the CNT has served as a coupling agent, as when it was in concentration an order of magnitude lower than its individual percolation, the simulation did not determine success with the adopted
95% conidence. Therefore, it is reasonable to assume that
Table 5. Percolation Success (S) of 100 simulations for hybrid nanocomposites.
Samples VCNT(%vol.) VCB (%vol.) Total (%vol.) S
1 0.03 1.27 1.3 27
2 0.06 1.07 1.13 79
3 0.11 0.64 0.75 95
4 0.17 0.21 0.38 96
5 0.01 1.21 1.22 0
6 0.03 0.91 0.94 29
7 0.06 0.6 0.66 35
8 0.11 0.3 0.41 47
Figure 10. TEM micrographs for MCFFS (a) conductive networks; (b) larger view of scattered CB and CNT.
method randomness approximates experimental pc,H value, indicating a good prediction of the threshold for hybrid
illers. The morphology of a speciic the sample containing
0.06 vol. (%) of CNT and 1.07 vol. (%) of CB was analyzed
by TEM and the micrograph is presented in Figure 10. It represents the illers interactions in the hybrid percolative morphology where the bridge efect of CNT to CB aggregates
could be possible. CB aggregates and CNT is homogeneously scattered in the polymer matrix. This feature reveals CNT linking the CB aggregates forming conductive networks. These networks were also observed in other studies27,34,36.
CB morphology is “grape-like”, consisting of individual nanoparticles34. CNT, due its high aspect ratio, can act as
conducting links between the CB particles34,37. In our study,
we can describe the morphology as a “grape-cluster-like”34
conductive network in which CB particles serve as grapes and CNT acts as branches.
5. Final Remarks
Conductive behavior of nanocomposites of carbon black, carbon nanotubes and their blends were studied. A program
based on Monte Carlo method, supported on the excluded volume model was developed for two-dimensional systems. It was concluded to be promising to perform simulations for
percolation threshold of hybrid systems. Simulated percolation threshold values for individual illers were consistent with the experimental results and the literature. For hybrid systems,
the simulator could predict the synergism between the
illers, which may suggest that an efective dispersion and good control of aspect ratio of the illers can reproduce this efect in real conditions. However, it has also been discussed
that considering average values of particles size can result in inaccuracies in the results. A future approach is a study including particle size polydispersity in programming. In
addition, an expansion for 3D has the potential to better it
the simulator with the experimental reality. This can be a great contribution to the reduction of samples amount to be prepared in an experimental study.
6. Acknowledgements
The research was conducted with support from LNNano
ABTLuS / MCTI. The authors also thank to CNPq for inancial support to the project and Semiconducting Components Center (CCS-Unicamp).
7. References
1. Bauhofer W, Kovacs JZ. A review and analysis of electrical percolation in carbon nanotube polymer composites.Composites
Science and Technology. 2009;69(10):1486-1498.
2. Clingerman LM, Weber EH, King JA, Schulz KH. Synergistic efect of illers in electrically conductive nylon 6,6 and polycarbonate based resins. Polymer Composites. 2002;23(5):911-924. DOI: 10/1002/pc.10488
3. Thongruang W, Spontak RJ, Balik CM. Correlated electrical conductivity and mechanical property analysis of high-density polyethylene illed with graphite and carbon iber. Polymer. 2002;43(8):2279-2286.
4. Lux F. Models proposed to explain the electrical conductivity of mixtures made of conductive and insulating materials. Journal
of Materials Science. 1993;28(2):285-301.
5. Sun Y, Luo S, Watkins K, Wong CP. Electrical approach to monitor the thermal oxidation aging of carbon black illed ethylene propylene rubber. Polymer Degradation and Stability. 2004;86(2):209-215. DOI: 10.1016/polymdegradstab.2004.04.2013
6. Socher R, Krause B, Hermasch S, Wursche R, Pötschke P. Electrical and thermal properties of polyamide 12 composites with hybrid illers systems of multiwalled carbon nanotubes and carbon black. Composites Science and Technology. 2011;71(8):1053-1059.
7. Metropolis N. The beginning of the Monte Carlo Method. Los
Alamos Science. 1987;Spec Iss:125-130.
8. Strümpler R, Glatz-Reichenbach J. Conducting polymers composites. Journal of Electroceramics. 1999;3(4):329-346. 9. Zallen RA. The Percolation Model. In: Zallen RA. The Physics
of Amorphous Solids. Chap. 4. Hoboken: Wiley; 1983. 10. Balberg I, Anderson CH, Alexander S, Wagner N. Excluded
volume and its relation to the onset of percolation. Physical
Review B. 1984;30(7):3933-3943.
11. Celzard A, McRae E, Deleuze C, Dufort M, Furdin G, Marêché JF. Critical concentration in percolating systems containing a high-aspect-ratio iller. Physical Review B. 1996;53(10):6209-6214. DOI: 10/1103/PhyRevB.53.6209
12. Wu SH, Massaharuj I, Natsuki T, Ni QQ. Electrical Conduction and Percolation Behavior of Carbon Nanotubes/UPR Nanocomposites. Journal of Reinforced Plastics and Composites. 2006;25(18):1957-1966.
13. Bug AL, Safran SA, Webman II. Continuum Percolation of Rods. Physical Review Letters. 1985;54(13):1412-1415. DOI: 10.1103/PhysRevLett.54.1412
14. Berhan L, Sastry AM. Modeling percolation in high-aspect-ratio iber systems. I. Soft-core versus hard-core models.
Physical Review E. 2007;75(4 Pt 1):0411201. DOI: 10.1103/ PhyRevLett.75.041120
15. Berhan L, Sastry AM. Modeling percolation in high-aspect-ratio iber systems. II. The efect of waviness on the percolation onset.
Physical Review E. 2007;75(4 Pt 1):0411211. DOI: 10.1103/ PhysRevE.75.041121
16. Dalmas F, Dendievel R, Chazeau L, Cavaillé JY, Gauthier C. Carbon nanotube-illed polymer composites. Numerical simulation of electrical conductivity in three-dimensional entangled ibrous networks. Acta Materialia. 2006;54(11):2923-2931.
17. Coelho PHSL, Marchesin MS, Morales AR, Bartoli JR. Electrical percolation, morphological and dispersion properties of MWCNT/ PMMA nanocomposites, Materials Research. 2014;17(Suppl 1):127-132. DOI: 10.1590/S1516-14392014005000059
18. Coelho PL, Morales AR. Comparative Study of the Electrical Percolation and Dispersion of CB/PMMA Composites. In: XIV
Latin American Symposium on Polymer; 2014 Oct 12-16; Porto de Galinhas, PE, Brazil.
19. Balberg I, Binenbaum N, Wagner N. Percolation Thresholds in the Three-Dimensional Sticks System. Physical Review Letters. 1984;52(17):1465-1468.
20. Al-Saleh M, Sundararaj U. Electromagnetic Interference (EMI) Shielding Efectiveness of PP/PS Polymer Blends Containing High Structure Carbon Black. Macromolecules Materials and Engineering. 2008;293:621-630.
21. Kirkpatrick S. Percolation and Conduction. Reviews of Modern Physics. 1973;45(4):574.
22. Sichel EK, Gittelman JI, Sheng P. Electrical properties of carbon-polymer composites. Journal of Electronics Materials. 1982;11(4):699-747.
23. Kim HM, Kim K, Lee SJ, Joo J, Yoon HS, Cho SJ, et al. Charge transport properties of composites of multiwalled carbon nanotube with metal catalyst and polymer: application to electromagnetic interference shielding. Current Applied
Physics. 2004;4(6):577-580.
24. Schaefer D, Hurd A. In: Proceedings of the Symposium on the Chemistry and Physics of Composite Media; 1985; Toronto, ON, Canada. Pennington: The Electrochemical Society. p. 85-88, 54-62.
25. Keefer KD, Schaefer DW. Growth of Fractally Rough Colloids.
Physical Review Letters. 1986;56(22):2376-2379.
26. García-Gutiérrez MC, Nogales A, Hernández JJ, Rueda DR, Ezquerra TA. X-ray scattering applied to the analysis of carbon nanotubes, polymers and nanocomposites. Óptica Pura y
Aplicada. 2007;40(2):195-205.
27. Villmow T, Pegel S, Pötschke P, Wagenknecht U. Inluence of injection molding parameters on the electrical resistivity of polycarbonate illed with multi-walled carbon nanotubes.
Composites Science and Technology. 2008;68(3-4):777-789.
28. Newman MEJ, Zif RM. Eicient Monte Carlo algorithm and high-precision results for percolation. Physical Review Letters. 2000;85(19):4104-4107. DOI: 10.1103/PhysRevLett.85.4104
30. Lee MJ. Complementary algorithms for graphs and percolation.
Physical Review E. 2007;76(2 Pt 2):027702. DOI: 10.1103/ PhysRevE.76.027702
31. Lee MJ. Pseudo-random-number generators and the square site percolation threshold. Physical Review E. 2008;78(3 Pt 1):031131. DOI: 10.1103/PhysRevE.78.031131
32. Chatterjee AP. Percolation thresholds for rod-like particles: polydispersity efects. Journal of Physics: Condensed Matter. 2008;20(25):255250. DOI: 10.1088/0953-8984/20/25/255250
33. Mecke KR, Seyfried A. Strong dependence of percolation thresholds on polydispersity. Europhysics Letters. 2002;58(1):28. 34. Wen M, Sun X, Su L, Shen J, Li J, Guo S. The electrical
conductivity of carbon nanotube/carbon black/polypropylene
composites prepared through multistage stretching extrusion.
Polymer. 2012;53(7):1602-1610.
35. Hauptman N, Vesel A, Ivanovski V, Gunde MK. Electrical conductivity of carbon black pigments.Dyes and Pigments. 2012;95(1):1-7
36. Lellinger D, Xu D, Ohneiser A, Skipa T, Alig I. Inluence of the injection moulding conditions on the in-line measured electrical conductivity of polymer-carbon nanotube composites. Physics
Status Solid B. 2008;245(10):2268-2271.