CHARACTERIZATION AND
PRODUCTION OF CONDUCTIVE
FILLER FROM OIL PALM ASH AND
ITS PERFORMANCE IN EPOXY
MATRIX
1
OTHMAN MAMAT, 2RAPHAEL JOSHUA MAILABARI 1,2
Mechanical Engineering Department Universiti Teknologi, PETRONAS, Bandar Seri Iskandar, Perak Malaysia
E-Mail: [email protected], [email protected]
ABSTRACT
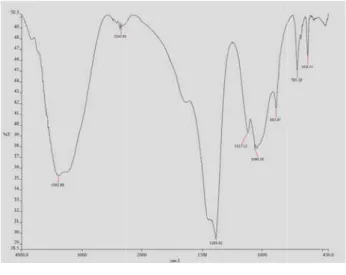
Oil Palm Ash (OPA) was investigated and the FESEM studies showed medium sized particle with a crushed structure. An XRD diffractogram of OPA showed that the obtained OPA contain aluminum, silicon and they exist in their oxide form as indicated by the high percentage of oxygen (36%) with little traces of potassium oxide, calcium oxide, magnesium oxide. while FTIR analysis indicated the occurrence of functional groups such as OH groups, silanol hydroxyl groups of silica or the N-H stretching vibration free imines, aromatic C-H and C-Br alkyl functional group and the presence of methyl CH3. OPA was carbonized in a furnace with the control
flow of nitrogen and ball milled at 100 rpm for 3 hours to obtain a carbonized particle with a diameter of 77.9-140.9 nm. The synthesized carbon black (CB) Particle was dispersed in epoxy resin (DGEBA) at different loading to produce an electrically conductive polymer with a well-dispersed network of electrical conducting particles.
Key words: Electrical conductive Particle, Epoxy Resin, Oil palm Ash, Carbon Black, Dispersion, Composite
INTRODUCTION
Oil palm ash (OPA) is a bio agricultural waste from oil palm mills (Zarina et al., 2013), (Abdul Khalil et al., 2011), Palm fibers, kernel shells, kernel and empty fruit bunch from oil palm mills are incinerated in boilers at about 800-1000oC and use as fuel for the production of energy (Hashim and Chu, 2012), 5% ash which is the bye product obtained from this process (Tay and Show, 1995) is known as OPA. There are about 42 countries involved in the production of Elaeisguineensis (palm oil tree) which is a non-temperate plant that is cultivated in hot and humid condition at altitudes not higher than 500 meters above sea level (Udoetok, 2012) with about 27 million acre of land area (Abdul Khalil et al., 2012). Malaysia is among the largest manufacturer and exporter of palm oil in the world, and there is approximately 4 million tons of oil palm ash generated annually (Ooi et al., 2014), (Ooi et al., 2015). OPA is available in great quantity, renewable, can be obtained at no cost and show a good performance at high thermal condition (Ibrahim et al., 2012).
Nanotechnology is the art of manipulating, organizing and measurement of matter at the atomic scale or the nanometer scale (≤ 100 nm) (Sheetz et al., 2005). It has been proving that material properties can be dramatically improved through the use of nanoscale building unit. When polymers are reinforced using this nanoscale unit or filler particles in a homogeneously dispersed state a nanocomposite is formed (Kochetov, 2012). Nanoparticle fillers possess a large surface area to volume ratio and usually form a polymer nanocomposite (PNC) with an outstanding property. Nanofillers can be organic or inorganic and can be classified according to their geometry as 3D fillers or particulate, nanofibres or nanowires, nanotubes and nanoplatelets (Supova, 2011).
In recent times, nanotechnology is progressively being used in polymers to enhance a variety of properties and to expand their application, for instance, carbon nanofibres (CNF) thermoplastic laminates are known to have excellent heat stability, mechanical property and low flammability making them good candidate material for use in aerospace industry (Hong, 2010). Kochetov, 2012 investigated the use of inorganic nanoparticulate fillers (Al2O3, MgO, SiO2, boron and aluminum nitrides) to improve the dielectric and thermal property epoxy
resin. Aldrahem et. al., 2009 fabricated a functional paint for vibration monitoring by dispersing carbon black (CB) nanoparticulate in epoxy resin. Cochrane et al., 2007 developed a flexible strain censor for textile structures by the homogenous dispersion of CB nanoparticulate in evoprene. Despite these advances research have shown that most polymers are incompatible with nano-size fillers causing lack of adhesion between polymer and nanofillers (agglomeration of the nanoparticle) and, therefore, difficulty in achieving uniform dispersion (Pham et al., 2007), (Supova et al., 2011), (Kochetov, 2012).
Polymers are substances made up of a persistent structural unit which can be regarded as resulting from a definite compound called a monomer. Polymers in whatever form they exist (natural or synthetic) usually have the desirable property of being light weight, flexible, ease of production, good mechanical properties and resistant to corrosion attack. Synthetic polymers can be classified into Thermoplastic (e.g. Polyethylene), thermoset (e.g. epoxy resin or polyesters) and Elastomers. Polymers can be considered as engineering materials and have therefore been the subject of research to improve its property and expand its usage in the engineering profession. Polymers have low stiffness, low strength and some polymers (e.g. resin) have low resistance to crack initiation (Dong et al., 2004). Reinforcing of polymer have being in existent for sometimes, polymers reinforcement using both synthetic and natural fibrous material such as glass fibre, wood, kenaf, rice husk, carbon fibre etc. have being carried out, with significant improvement in the mechanical properties of polymer being achieved and much more so when the fibre reinforcing efficiency is further enhanced by chemical modification (Hornsby, 1997).
Electrical conductive polymer composites can be made by dispersing electrically conductive particles such as silver (Ag), copper powder, carbon nanotubes (CNTs) etc. in a polymer base. Polymers are usually dielectric in nature and are often use as insulators of electricity however when conducting nanoparticles are dispersed uniformly within the polymers matrix they became semiconductors and the electric conducting part is largely dependent on the forces or phenomena acting on the nanocomposite hence they act as sensors. The main factor inducing the nanocomposite conductivity is the concentration of the nanofiller particles, at low filler content the conducting nanoparticles are disconnected and electric current may flow only by means of tunneling through a non-conducting medium between the adjacent nanoparticles, the transport charge is not efficient and conductivity is very low. As the nanoparticle concentration is increased conductivity gradually rises because resistance to charge transport get relaxed until at the percolation threshold when conductivity precipitously increases (Blythe and Bloor, 2005).
Polymers such as epoxy resin, has a low percolation threshold due to active percolation routes, which happen during the curing process, preceding gelation (Sandler et al., 2003). Current findings show that the networks of electrical conducting particles in epoxy resin react to mechanical loading and is being utilized for sensing stress-/strain and damage detection in polymer composite material (Boger et al., 2008). Therefore, this paper is reporting the characterization of OPA and CB obtained from the pyrolysis of OPA. The work also investigated the electrical conductivity performance of CB at different filler loading in epoxy resin.
DETAILS EXPERIMENTAL METHOD Materials and Procedures
using a mechanical stirrer at a high speed to obtain a homogenous suspension. The suspension was poured into a mold with dimension 50 x 50 x 5mm and cured at ambient temperature for 24 hours. This procedure was repeated for 20, 22, 24, 26, 28, 30, 32 and 33%wt of CB. To obtain the conductivity of the sample of compacted conductive filler was placed in between two aluminum plate to obtain their resistance R to electricity using a DT9205A digital multimeter and the conductivity is obtained using the formula in equation (1) and (2) below
(1)
Where L is the length, A being cross-sectional area of sample and ρ is the resistivity, the conductivity is given by
(2) The characterization of the OPA was done using FESEM, TEM, FTIR and SAP analyses.
Field Emission Scanning Electron Microscope
The elemental constituent, particle size and surface morphology of raw and derived conductive Filler were investigated using a variable Pressure Field Scanning Electron Microscope model Zeiss Supra55 VP equipped with energy dispersive x-ray (EDX) microanalysis system which senses the x-rays emitted from the sample because of the high-energy electron beam piercing into the test piece. The x-ray spectra were obtained and analyzed, resulting in a quantitative information of the elemental constituent of the test piece. A routine was utilized, which results to in accuracy of 1-2% and sensitivities for some elements down to 0.1 weight percent.
Fourier Transform Infrared Spectroscopy
Elemental studies including the functional group of the OPA was examined using FTIR spectrometer model Pelkin Elmer, Spectrum One. 0.5g of OPA sample is placed on the ATR which consists of a diamond crystal in the center of the mounting plate, the sample is placed over the crystal and the infrared (IR) beam is directed from the bottom to a depth of about 1-2µm and information about the infrared radiation at all frequency is collected for the sample.
Transmission Electron Microscope
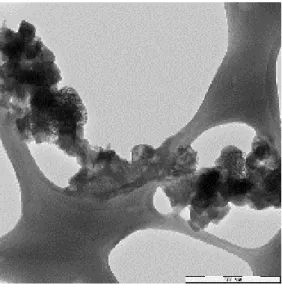
A Zeiss Libra 200 model TEM was used for the morphological studies of OPA samples, the sample was dispersed in methanol solvent using sonication for 30 minutes, The OPA sample was observed to have dispersed in the solution the during sonication process, yielding a homogeneous suspension of the sample. Drops of the suspension were placed on lacey carbon grids for electron microscopy analysis. Zeiss Libra 200/FEG transmission electron microscope, working at 200 kV with Koehler illumination. initially, the area having OPA sample was found in TEM mode and using a condenser aperture of 15 μm and a convergent beam size of 5 nm, the large angle dark-field STEM imaging utility of the Libra was used to acquire a scanning image of the located area as shown in fig. 1. to acquire a clear diffraction pattern, the STEM stationary beam utility of the Libra was then use to create a small, nearly parallel beam with a diameter of 300 nm.
Surface Area Analyzer and Porosimetry
RESULTS AND DISCUSSION TEM Image
Fig 1 shows the TEM image of the raw OPA sample showing traces of carbon Black with cellular cell structure.
Fig 1: TEM image of Obtained OPA
3.2. FESEM Image
The FESEM image (Fig.2A) revealed medium sized particle with crushed shapes structure, the shape differ from spongy and porous structure reported by Jaturapitakkul et al., 2007 but with cellular texture with somewhat regular spaces. Fig. 2B shows the FESEM image of the obtained electrically conductive filler with evidence of spherical nanoparticle of diameter 77.9-140.9nm.
Fig 2: FESEM image of (A) obtained OPA and (B) the produced CB
FTIR spectrum of obtained OPA
silanol hy N-H stret aromatic methyl C Surface A tube: 9.53 EDX Spe Fig.4 ydroxyl group tching vibrati
C-H and C-B CH3.
Area Analyz
Adsorptive pr 3 mm and The
ectrum of ob
4A shows the Energy (e/k)
1
ps of silica wh on fee Imines Br alkyl funct
er and Poros
roperties of a e Surface area
tained OPA
area of intere
Fig 4: (A) area
y
98.00
100.00
hich stick it s s, the strong a tional group a
Fig.3: FTIR
simetry system
molecular cr a analysis is as
Tab
est for the EDX
of interest for the
Cumula (m
self to the OPA and weak band
and the mediu
R spectrum of ob
m
ross-sectional s shown in Ta
le 1: Surface Ene
X analysis of r
e EDX analysis, (
ative Area m2/g)
4.401
4.440
A
B
A (Ismail and d at 883.65cm um intensity
btained OPA
area of 0.162 able 1.
ergy
raw OPA whi
(B) EDX image o
Inc
d Shaari, 2009 m-1 and 705.28 1384.92cm-1in
2 nm² and ins
ich is obtained
of obtained OPA
cremental Are (m2/g)
0.000
0.039
9), (Najib, 200 8cm-1 represen ndicate the pr
ide diameter
d as in Fig. 4B ea
07) or the nt isolated resence of
of sample
The EDX spectrum of raw OPA shows that it contained a high weight of potassium about 34.71%, other elemental components include silicon 4.71%, calcium 3.79% and chlorine 7.06%, present in small %weight include phosphorus, aluminum and sulphur, the high %weight of oxygen is an indication that element like Si, Al and Mg exist in their oxide form (see Table 2)
Table 2: Elemental Analysis of Obtained OPA
XRD Image of OPA
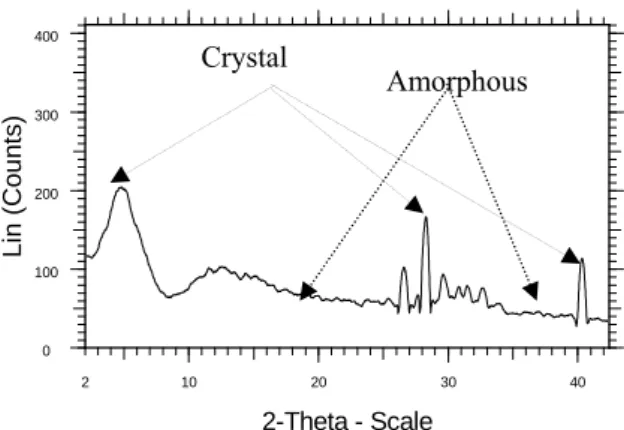
The XRD which is a mechanical means of expressing x ray strength as a function of the angle between the incident and the diffracted beam was used to obtain a diffractogram of OPA with peak indicating the traces of K, Ca, Mg (0.98%) and CO (0.88%), with significant presence of Al (5.1%), Si (12.9%), O (36%). Fig. 5 below shows The existence of significant crystalline peaks at 5o, 28o and 41.5o is indicative of the existence of crystal structure. Amorphous structure exists between 10o–260 and 30o-39o, the area covered by the crystalline peak is indicative of high crystallinity index or degree of crystallinity. The Crystallinity index is calculated as 52.2% using the equation
% (2)
Where Acr is the area covered by the crystalline structure and ATotal is the total area under the graph.
Fig. 5:XRD diffractogram for Opa (2o-41.5o)
Electrical Conductivity Performance of CB
The result shows that electrical conductivity of the nanocomposite depends on the CB nanofiller loading, Fig 5 clearly shows the relation between weight fraction of CB and the electrical conductivity. At low filler loading, the CB nanoparticles are insulated from each other within the matrix resulting in low or no conductivity.
Fig 6: Relationship between CB Filler loading and Conductivity of Nanocomposite
Element O Si Cl K Ca Weight % 46.81 4.71 7.06 34.71 3.79
Li
n (
C
ou
nt
s)
0 100 200 300 400
2-Theta - Scale
2 10 20 30 40
Amorphous Crystal
0 200 400 600 800 1000
0 10 20 30 40
C
onduct
iv
it
y
(S/
m
)
There is a transition from the insulating property of epoxy to a conductive nanocomposite at 14%wt of CB with a conductivity of about 32.25 S/m, further loading increases the conductivity until a percolation threshold is observed at 19-24%wt of CB with maximum conductivity observed at 33%wt of CB. Any further loading does not change the conductivity of the nanocomposite.
CONCLUSIONS
OPA which contains a high content of silicon and oxygen was carbonized to obtain an improved conductive filler with particle size distribution of OPA was reduced from 60µm to about 77.9-140.9nm. The study showed that OPA has good potential to be used as nanofiller for the improvement of material such as a polymer. The conductivity of the composite indicated well dispersed conductive filler with a suitable network of the conductive particle within the epoxy matrix. Though the result showed that a smart material can result from this findings, there is research opportunity to improve the conductivity of the obtained CB from OPA and subsequently the nanocomposite.
ACKNOWLEDGMENTS
This work is supported by the Fundamental Research Grant Scheme (FRGS) FRGS/2/2013/TK04. The authors would, therefore, like to acknowledge the assistance provided by both minister of Education and UniversitiTeknologi PETRONAS Malaysia.
REFERENCES
[1] Abdul Khalil H. P. S., Fizree H. M., Jawaid M. and Omar A. S., (2011) Preparation and Chracterisation of Nanostructured Material from Oil Palm Ash: A Bio Agricultural Waste from Oil Palm Mills, Bio Resources, vol. 6, no. 4, pp. 4537-4546.
[2] Abdul Khalil H. P. S., Jawaid M., Hassan A., Paridah M. T. and Zaidon A., (2012) Oil Palm Biomass Fibres and Recent Advancement in Oil Palm Biomass Fibres Based Hybrid Biocomposites, Intech Open, pp. 187-220.
[3] Abdul Khalil H. P. S., Rus Mahayani A. R., Bhat I.-u.-H., Rudi D., Alnulai M. Z. and Abdullah C. K., (2012), Chracterization of Various Organic Waste Nanofiller obtained from OPA," Bio Resources, vol. 7, no. 4, pp. 5771-5780.
[4] Aldraihem O. J., Aki W. N. and Baz A. M. (2009). Nanocomposite functional paint sensor for vibration and noise monitoring. Elsevier Sensors and actuators A: physical [online] (149) pp. 233-240. Available: http://www.elsevier.com/locate/sna
[5] Blythe, T., & Bloor, D. (2005). Electrical Properties of Polymrt. New York: Cambridge University Press.
[6] Böger L., Wichmann M. H. G., Meyer L. O. and Schulte K., (2008), Load and Health Monitoring in Glass Fibre Reinforced Composites with an Electrically Conductive Nanocomposite Epoxy Matrix, Composites Science and Technology, vol. 68, pp. 1886-1894, 2008.
[7] Cochrane C., Koncar V., Lewandowski M. and Dufour C. (2007). Design and development of a flexible strain sensor for textile structures bases on a conductive polymer composite. Sesors [online] (7) pp. 473-492. Available http://www.mdpi.org/sensors [8] Dong X. M., Fu R. W., Zhang M. Q., Bin Zhang and Rong M. Z., (2004, July), Electrical resistance of carbon black filled amorphous
polymer composite sensors to organic vapors at low vapor concentrations. Elsevier. Carbon [online] (22) pp. 2551-2559. Available: http//www.elsevier.com/ locate/carbon
[9] Guo J. and Lua A. C., (1998), Characterization of Chars Pyrolyzed from Oil Palm Stones for the Preparation of Activated Carbons, Journal of Analytical and Applied Pyrolysis, vol. 46, p. 113–125.
[10] Hashim M. A. and Chu K. H., (2012), Adsorption of Metal Ions on Oil Palm Ash: Application of a Surface Reaction Rate Model.," in 9th Asian Pacific Confederation of Chemical Engineering Congress, Christchurch, New Zealand.
[11] Hawa A., Tonnayopas D. and Prachasaree W., (2013), Performance Evaluation and Microstructure Characterization of Metakaolin-Based Geopolymer Containing Oil Palm Ash, The Sci. World Journal, vol. 2013, pp. 1-9.
[12] Hong J., Park D. W. and Shim S. E., (2010, December). A review on the thermal conductivity of polymer composites using carbon based fillers: Carbon nanotubes and carbon fibres. Carbon letters 11 (4) pp. 347-356
[13] Hornsby P. R., Hinrichsen E. and Tarverdi K. (1997). Preparation and properties of polypropylene composites reinforced with wheat and flax straw fibre. Journal of material science. [online] (32) pp. 443-449. Available: http://www.downloa.spriger.com/static/pdf/282/art%/253A10.1023%252fa%253A1018521920738.pdf?auth66=1412131924_851dd9c 15d5a99e39ac7cde29de8ca0&ext-.pdf
[14] Ibrahim M. S., Sapuan S. M. and Faieza A. A., (2012), Mechanical and Thermal Properties of Composites From Unsaturated Polyester Filled with Oil Palm Ash," Journal of Mechanical Engineering and Sciences (JMES), vol. 2, pp. 133-147.
[15] Ismail H. and Shaari S. M., (2009), Curing Chracteristics, Tensile properties and morphology of Oil Palm Ash/Halloysite Nanotubes/Ethylene-Propylene-diene manomer (EPDM) Hybrid Composite," Renew Sustain Energy Review, vol. 13, pp. 2495-2504. [16] Jarurapitakkul C., Kiattikomol k., Tangchiraput W. and Saeting T., (2007), Evaluation of The Sulphate Resistance of Concrete
Containing Palm Oil Ash, constr. build. Mater, vol. 21, pp. 1399-1405.
[17] Kochetov R., (2012) Thermal and Electrical behavior of nanocomposites, Including Material Processing. Ph.D. dissertation, Delft: Elect. Engg. Dept., Tcchnische Universiteit Delft., wohrmann print service Zutphen, the Netherlands.
[18] Najib N., (2007) Thermoplastic Elastomr composites of Palm Ash Fillled Ethylene Vinyl Acetate/Natural Rubber (EVA/NR) Blends," unpublished MSC thesis Universiti Sans Malaya.
[19] Ooi X. Z., Ismail H., Abu Bakar A. and Teoh Y. P., (2014) A Review on Recycling Ash Derived from Elaeis Guineensis by Product, Bio Resources, vol. 9, no. 4, pp. 7926-7940.
[20] Ooi X. Z., Ismail H. and Teoh Y. P., (2015), Interaction Between 3-Aminopropyltrimethoxysilane and Oil Palm Ash in Styrene Butadiene Rubber Compounds using Response Surface Methodology, Polymer Testing, vol. 43, pp. 131-138.
[21] Palm NRJ, "Palm NRJ," Palm NRJ, 2011. [Online]. Available:www.palmnrj.com/palm_bunch_ash.html. [Accessed 12 April 2015]. [22] Pham G. T., Park Y., Liang Z., Zhang C and Wang B,. (March, 2007). Processing and modelling of conductive thermoplastic/carbon
nanotube films for strain sensing. Elsevier Composites [online] part B (39) pp. 209-216. Available: http//www.elsevier.com/locate/compostesb
[23] Sandler J. K., Kirk J. E., Kinloch I. A., Shaffer M. S. P. and Windle A. H., (2003), Ultra-Low Electrical Percolation Threshold in Carbon-nanotube Epoxy Composites, Polymer, vol. 44, pp. 5893-5899.
[25] Sasthiryar S., Abdul Khalil H. P. S., Bhat A. H., Ahmad Z. A., Islam M. N., Zaidon A. and Dungani R., (2014), Nanobioceramic Composites: A Study of Mechanical Morphological, and Thermal Properties, Bio Resources, vol. 9, no. 1, pp. 861-871, 2014. [26] Sheetz T., Vidal J., Pearson T. D., and Lozano K.., (2005) "Nanotechnology: Awareness and societal concerns," Elsevier. Technology
in Society. [Online]. (27), vol. 27, pp. 329-345.
[27] Supova M., Martynkova G. S. and Barabaszova K. (2011). Effect of Nanofillers dispersion in polymer matrices: A review. ASP science of advanced materials (3) pp. 1-25
[28] Tay J. H. and Show K. Y., (1995), Use of Ash Derived from Oil Palm Waste Incineration as a Cement Replacement Material., Resources Conservation and Recycling, vol. 13, no. 1, pp. 27-36.
[29] Udoetok A. I., (2012) Characterization of Ash Made from Oil Palm Empty Fruit Bunches (OEFB), International Journal of Environmental Sciences, vol. 3, no. 1, pp. 518-524.