ISSN 0104-6632 Printed in Brazil
www.abeq.org.br/bjche
Vol. 27, No. 02, pp. 289 - 298, April - June, 2010
Brazilian Journal
of Chemical
Engineering
ADSORPTION OF TURQUOISE BLUE QG
REACTIVE DYE ON COMMERCIAL ACTIVATED
CARBON IN BATCH REACTOR: KINETIC
AND EQUILIBRIUM STUDIES
D. Schimmel
1, K. C. Fagnani
1, J. B. Oliveira dos Santos
1,
M. A. S. D. Barros
2and E. Antonio da Silva
1*1
Western State University of Paraná, Rua da Faculdade 645, Phone: + (55) (45)33797039, Fax: + (55) (45) 3379-7002, 85903-000, Toledo - PR, Brazil.
E-mail: [email protected] ; [email protected] 2
Departament of Chemical Engineering, State University of Maringá, Av. Colombo 5790, Bloco D-90, 87020-900, Maringá - PR, Brazil.
(Submitted: August 11, 2009 ; Revised: December 14, 2009 ; Accepted: December 22, 2009)
Abstract - The adsorption of reactive turquoise blue QG dye on commercial activated carbon was investigated in a batch reactor to obtain isotherm and kinetic data under different experimental conditions.
The adsorbent was characterized by a FTIR method to analyze surface area and pHPZC and to identify
functional groups. Experiments were conducted to obtain equilibrium data at 30°C, with the pH effect being assayed in the range of 2 to 8. Experiments were then carried out under the optimal pH condition for dye removal to obtain equilibrium data at 30°C, 45°C and 60°C. Adsorption isotherm models were used to correlate the equilibrium data. Maximum dye removal capacity was observed at a pH of 2 and temperature of 30°C. The kinetic experiments were carried out at a pH of 2 and at three different temperatures: 30°C, 45°C and 60°C. Pseudo-second-order models were used to describe the kinetics of dye adsorption.
Keywords: Reactive dye; Activated carbon; Adsorption; Isotherm; Kinetics; Enthalpy of adsorption.
INTRODUCTION
The textile industries stand out among the industries that produce effluents with high pollution loads (Al-Deggs et al., 2008; Annadurai et al., 2008). In addition, the environmental impact of laundry effluents is particularly severe, given that certain dyes are not discharged when not set or degraded by conventional treatment processes (Al-Deggs et al., 2008). Among these dyes, turquoise blue QG, a well-known reactive dye, is widely used in the Brazilian textile industry. The resulting textile wastewater is of a deep blue color that affects water quality by inhibiting the penetration of sunlight and thus reducing photosynthetic activity (Rodríguez et al., 2009; Lambrecht et al., 2007).
Considering that the aesthetic effect (color) of dyes in water is visible in concentrations as low as 1 mg/L (O’Mahony et al., 2002), their presence is unacceptable. It is therefore extremely important to treat such effluents prior to discharge.
Activated carbon adsorption processes are often used for this purpose due to their versatility, efficiency and low operating costs (Matta et al., 2008; Lambrecht et al., 2007). Owing to its structural characteristics, specifically its large surface area and high pore distribution, activated carbon is a highly efficient adsorbent (Bangash and Alam, 2009).
or as primary treatments to reduce the color of effluents through low-cost investments (Melo, 2007).
The study of adsorption kinetics describes the rate of uptake of the adsorbate molecules onto adsorbent, which determines the residence time required for design of batch adsorption systems. This rate depends on the physicochemical characteristics of the adsorbate (nature, molecular weight, solubility, etc.), of the adsorbent (nature, pore structure) and of the solution (pH, temperature and concentration).
The main factors affecting adsorption are: temperature, solvent polarity, agitation speed, solid/liquid ratio, particle size, initial adsorbate concentration, solution pH, presence of other competitive species, and impurities on the adsorbent surface.
In design and optimization of adsorption process, the first step is the selection of adsorbent, a decision based on experimental equilibrium data or on isotherm models for the system of interest.
The application of an adsorption operation to remove reactive turquoise blue QG dye with commercial activated carbon therefore required detailed information on kinetics and equilibrium isotherms, as well as mathematical modeling. In the present study, experiments were carried out in a batch reactor to obtain equilibrium and kinetic data for dye adsorption onto commercial coal. The effects of pH and temperature on the adsorption equilibrium were evaluated. The equilibrium data were described using various adsorption isotherm models. The kinetic data were fit to pseudo-first-order and pseudo-second-order models.
EXPERIMENTAL
Adsorbate and Adsorbent
The commercial activated carbon used in the experiments, produced from Pinus trees, was supplied by Alphacarbon Industrial S.A (Guarapuava - PR - Brazil). The solutions were prepared by dissolving reactive turquoise blue QG dye from Texpal Chemical Industry S/A (Brazil) in distilled water.
Characterization of the Adsorbent
The following parameters were analyzed: surface area, pore size and point of zero charge (pHPZC).
Surface area and pore size distribution were determined by standard N2 adsorption methods (Nova
1200 surface area and pore analyzer, Quantachrome). The pHPZC of the adsorbent was measured by using
the pH drift method described by Lopez-Ramon et al.
(1999). Fourier Transform Infrared Spectroscopy (FTIR) was used to identify the functional groups present in the activated carbon. The latter analysis was carried out at LAFLURPE - the Fluorescence and Electronic Paramagnetic Resonance Laboratory of the State University of Londrina.
Analysis of the Liquid Samples
The dye concentration in the samples was measured by ultraviolet spectroscopy (UV/Vis) in the visible range, using Spectro Vision UV- SB-1810-S equipment. The wavelength corresponding to maximum absorbance was 610 nm. In accordance with the Lambert-Beer law, absorbance was found to vary linearly with dye concentration in the range of 10 mg/L to 100 mg/L.
Kinetic Studies
The kinetics of dye adsorption on commercial activated carbon was investigated through experiments carried out in a water bath shaker maintained at 30oC. The initial concentration of the solution was 500 mg/L. The pH was kept at 2 by using 0.1 M HCl and 0.1 M NaOH solutions. For these experiments, 1000 mL of dye solution and 6 g of commercial activated carbon were introduced into Erlenmeyer flasks. At predetermined time intervals, 2 mL samples were taken from the flasks and analyzed by spectrophotometry.
Batch Equilibrium Studies
Adsorption equilibrium experiments were carried out by contacting different initial solutions of dye with a given amount of activated carbon using a thermostatic bath at different temperatures (30°C, 45°C, and 60°C), holding the pH constant at 2, and at different pH values (2 to 8), holding the temperature constant at 30°C.
In Erlenmeyer flasks, 0.3 g of commercial activated carbon was added to 50 mL of dye solution at initial concentrations ranging from 150 mg/L to 1000 mg/L. For pH control, 0.1 M HCl and 0.1 M NaOH solutions were used. After 2 days, the liquid phase was separated from the adsorbent using 0.45 μm Millipore Membranes. The initial and equilibrium dye concentrations in each flask were determined by spectrophotometry. The assays were carried out in duplicate.
The equilibrium amount of dye adsorbed per unit mass of adsorbent (qeq) was calculated using Eq. (1),
Adsorption of Turquoise Blue QG Reactive Dye on Commercial Activated Carbon in Batch Reactor 291
concentrations in the solution, respectively; V is the volume of solution in the Erlenmeyer flask; and ms is
the dry weight of the adsorbent.
0
eq eq
s V
q (C C )
m
= − (1)
RESULTS AND DISCUSSION
Characterization of the Adsorbent
The functional groups and pHPZC of the surface of
an adsorbent are important because they indicate the acidity/basicity of the adsorbent and the net surface charge of the carbon in solution, respectively (Al-Degs et al., 2008).
To determine the pHPZC, the pH drift method was
used. The experimental results are shown in Figure 1. The pHPZC is the point where the curve of pHfinal vs
pHinitial intersects the line pHinitial = pHfinal, with the
value for the activated carbon being 8.0. When the solution pH was lower than pHPZC, dye removal was
relatively high, possibly due to the presence of more positive charges on the carbon surface (Senthilkumaar et al., 2006).
4 6 8 10 12
4 6 8 10 12
pH
final
pHinitial
Figure 1: Point of zero charge (pHPZC) of the
activated carbon, determined by the pH drift method
Nitrogen adsorption isotherms were used to determine the surface area and the average pore diameter of the adsorbent. The results obtained are presented in Table 1. The specific surface area was computed by the BET method and the average diameter of the pores according to the BJH method (Gregg and Sing, 1982). The surface area of the adsorbents was within the range typical of activated carbons (100 m2g-1 to 1000 m2g-1) (Ruthven, 1984).
Those with pore diameters from 20 Å to 500 Å were classified as mesoporous (Gregg and Sing, 1982).
Table 1: Activated carbon characteristics.
BET Surface area
BJH
Adsorption average pore diameter
618.7 m2g-1 22.31 Å
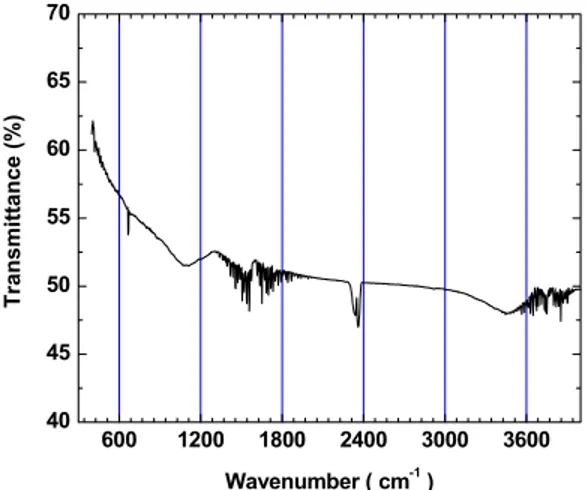
FTIR spectroscopy in the range of 800 cm-1 to 4000 cm-1 was used to identify the functional groups on the activated carbon surface. The results are presented in Figure 2 and reveal the presence of hydroxyl bands at around 3600 cm-1. Some of the other bands detected can be ascribed to aldehydes (1500 cm-1), ketones (1700 cm1) and N-O groups (1350 cm-1 to 1500 cm-1). Those between 2250 cm-1 and 2400 cm-1 refer to the C=O bond (aldehydes, ketones and carboxylic acids). Band overlapping can be observed in the activated carbon spectrum from 1300 cm-1 to 1900 cm-1 and from 3500 cm-1 to 4000 cm-1.
600 1200 1800 2400 3000 3600
40 45 50 55 60 65 70
T
ransmittance (%)
Wavenumber ( cm-1 )
Figure 2: FTIR spectrum of the activated carbon
Kinetic Modeling
The studies of adsorption kinetics are fundamental for the design and optimization of batch reactor processes for removal of dye from industrial effluents. Various models have been proposed to describe and clarify pollutant adsorption mechanisms (Annadurai et al., 2008; Tekbaş et al., 2009). As a rule, models based on the apparent reaction order of adsorption (pseudo-first-order and pseudo-second-(pseudo-first-order models) are used to describe the kinetics of the sorption of dyes onto sorbents (Janoš et al., 2007).
models, as represented by Eq. (2) and Eq. (3), respectively, were therefore used to investigate transient behavior during the batch reactor adsorption of the dye.
1
k t eq
q(t)=q (1 e− − ) (2)
eq 2 eq
eq 2
q k t
q(t) q
q k t 1
=
+ (3)
In these equations, qeqand q(t) are the amounts of dye adsorbed per unit mass of adsorbent at equilibrium and at time t, respectively; k is the 1 first-order kinetic constant; and k is the second-2 order kinetic constant. The parameters of the kinetic models k and 1 k2 were estimated from the experimental data by applying the golden search method. The objective function is given by the following equation:
n
EXP MOD 2
obj j j
j 1
F (q(t ) q(t ) )
=
=
∑
− (4)where q(t )j EXP and q(t )j MOD are respectively the experimentally determined and the model calculated amounts of dye adsorbed per unit mass of adsorbent at time t and j n is the number of experimental data.
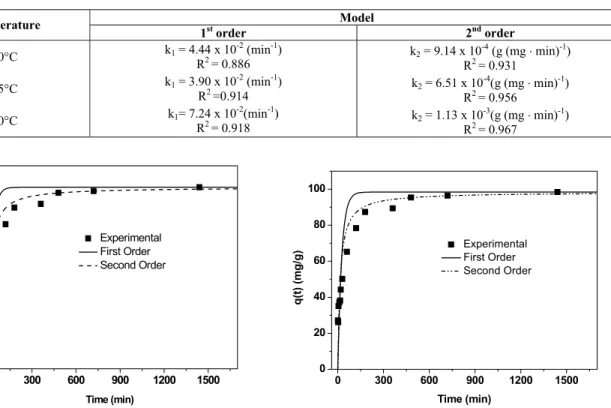
The estimated parameters of the kinetic models and the coefficients of determination are presented in Table 2. The pseudo-second-order model best described the batch reactor dye removal data, yielding high coefficients of determination.
The rate of dye adsorption is affected by temperature, pH, concentration of salts, initial concentration of dye, agitation, size of adsorbate molecules, distribution of pore size, and variability of the effluent (Sun and Xu, 1997).
Figures 3 to 5 present the experimental data on the kinetics of dye adsorption on activated carbon, as well as the curves simulated by the models for three different temperatures. It can be observed that the system attained equilibrium after 30 hours. As the system approached equilibrium, the rate of the dye adsorption on the activated carbon diminished. This was due to the fact that there are many vacant sites at the beginning of the process, but the number available decreases over time and repulsion effects hinder further adsorption.
Table 2: Kinetic parameters and coefficients of determination
Model Temperature
1st order 2nd order
30°C k1 = 4.44 x 10
-2 (min-1) R2 = 0.886
k2 = 9.14 x 10⁻⁴ (g (mg . min)-1) R2 = 0.931
45°C k1 = 3.90 x 10
-2 (min-1) R2 =0.914
k2 = 6.51 x 10⁻⁴(g (mg . min)-1) R2 = 0.956
60°C k1= 7.24 x 10
-2 (min-1) R2 = 0.918
k2 = 1.13 x 10⁻³(g (mg . min)-1) R2 = 0.967
0 300 600 900 1200 1500
0 20 40 60 80 100
q
(t)
(m
g
/g
)
Time (min) Experimental First Order Second Order
0 300 600 900 1200 1500
0 20 40 60 80 100
q(t) (mg/
g)
Time (min)
Experimental First Order Second Order
Figure 3: Adsorption kinetics of dye adsorption on activated carbon: Model curves and experimental data obtained at 30°C.
Adsorption of Turquoise Blue QG Reactive Dye on Commercial Activated Carbon in Batch Reactor 293
0 300 600 900 1200 1500
0 20 40 60 80 100 120
q(
t) (mg/
g)
Time (min)
Experimental First Order Second Order
Figure 5: Adsorption kinetics of dye adsorption on activated carbon: Model curves and experimental data obtained at 60°C.
Batch Equilibrium Studies – Effect of pH on Adsorption
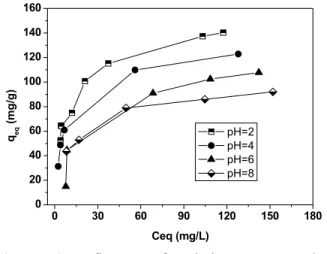
The effect of pH on the equilibrium adsorption of reactive turquoise blue QG dye on activated carbon was evaluated at a fixed temperature of 30°C for pH values of 2, 4, 6 and 8. The highest dye removal efficiency was attained at pH 2, as shown in Figure 6. The pH of a solution affects the surface charge of the adsorbent and the ionization of the solutes. Changes in pH affect the adsorption process by dissociating the functional groups at the active sites of the adsorbent.
0 30 60 90 120 150 180
0 20 40 60 80 100 120 140 160
qeq
(
m
g/g)
Ceq (mg/L)
pH=2 pH=4 pH=6 pH=8
Figure 6: Influence of solution pH on the equilibrium dye adsorption
The adsorption of anionic and cationic species onto a surface can be explained by the competitive adsorption of H+ and OH- ions (Huang and Stumm, 1973). As already mentioned, in the present study, the pHPZC value for the activated carbon was 8.0.
This means that there were positively charged ions
on the carbon surface. Given that reactive turquoise blue QG dye generates negatively charged ions when dissolved in aqueous media, it can therefore be concluded that the rate of adsorption of such a dye is higher in acidic media. While low pH values reduce the amount of OH -and favor the adsorption of the anionic species, high pH values reduce the concentration of H+ and favor the cationic species.
Modeling of Adsorption Equilibrium Data
The design and application of effluent treatment processes based on separation by adsorption depend on the dye removal capacities of the adsorbents employed. The performance of an adsorbent is evaluated using adsorption isotherms. As a rule, equilibrium data on dye adsorption are obtained from batch studies, which can be represented by isotherm models such as those developed by Langmuir, Freundlich, Redlich-Peterson and Radke-Prausnitz. These models provide useful information on the adsorption process (Özacar and Sengil, 2005; Tan et al., 2007; Qiao et al., 2009).
The Langmuir isotherm is represented by Eq. (5). This model assumes that the sites are homogeneously distributed on the surface of the adsorbent and that there is no interaction among the molecules adsorbed. The mathematical representation of this model has two adjustable parameters:qmax, the maximum adsorption capacity, and b, a constant related to the affinity between adsorbent and adsorbate.
max eq eq
eq
q bC
q
1 bC =
The Freundlich isotherm is described by Eq. (6), in which the adjustable parameters are K andn . Instead F of predicting the surface saturation of an adsorbent, this model assumes that surface energies are heterogeneous and that the adsorption energy varies as a function of surface coverage due to variations in adsorption temperature (Singh et al., 2008).
F
n
eq eq
q =KC (6)
The Radke-Prausnitz isotherm is represented by Eq. (7) and has three adjustable parameters: aRP, bRP and
RP
n . At high concentrations, this isotherm becomes the Freundlich isotherm; when nRP=0, it yields the Langmuir isotherm (Radke and Prausnitz, 1972).
RP nRP 1
n RP RP eq eq
RP RP eq
a b C
q
a b C −
=
+ (7)
The Redlich-Peterson isotherm is represented by Eq. (8), with the adjustable parameters being KRP,
RP
β and n . This model approaches the Freundlich model at high concentrations and is in accordance with the low concentration limit of the Langmuir equation (Mall et al., 2006).
RP eq eq n RP eq K C q 1 C =
+ β (8)
The parameters of the isotherm models were
estimated by applying the downhill Simplex optimization method (Nelder and Mead, 1965) to the experimental data. The objective function used in this method is given by Eq. (9), where qeqEXP and qMODeq are, respectively, the experimentally determined and the model calculated equilibrium amounts of dye adsorbed per unit mass of adsorbent and n is the number of experimental data.
n
EXP MOD 2
obj eq eq
j 1
F (q q )
=
=
∑
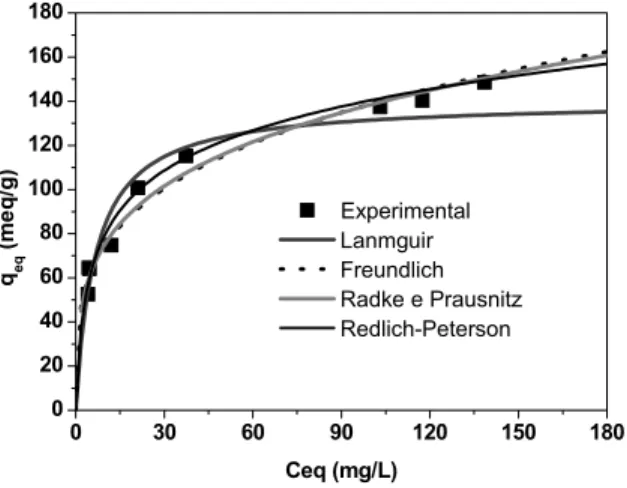
− (9)The estimated parameters of the isotherm models and the coefficients of determination for the levels of pH are reported in Table 3. The equilibrium data are best described by the Redlich-Peterson and Radke-Prausnitz isotherm models, both of which yield high coefficients of determination.
Figures 7 to 10 show the experimental equilibrium data and the curves simulated by the isotherm models for the solution pH values analyzed (2, 3, 4 and 8). It can be seen that the activated carbon adsorbed high amounts of dye, even when the equilibrium concentrations of the dye in solution were low. This indicates high affinity between the dye molecules and the surface of the adsorbent. The isotherms reached maximum adsorption capacity at higher concentrations, thus being of the type generally associated with the adsorption of ionic species in solution (e.g., metallic ions and ionic dyes), which compete with the solvent molecules to only a limited degree (Al-Degs et al., 2008).
Table 3: Parameters of the isotherm models with variable pH
MODELS
pH Langmuir Freundlich Redlich-Peterson Radke-Prausnitz
2
max
q =140.14 mg g-1 b = 0.151 L mg-1
R2= 0.94
K = 40.33 mg g-1
F
n = 0.268 R2=0.97
RP
K = 53.89
RP
β = 0.922 n = 0.808 R2=0.98
RP
a = 195.47
RP
b = 44.37
RP
n = 0.248 R2= 0.98
4
max
q =102.703 mg g-1 b = 0.1984 L mg-1
R2= 0.83
K =31.63 mg g-1
F
n =0.227 R2=0.95
RP
K = 48.51
RP
β = 1.03 L n = 0.846 R2= 0.95
RP
a = 55.81
RP
b = 44.71
RP n = 0.16
R2= 0.95
6
max
q = 111.07 mg g-1 b = 0.098 L mg-1
R2= 0.91
K = 33.38 mg g-1
F
n = 0.213 R2= 0.81
RP
K = 11.11
RP
β = 0.102 L
n = 0.997 R2= 0.91
RP
a = 11.82
RP
b = 98.03
RP
n = 0.023 R2= 0.92
8
max
q = 110.32 mg g-1 b = 0.057 L mg-1
R2= 0.86
K = 24.96 mg g-1
F
n = 0.261 R2= 0.99
RP
K = 44.31
RP
β = 1.58 n = 0.757 R2= 0.99
RP
a = 182.36
RP
b = 25.86
RP
Adsorption of Turquoise Blue QG Reactive Dye on Commercial Activated Carbon in Batch Reactor 295
0 30 60 90 120 150 180
0 20 40 60 80 100 120 140 160 180
qeq
(me
q
/g
)
Ceq (mg/L)
Experimental Lanmguir Freundlich Radke e Prausnitz Redlich-Peterson
0 30 60 90 120 150 180 210 240
0 20 40 60 80 100 120 140
qeq
(m
eq
/g)
Ceq (mg/L)
Experimental Lanmguir Freundlich Radke e Prausnitz Redlich-Peterson
Figure 7: Experimental data and isotherm models at pH = 2 and T = 30°C
Figure 8: Experimental data and isotherm models at pH = 4 and T = 30°C
0 100 200 300 400
0 20 40 60 80 100 120 140
qeq
(m
e
q
/g)
Ceq (mg/L)
Experimental Lanmguir Freundlich Radke e Prausnitz Redlich-Peterson
0 100 200 300 400 500
0 20 40 60 80 100 120 140
qeq
(m
e
q
/g
)
Ceq (mg/L)
Experimental Lanmguir Freundlich Radke e Prausnitz Redlich-Peterson
Figure 9: Experimental data and isotherm models at pH = 6 and T = 30°C
Figure 10: Experimental data and isotherm models at pH = 8 and T = 30°C
Batch Equilibrium Studies – Effect of Temperature on Adsorption
The effect of temperature on the equilibrium adsorption of reactive turquoise blue QG dye was evaluated at a fixed pH of 2 and at three temperatures: 30°C, 45°C and 60°C. The results presented in Figure 11 show that the higher the temperature, the lower the dye removal capacity.
Temperature usually has two main effects on dye adsorption onto activated carbon. Higher temperatures accelerate the rate of diffusion of the dye molecules from the surface to the internal pores of the adsorbent. In addition, temperature changes alter the equilibrium between the adsorbent and the adsorbate. While higher temperatures result in higher adsorption in endothermic processes, lower
temperatures lead to higher adsorption in exothermic processes.
The Langmuir, Freundlich, Radke-Prausnitz, and Redlich-Peterson isotherm models were fit to the equilibrium data on dye adsorption. The results are shown in Table 4. The Radke-Prausnitz model best represented the equilibrium data for the turquoise blue QG reactive dye, with coefficients of determination in the range of 0.93 to 0.99 for the temperatures assayed.
Figures (7), (12) and (13) show that the isotherm models satisfactorily fit the experimental equilibrium data for all three temperatures.
described the equilibrium data were the Radke-Prausnitz and the Redlich-Peterson, which presented R2 values closer to one.
The Henry constant (KH) was calculated by the
following equation:
eq
eq H
C 0 eq
q
K lim
C
→
= (10)
In the Redlich-Peterson isotherm model, the Henry constant is given byKH=KRP. The apparent enthalpy of adsorption HΔ can be calculated by Eq. (11) (Moreira et al., 2007), where R is the universal gas constant (8.314 x10⁻³ kJ/(mol . K)) and T is the absolute temperature in K.
H 0
H
K K exp
RT Δ
⎛ ⎞
= ⎜ ⎟
⎝ ⎠ (11)
Thus, the apparent enthalpy of adsorption was determined from a plot of lnKH versus 1/T in the
temperature range of 30°C to 60°C. This plot is shown in Figure 14. The enthalpy value was -45.30 kJ/mol. The negative value for HΔ indicates that the adsorption process is exothermic, as is typical of cases in which there is only physical adsorption (Dabrowski, 2001). In contrast, chemisorption processes can be either endothermic or exothermic (Hill, 1977). When the adsorption process is exothermic, dye removal by the adsorbent increases as temperature decreases (Abramian and El-Rassy, 2009).
0 40 80 120 160
20 40 60 80 100 120 140 160
qeq
(mg/
g
)
Ceq (mg/L) T=30o
C T=45o
C T=60oC
Figure 11: Influence of temperature on the equilibrium dye adsorption
Table 4: Parameters of the isotherm models with variable temperature
Models Temp.
Langmuir Freundlich Redlich-Peterson Radke-Prausnitz
30°C qmax=142.84 (mg g-1) b = 0.146 (L mg-1)
R2= 0.93
K = 40.33 (mg g-1)
F
n = 0.273 R2=0.93
RP
K = 41.01
RP
β = 0.605 n = 0.834 R2=0.96
RP
a =196.45
RP
b = 44.41
RP
n = 0.253 R2=0.94
45°C qmax= 118.73 (mg g-1) b = 0.215 (L mg-1)
R2= 0.97
K =34.89 (mg g-1)
F
n = 0.267 R2=0.96
RP
K = 25.87
RP
β = 0.230 n = 0.983 R2= 0.98
RP
a =45.42
RP
b = 60.42
RP
n = 0.151 R2= 0.99
60°C qmax=87.26 (mg g-1) b = 0.091 (L mg-1)
R2= 0.81
K =24.81 (mg g-1)
F
n = 0.263 R2= 0.93
RP
K = 8.00
RP
β = 0.094 n = 0.990 R2= 0.82
RP
a = 94.84
RP
b = 26.76
RP
Adsorption of Turquoise Blue QG Reactive Dye on Commercial Activated Carbon in Batch Reactor 297
0 50 100 150 200 250
0 20 40 60 80 100 120 140
qeq
(m
e
q
/g
)
Ceq (mg/L)
Experimental Langmuir Freundlich Radke e Prausnitz Redlich-Peterson
0 50 100 150 200 250
0 20 40 60 80 100 120
qeq
(m
eq
/g)
Ceq (mg/L)
Experimental Langmuir Freundlich Radke e Prausnitz Redlich-Peterson
Figure 12: Experimental data and isotherm models at pH = 2 and T = 45°C
Figure 13: Experimental data and isotherm models at pH = 2 and T = 60°C.
1/T x 103(K-1)
3.00 3.05 3.10 3.15 3.20 3.25 3.30 2.0
2.4 2.8 3.2 3.6
In K
H
1/T x 103(K-1)
3.00 3.05 3.10 3.15 3.20 3.25 3.30 2.0
2.4 2.8 3.2 3.6
2.0 2.4 2.8 3.2 3.6
In K
H
Figure 14: Plot of lnKH versus 1/T.
CONCLUSIONS
The activated carbon used as the adsorbent for the reactive turquoise blue QG dye had a surface area of 618.7 m2/g and a point of zero charge (pHPZC) of 8.0.
Two models were applied to describe the kinetics of dye adsorption. The best fit for the kinetic data was obtained with the pseudo-second-order model. The adsorption of the dye on the activated carbon increased as the temperature decreased and the pH decreased. Several isotherm models were applied to the experimental equilibrium data, with the Redlich-Peterson and Radke-Prausnitz models giving the best fits. The negative value obtained for the apparent enthalpy of adsorption revealed that the process was exothermic and that the main mechanism was physisorption. Activated carbon proved to be
effective for dye removal, thus having strong potential for application in the treatment of effluents.
REFERENCES
Abramian, L. and El-Rassy H., Adsorption kinetics and thermodynamic porous titania aerogel. Chemical Engineering Journal, 150, 403 (2009). Al-Degs, Y. S., El-Barghouthi, M. I., El-Sheikh, A.
H. and Walke, G. M., Effect of solution pH, ionic strength, and temperature on adsorption behavior of reactive dyes on activated carbon. Dyes and Pigments, 77, 16 (2008).
analysis. Journal of Hazardous Materials, 152, 337 (2008).
Bangash, F. K. and Alam, S., Adsorption of acid blue 1 on activated carbon produced from the wood of Ailanthus altissima. Brazilian Journal of Chemical Engineering, 26, 275 (2009).
Dabrowski, A., Adsorption from theory to practice. Advances in Colloid and Interface Science, 93, 135 (2001).
Gregg, S. and Sing, K., Adsorption, Surface Area and Porosity. Academic Press, New York (1982). Hill, C. G., An Introduction to Chemical Engineering
Kinetics and Reactor Design. John Wiley & Sons, New York (1977).
Huang, C-P. and Stumm, W., Specific adsorption of cations on hydrous γ -Al2-O3. Journal of Colloid and Interface Science, 43, 409 (1973).
Janoš, P., Michálek, P. and Turek, L., Sorption of ionic dyes onto untreated low-rank coal-oxihumolite: a kinetic study. Dyes and Pigments, 74, 363 (2007).
Lambrecht, R., Barros, M. A. S. D., Cossich, E. S., Silva, E. A., Matta, G. K. L. and Stachiw, R., Adsorption of Reactive Blue 5G dye by activated carbon and pyrolyzed shale oil residue. Adsorption Science & Technology, 25, 741 (2007).
Lopez-Ramon, M. V., Stoeckli, F., Moreno-Castilla, C. and Carrasco-Marin, F., On the characterization of acidic and basic surface sites on carbons by various techniques. Carbon, 37, 1215 (1999).
Mall, I. D., Srivastava, V. C. and Agarwal, N. K., Removal of Orange-G and Methyl Violet dyes by adsorption onto bagasse fly ash: kinetic study and equilibrium isotherm analyses. Dyes and Pigments, 69, 210 (2006).
Matta, G. K. L., Barros, M. A. S. D., Lambrecht, R., Silva, E. A., and Motta-Lima, O. C., Dynamic isotherms of dye in activated carbon. Materials Research, 11, 365 (2008).
Melo, C., Color removal from textile dyeing effluent in fixed bed column. MS thesis (In Portuguese), Faculty of Chemical Engineering, Campinas State University, Brazil (2007).
Moreira, R. F. P. M., Soares, J. L., José, H. J. and Rodrigues, A. E., The removal of reactive dyes using high-ash char. Brazilian Journal of Chemical Engineering, 18, 327 (2001).
Nelder, J. A., and Mead, R., A simplex method for function minimization. Computer Journal, 7, 308 (1965).
Noroozi, B., Sorial, G. A., Bahrami, H. and Arami, M., Adsorption of binary mixtures of cationic dyes. Dyes and Pigments, 76, 784 (2008).
O’Mahony, T., Guibal, E. and Tobin, J. M., Reactive dye biosorption by Rhizopus arrhizus biomass. Enzyme and Microbial Technology, 31, 456 (2002).
Özacar, M. and Sengil, I. A., Adsorption of metal complex dyes from aqueous solutions by pine sawdust. Bioresource Technology, 96, 791 (2005).
Qiao, S., Hu, Q., Haghseresht, F., Hu, X. and Lu, G. Q., An investigation on the adsorption of acid dyes on bentonite based composite adsorbent. Separation and Purification Technology, 67 218, (2009).
Radke, C. J. and Prausnitz, J. M., Adsorption of organic solutes from dilute aqueous solution on activated carbon. Industrial & Engineering Chemistry Fundamentals, 11, 445 (1972).
Rodríguez, A., García, J., Ovejero, G. and María Mestanza., Adsorption of anionic and cationic dyes on activated carbon from aqueous solutions: Equilibrium and kinetics. Journal of Hazardous Materials, 172, 1311 (2009).
Ruthven, D. M., Principles of Adsorption and Desorption Processes. John Wiley & Sons, New York (1984).
Senthilkumaar, S., Kalaamani, P., Porkodi, K., Varadarajan, P. R. and Subburaam, C. V., Adsorption of dissolved reactive red dye from aqueous phase onto activated carbon prepared from agricultural waste. Bioresource Technology, 97, 1618 (2006).
Singh, K. P., Malik, A., Sinha, S., and Ojha, P., Liquid-phase adsorption of phenols using activated carbons derived from agricultural waste material. Journal of Hazardous Materials, 150, 626 (2008).
Sun, G. and Xu, X., Sunflower stalks as adsorbents for color removal from textile wastewater. Industrial and Engineering Chemical Research, 36, 808 (1997).
Tan, I. A. W., Hameed, B. H. and Ahmad, A. L., Equilibrium and kinetic studies on basic dye adsorption by oil palm fibre activated carbon. Chemical Engineering Journal, 127, 111 (2007). Tekbaş, M., Bektaş, N. and Yatmaz, H. C.,