ISSN 0104-6632 Printed in Brazil
www.abeq.org.br/bjche
Vol. 22, No. 02, pp. 233 - 238, April - June, 2005
Brazilian Journal
of Chemical
Engineering
MODELLING THE DRYING OF A
PARALLELEPIPEDIC OIL
SHALE PARTICLE
P. S. S. Porto
1and A. C. L. Lisbôa
2School of Chemical Engineering, State University of Campinas, 13083-970 – Campinas, SP, Brazil.
E-mail: [email protected] E-mail: [email protected]
(Received: October 20, 2004 ; Accepted: February 12, 2005)
Abstract - A numerical model is proposed to describe the process of drying a parallelepipedic oil shale
particle. Assuming Fick's law, the diffusion equation for the shape of the particle was used. The objective of the study was to develop a computer program in Fortran to estimate the moisture content of an oil shale particle undergoing drying as a function of time and position. The average moisture content was also obtained. The model takes into account the migration of water by diffusion within the solid and its loss at the interface. The model results were compared to experimental data from an apparatus which measured the mass loss of a particle. The apparatus comprised an electronic balance attached by a thin wire to the particle placed inside an incubator.
Keywords: Oil shale; Drying; Mathematical modelling.
INTRODUCTION
Oil shale is a sedimentary rock that contains organic matter scattered throughout a mineral matrix. Thermal decomposition, also known as retorting, pyrolysis or devolatilization, converts the solid organic material of the shale into liquid and gaseous fractions and a solid carbonaceous residue. Oil shale moisture consumes the available heat for pyrolysis. Little is known about the kinetics of moisture removal from oil shale.
The particles used were obtained from the Petrosix process feedstock. Petrosix is the retorting process developed by Petrobras, a Brazilian oil company, which has been operating for almost fifteen years. The retorting process particles, which measure between 1.2 cm and 7.5 cm, have an approximately parallelepipedic shape. This work complements previous work on modelling the pyrolysis of Petrosix particles by Lovo Jr. (2003),
which also addressed parallelepipedic particles. In their work on Petrosix, Rajagopal et al. (1986) concluded that “the thermodynamic efficiency of the retort and the overall process will be improved by predrying and/or preheating the shale rock”.
The aim of this work was to develop a three-dimensional numerical model to estimate the moisture content of an oil shale particle undergoing drying as function of time and position and the average moisture content of the particle.
MODEL DEVELOPMENT
The mathematical model is based on the diffusional model. A three-dimensional model is proposed to describe the drying of parallelepipedic oil shale particles. The model is based on the following assumptions:
§ the diffusion coefficient is constant.
§ the environmental conditions are constant. The diffusion model is given by Equation 1.
2 2 2
2 2 2
X X X
X D
t x y z
∂ ∂ ∂
∂ =∂ + +
∂ ∂ ∂
(1)
with the following boundary and initial conditions, for a Cartesian coordinate system with its origin placed at the particle center are:
x axis
X
x 0 0
x ∂
= =
∂ , x C
(
E)
X
x L k k X X
x ∂
= − = −
∂ ,
0
t=0 X=X
y axis
X
y 0 0
y ∂
= =
∂ , y C
(
E)
X
y L k k X X
y ∂
= − = −
∂ ,
0
t=0 X=X
z axis
X
z 0 0
z ∂
= =
∂ , z C
(
E)
X
z L k k X X
z ∂
= − = −
∂ ,
0
t=0 X=X
The solution of the three-dimensional Equation 1 is obtained as the product of one-dimensional problems. In dimensionless variables (defined below):
(
)
(
)
(
)
(
)
x y z x y z
x x, x y y, y z z, z
, , , , , ψ ξ ξ ξ τ τ τ =
= ψ ξ τ ψ ξ τ ψ ξ τ
in which ψi, i=x, y, z are obtained by solving Equation 2:
2
i i
2
i i
D
∂ψ = ∂ ψ
∂τ ∂ξ (2)
with the following boundary and initial conditions:
x axis
x
x 0 0
x ∂ψ
ξ = =
∂ , x 1 x Bix x
x ∂ψ
ξ = = − ψ
∂ ,
x 0 x 1
τ = ψ =
y axis
y
y 0 0
y ∂ψ
ξ = =
∂ ,
y
y 1 Biy y
y ∂ψ
ξ = = − ψ
∂ ,
y 0 y 1
τ = ψ =
z axis
z
z 0 0
z ∂ψ
ξ = =
∂ , z 1 z Biz z
z ∂ψ
ξ = = − ψ
∂ ,
z 0 z 1
τ = ψ =
The dimensionless variables are given below:
y axis
y y
y L
ξ = , y 2
y
D t L
τ = , y E
0 E X X X X − ψ = − x axis x x x L
ξ = , x
2 x
D t L
τ = , x E
0 E X X X X − ψ = − z axis z z z L
ξ = , z 2
z
D t L
τ = , z E
0 E X X X X − ψ = −
in which XE is the moisture content at equilibrium
with the environmental conditions and X0 is the
initial moisture content:
The solution of Equation 2 is given as an infinite series (Crank, 1975):
(
)
2n i
n
i n i
n n
n 1
4 sen
cos e
(2 sen 2 ) ∞
−λ τ
=
λ
ψ = λ ξ
λ + λ
∑
(3)in which each λn is a root of Equation 4:
i n
n
Bi tanλ + =0
i
Bi is defined for each direction, as shown below.
C x
x
k L Bi
D
= , Biy k LC y D
= , Biz k LC z D =
The average moisture content of the parallelepipedic particle (
Ψ
) may be obtained by averaging the moisture values at points on a tridimensional grid established within the limits Lx,y
L , Lz.
EXPERIMENTAL PROCEDURE Samples
Oil shale particles were supplied by Petrobras from its mine in the city of São Mateus do Sul. Samples had approximately parallelepipedic shapes.
The particle sizes were 0.06 m x 0.05 x 0.03 m for the run at 60 ºC and 0.08 m x 0.04 m x 0.02 m for the run at 90 ºC.
Experimental Apparatus
An incubator was used to dry the particle as shown in the schematic setup (Figure 1). The particle was placed in the incubator, hanging by a wire, which was attached to the bottom of an electronic balance. The particle was partially shielded by a metal wall to avoid the effect of air circulation. Mass loss was monitored continuously. The drying temperature was monitored by two thermocouples, one near the sample and the other in the incubator chamber. Before starting the drying, the particle was weighed. The experimental results on mass loss were collected until constant weight was obtained. Drying conditions were maintained constant throughout the runs. Mass loss during drying was recorded.
Figure 1: Schematic setup.
RESULTS AND DISCUSSION
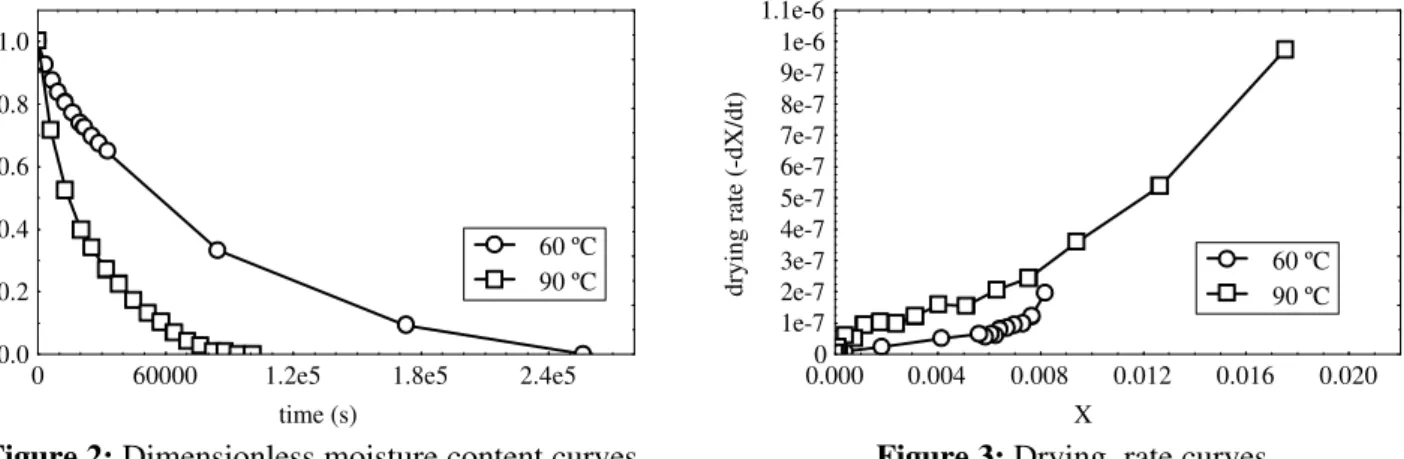
The experiments were carried out at 60 ºC and 90 ºC. The drying of the oil shale particles was described by plotting the moisture content versus time, as shown in Figure 2. The rate of moisture removal increased when the air temperature increased from 60 ºC to 90 ºC. The drying run at 60 ºC ended before equilibrium was reached (more than 3 days).
The drying rate curve was calculated by numerical differentiation of the moisture content with respect to time. Data were plotted against moisture content, as shown in Figure 3. This curve
indicates that the drying occurs in the falling rate period, with no constant rate period.
Table 1 compares the experimental and theoretical results for the runs at 60 ºC and 90 ºC. The theoretical results were obtained by averaging local values at points on a 11x11x11 grid. Figures 4 and 5 show numerical and experimental curves at 60 ºC and 90 ºC, respectively. The agreement between experimental and predicted results is satisfactory.
Table 2 shows values for the diffusion coefficient for oil shale, obtained from the literature.
slab surface to the incubator had to be assumed in the model. The diffusion coefficient value for the Brazilian oil shale was assumed to be 8x10⁻⁸ m2/s, within the range found in the literature (Table 2). The mass transfer coefficient values assumed to calculate the Biot number were 12x10-8 m/s (run at
60º C) and 25x10-8 m/s (run at 90 ºC). The Biot numbers calculated were in the same range as those found by Lane et al. (1988).
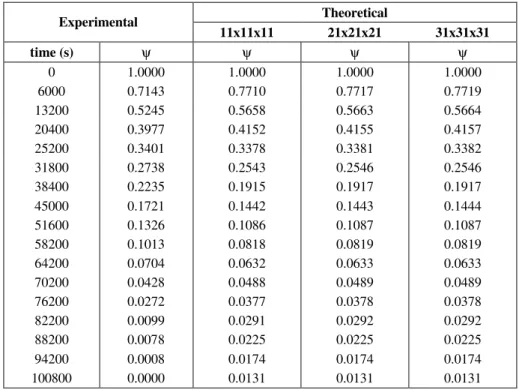
Table 3 indicates that increasing the grid points from 11x11x11 to 31x31x31 had little influence on the results.
time (s) dimensionless moisture content 0.0
0.2 0.4 0.6 0.8 1.0
0 60000 1.2e5 1.8e5 2.4e5 60 ºC 90 ºC
X
drying rate (-dX/dt)
0 1e-7 2e-7 3e-7 4e-7 5e-7 6e-7 7e-7 8e-7 9e-7 1e-6 1.1e-6
0.000 0.004 0.008 0.012 0.016 0.020 60 ºC 90 ºC
Figure 2: Dimensionless moisture content curves Figure 3: Drying rate curves.
Table 1: Dimensionless moisture obtained experimentally and by the mathematical model at 60 ºC and 90 ºC.
T = 60 ºC T = 90 ºC
Experimental Model Experimental Model
time (s) ψ time (s) ψ time (s) ψ time (s) ψ
0 1.0000 0 1.0000 0 1.0000 0 1.0000 3240 0.9248 3240 0.9541 6000 0.7143 6000 0.7701 6600 0.8764 6600 0.9064 13200 0.5245 13200 0.5658 9900 0.8391 9900 0.8597 20400 0.3978 20400 0.4152 12900 0.8068 12900 0.8171 25200 0.3401 25200 0.3378 16200 0.7739 16200 0.7704 31800 0.2738 31800 0.2543 19800 0.7405 19800 0.7193 38400 0.2236 38400 0.1915 21600 0.7277 21600 0.7003 45000 0.1721 45000 0.1442 25200 0.6993 25200 0.6638 51600 0.1326 51600 0.1086 28800 0.6759 28800 0.6273 58200 0.1013 58200 0.0818 32400 0.6487 32400 0.5909 64200 0.0704 64200 0.0632 84720 0.3318 84720 0.3104 70200 0.0428 70200 0.0488 172800 0.0919 172800 0.0890 76200 0.0272 76200 0.0377 256320 0.0000 256320 0.0062 82200 0.0099 82200 0.0291 - - - - 88200 0.0078 88200 0.0225 - - - - 94200 0.0008 94200 0.0174 - - - - 100800 0.0000 100800 0.0131
Table 2: Diffusion coefficient values found in the literature.
Type T, ºC D, m2/s References
time (s)
dimensionless moisture content 0.0
0.2 0.4 0.6 0.8 1.0
0 60000 1.2e5 1.8e5 2.4e5
experimental theoretical
time (s)
dimensionless moisture content 0.0
0.2 0.4 0.6 0.8 1.0
0 20000 40000 60000 80000 1e5
experimental theoretical
Figure 4: Theoretical and experimental dimensionless moisture content at 60 ºC.
Figure 5: Theoretical and experimental dimensionless moisture content at 90 ºC.
Table 3: Effect of number of grid points on theoretical results, run at 90 ºC.
Theoretical Experimental
11x11x11 21x21x21 31x31x31
time (s) ψ ψ ψ ψ
0 1.0000 1.0000 1.0000 1.0000 6000 0.7143 0.7710 0.7717 0.7719 13200 0.5245 0.5658 0.5663 0.5664 20400 0.3977 0.4152 0.4155 0.4157 25200 0.3401 0.3378 0.3381 0.3382 31800 0.2738 0.2543 0.2546 0.2546 38400 0.2235 0.1915 0.1917 0.1917 45000 0.1721 0.1442 0.1443 0.1444 51600 0.1326 0.1086 0.1087 0.1087 58200 0.1013 0.0818 0.0819 0.0819 64200 0.0704 0.0632 0.0633 0.0633 70200 0.0428 0.0488 0.0489 0.0489 76200 0.0272 0.0377 0.0378 0.0378 82200 0.0099 0.0291 0.0292 0.0292 88200 0.0078 0.0225 0.0225 0.0225 94200 0.0008 0.0174 0.0174 0.0174 100800 0.0000 0.0131 0.0131 0.0131
CONCLUSIONS
The mathematical model developed enables prediction of the distribution of moisture within parallelepipedic oil shale particles undergoing drying. Results indicate that the predicted and measured moisture content profiles agree satisfactorily. Further studies are necessary to obtain accurate values for the effective diffusion coefficient of moisture within the oil shale particle. The model may be integrated with a general pyrolysis model.
ACKNOWLEDGMENT
The authors are grateful to CAPES and FAPESP for financial support and to Petrobras for supplying the shale particles.
NOMENCLATURE
Bi Biot number (-)
Lx, Ly, Lz particle half-thickness m k thermal conductivity W/m K kC mass transfer coefficient m/s
t time s
T temperature ºC
X moisture content kg H20/ kg dry solid x,y,z space coordinates m
Greek Symbols
τ dimensionless time (-)
ξ dimensionless coordinates
(-)
E
0 E
X X X X
− ψ =
− dimensionless moisture (-)
E
0 E
X X X X
− Ψ =
− average dimensionless
moisture (-)
Subscripts
0 initial condition (-)
E equilibrium condition (-)
REFERENCES
Crank, J., The Mathematics of Diffusion. Great Britain, 2nd ed. Claredon Press, Oxford (1975). Duffy, B.L. and Haynes, B.S., Transport
Mechanisms in Oil Shale Drying and Pyrolysis. Energy and
Fuel, 6, pp. 831-835 (1992).
Lane, D., Ramjas, S. and Haynes, B.S., Drying Kinectics of Stuart Oil Shale, Fuel, 67, pp. 1321-1326 (1988).
Lovo Jr., P., Transferência de Calor e Perda de Massa no Processo de Pirólise de Xisto em Leito Móvel, M.Sc. Thesis, State University of Campinas, (in Portuguese) (2003).
Rajagopal, K., Mundstock, R. and Casavechia, L.C., Thermodynamic Analysis of a Shale Oil Production Plant for Energy Conservation, Energy Progress, 6, No. 1, pp. 33-36 (1986). Tamimi, A. and Uysal, B.Z., Drying Characteristics of