Experimental analysis of the concrete contribution
to shear strength beams without shear reinforcement
Análise experimental da contribuição do concreto na
resistência ao cisalhamento em vigas sem armadura
transversal
Abstract
Resumo
There are many theories and empirical formulas for estimating the shear strength of reinforced concrete structures without transverse reinforcement. The security factor of any reinforced concrete structure, against a possible collapse, is that it does not depend on the tensile strength of the concrete and the formation of any collapse is ductile, thus giving advance warning. The cracking from tensile stress can cause breakage of the concrete and should be avoided at all cost, with the intent that any such breakage does not incur any type of failure within the structure. In the present research study, experiments were performed in order to analyze the complementary mechanisms of the shear strength of lattice beams of reinforced concrete frames without transverse reinforcement. The experimental program entails the testing of eight frames that were subjected to a simple bending pro-cess. Two concrete resistance classes for analyzing compressive strength were considered on the construction of frames, 20 MPa and 40 MPa . To
resist the bending stresses, the beams of the frames are designed in domain 3 of the ultimate limit states. Diferent rates and diameters of longitudinal
reinforcement were used, 1.32% and 1.55% with 12.5 mm diameter and 16.0 mm in longitudinal tensile reinforcement. From the obtained results,
an analysis was made of the criteria already proposed for deining the norms pertinent to the portion of relevant contribution for the shear resistance mechanisms of concrete without the use of transverse reinforcement and the inluence of the concrete resistance and longitudinal reinforcement rates
established in the experimental numerical results.
Keywords: reinforced concrete, shear, cracking, additional mechanisms.
Há muitas teorias e fórmulas empíricas que estimam a resistência ao cisalhamento de estruturas de concreto armado sem armadura transversal. A segurança de qualquer estrutura de concreto armado, em relação a um possível colapso, é que ela não dependa da resistência a tração do
concreto, assim, o colapso é de forma dúctil, com aviso prévio. A issuração, proveniente de esforços de tração, pode causar a ruptura do con -creto e deve ser evitada para que não ocorra nenhum tipo de falha na estrutura. Nesta pesquisa foram realizados experimentos para analisar os mecanismos complementares ao de treliça de resistência ao cisalhamento em vigas de pórticos de concreto armado sem armadura transversal.
O programa experimental consistiu no ensaio de oito pórticos e os modelos foram submetidos à lexão simples. Foram consideradas duas classes de resistências à compressão do concreto para a concretagem dos modelos, 20 MPa e 40 MPa. Para resistir os esforços de lexão, as vigas foram
dimensionadas no domínio 3 do estado limite último. Foram usadas duas taxas de armadura, 1,32% e 1,55% com diâmetros de 12,5 mm e 16,0
mm de armaduras longitudinais de tração. A partir dos resultados obtidos foram analisados os critérios já propostos por normas para deinir a parcela da contribuição relativa aos mecanismos resistentes de cisalhamento do concreto sem o uso de armadura transversal e a inluência das
resistências do concreto e taxas de armadura longitudinal nos resultados numéricos obtidos experimentalmente.
Palavras-chave: concreto armado, cisalhamento, issuração, mecanismos complementares.
a Universidade Federal de Uberlândia (UFU), Uberlândia, MG, Brasil; b Departamento de Estruturas da FEC – Unicamp, Campinas, SP, Brasil; c Universidade Federal de Viçosa (UFV), Viçosa, MG, Brasil.
Received: 19 Nov 2015 • Accepted: 16 May 2016 • Available Online: 06 Feb 2017
M. S. SAMORA a
A. C. DOS SANTOS a
L. M. TRAUTWEIN b
M. G. MARQUES c
1. Introduction
Ruptures in reinforced concrete beams are subject to the charac-teristics of the constituent material, concrete and steel, the dimen-sions of the element, the type of load and the design and details of the reinforcing steel, where a desired requirement is that it be of a ductile type. The study made by Fusco [1] conveys that while the main traction stress, which exists at the heart of the piece, does not cause a rupture in the concrete through traction, then the concrete
resists the efects of shear.
In order to calculate the shear strength of a beam, many codes, norms and models simply recommend the overlapping of shear strength due to the concrete possessing a greater resistance ca-pacity through its shear reinforcement.
The ABNT NBR 6118:2014 [2] states that the resistance of a beam to shear, shear strength, is usually considered from two portions, Vc is the portion that is resisted by the concrete and complemen-tary mechanisms on the truss, that contribute to the concrete and Vsw the portion resisted by the transverse reinforcement.
The design calculation in [3] is presented through the truss analogy of Ritter and Morsch at the beginning of the XX century, where they associate a reinforced concrete beam to an equivalent trussed structure. Therefore, for beams with stirrups models based on strut
and tie or on stress ields can be applied for the design [4].
The truss analogy is on the one hand easy to understand and highly didactic, but on the other is a very simple representation of the real structural behaviour, Figure 1. It therefore becomes clear
that more reined models are necessary to improve and produce a
more economical structural project for reinforced concrete beams, Wilder et al.[5].
In regards to shear strength in beams without transverse reinforce-ment, there does not exist a consensus in the available codes and norms concerning the parameters and phenomena that govern the
problem of shear, which in many cases are based on empirical formulas [6,7,8].
In the case of rectangular beams, with the format of an inclined crack, the shear stress transferred through the various mecha-nisms is proportionally 20% to 40% for the non-cracked concrete compression zone, 33% to 50% for the aggregate mesh and 15%
for the pin efect, KIM and PARK [10]. In Yang [11], the importance
of the interlocking of aggregates is brought to the fore concerning shear stress, which aids in the transference of forces after crack-ing starts.
The type of opening and relative dislocation of the crack develops normal tangential stresses, which are limited by the roughness of the contact surface. Emphasis is given here to the point that the
roughness of the cracked surface is inluenced by the size of the
aggregate as well as by the real format of the crack, Ruiz et al. [8]. Besides the meshing of aggregates, other shear stress transfer-ence mechanisms were cited in Ruiz et al. [8], such as the
re-sistance to concrete traction, the arc efect and the pin efect. In
Bentz [12], shear strength is explained through a consideration of aggregate meshing in accordance with Walraven[9].
2. Method for calculating the shear
strength of concrete (Vc)
2.1 ABNT NBR 6118:2014
In the case of elements with cross section reinforcement,
(1)
sw c rd
sd
V
V
V
V
£
3=
+
0
c
c
V
V
=
For simple bending and lexion traction with the neutralline cutting the section,
(2)
d
b
f
V
V
c=
co=
0
,
6
×
ctd×
w×
Figure 1
Truss analogy proposed by Ritter and Morsch [5]
(3)
sw
sw
A
ywdV
0,9 d f
s
æ
ö
=
ç
÷
×
× ×
è
ø
Where:
V
sd – Shear stress requesting calculation, in section,
V
rd3 – Shear stress resisting calculation, related to the rupture by
diagonal traction,
c
V
– Portion of absorbed shear through complementary mecha-nisms of the truss,0
c
V
– Reference value forV
c, whenθ = 45º
,ctd
f
– Calculation for resistance of concrete to traction,w
b
– Width of cross section,d
– Useful height,A
sw – Reinforced cross section,
s
– Spacing between elements of reinforced cross sectionA
sw measured in accordance with the longitudinal axis of the
struc-tural element.
(4)
c ctk ctdf
f
g
inf ,=
The resistance to indirect traction
f
ct,sup should be obtained through
laboratory tests performed according to ABNT NBR 7222 [13]. The resistance to direct traction
f
ct can be considered as equal to
f
ct= 0,9
•f
ct,sp
.
2.2 ACI 318-14
Equation 22.5.5.1 of the norm ACI 318-14 [14] in section 22.5.5,
determines in a simpliied manner, the portion
V
c that correspondsto shear strength of the concrete is given by,
(5)
d
b
f
V
c=
0
,
17
×
l
×
c'×
w×
Where,'
c
f
– Resistance to concrete compression inMPa
,w
b
– Largura da seção transversal em (mm),d
– Distance from extreme compression iber to centroid of longi -tudinal tension reinforcement in (mm),λ
– Reduction factor of the mechanical properties of the concrete type, concrete with normal weightλ
=
1
(Table 19.2.4.2 of ACI 314-14),c
V
– Nominal shear strength of concrete inN
.A more detailed calculation of
V
c is made in accordance with the expressions from table 22.5.5.1 of ACI 318-14 using less than three values,(6)
d
b
M
d
V
f
V
w u u w cc
÷÷
×
×
ø
ö
çç
è
æ
×
×
×
+
×
=
0
,
16
l
'17
r
(7)
d
b
f
V
c=
ç
è
æ
0
,
16
×
l
c'+
17
×
r
w÷
ö
ø
×
w×
(8)
d
b
f
V
c=
0
,
29
×
l
×
c'×
w×
Where,
w
ρ
– Longitudinal reinforcement ratio,u
V
– Shear stress on the section,u
M
– Bending moment in section.For a majority of the models the second part of expressions (6) and (7) takes a value of 0,01×l fc' as allowed through Equation 5.
2.3 BS 8110-97
The design of concrete and reinforcements in accordance with BS8110-97 [15] can be taken as elements of the strut and tie sys-tem. The rupture in beams through shear with transversal
rein-forcement consider the angle of compression struts as θ=30º. The
shear stress
v
, in any cross section is given by equation,(9)
d
b
V
v×
=
n
Where, vb
= width of the section in (mm),d
= efective height in (mm).Under no circumstances should ν be greater than, MPa
mm N v
fcu 5 5
85 ,
0 £ £ 2=
f
cu=
Resistance characteristic of concrete compression.2.4 EN 1992-1-1: 2004 EUROCODE 2
The calculation model adopted by EUROCODE 2 [17] is based on the truss model with a recommended angle on the struts of
com-pression θ at interval 45º≤ θ ≤ 68.20º.
In section 6.2.2, equation 6.4 of the Eurocode allows for the cal-culation of shear stress on concrete beams without transversal re-inforcement in non-cracked regions through bending is given by:
(10)
ctd cp l ctd w c Rdc
V
I
S
b
f
f
V
=
=
×
×
2+
a
×
s
×
,
(
)
Where,
c
V
emN
=
ctd
f
Resistance characteristic of tensile concreteMPa
,0
0
,
1
≤
lα
For pre stressed bars, andα
l=
1
,
0
0
for other types of pre stresses,σcp
=
Compressive stress in the concrete due to axial load,c ed cp
A
N
=
s
EmMPa
;N
ed
˃
0
on compression,c
A
– Cross section area of concrete,d
b
w,
– Width of the cross section in and efective depth in (mm),I – Moment of inertia of the cross section,
S – Static moment of the area above the axis of the centre of grav-ity for the section.
2.5 CSA A23 3-04
The design of the reinforced concrete parts is based on the ield theory of modiied compression with the angle of the compression struts at θ = 35º. The Canadian norm CSA A23. 3-04 [16] in section
11.3.4 determines the value of the concrete to shear stress in ac-cordance with equation,
(11)
v w c c
c
f
b
d
V
=
f
×
l
×
b
×
'×
×
Onde:
0
=
c
M. S. SAMORA | A. C. DOS SANTOS | L. M. TRAUTWEIN | M. G. MARQUES
=
β
The factor responsible for the resistance of the cracked con-crete,β
= 0,210
,
1
=
λ
= Density of normal concrete,=
w
b
Width of beam in (mm),=
v
d
Efective shear depth in(mm).Resistance to compression of concrete should be less than or equal to 64 MPa or
MPa
f
c'£
8
,
0
,
9
d
£
d
v£
0
,
72
h
ande
b
wb
£
w250
≤
250
mm
m
m
'
c
f
in MPa,b
w,
d
v in (mm),V
c intoN
The calculation of
β
for the cross section without sheartransver-sal resistance by the simpliied method is given by,
a) If the section does not contain transversal reinforcement and the maximum nominal aggregate is not less than 20 mm
β
should be taken as,(12)
(
+
d
v)
=
1000
230
b
b) If the section does not contain transversal reinforcement, the value of
β
can be determined by aggregate size, thus sub-stituting the parameterd
v in the equation of parameterS
ze, which allows the size of the aggregate and the equivalent value to be considered asS
z and depends on the characteristics of the longitudinal reinforcement, where,(13)
g z ze
S
a
S
+
×
=
15
35
=
g
a
Speciied nominal maximum size of coarse aggregate,z
ze
S
S
³
0
,
85
zS
– One should taked
v or the maximum distance between the distribution lines of the longitudinal reinforcement, that which is the shortest. Each layer of longitudinal reinforcement should have an area of at least0
,
003
⋅
b
w⋅
S
z as illustrated in Figure 2.2.6 FIB MODEL CODE 2010
Resistance to shear for concrete parts without reinforcement, in accordance with the FIB Model Code 2010 [18] can be calculated through equation,
(14)
z
b
f
k
V
wc ck v c
Rd,
=
×
g
×
×
Where,
=
z
Internal lever arm or useful height in (mm),=
w
b
Beam thickness in (mm),=
c
γ
Concrete safety coeicient,g
c=
,1
50
,V
Rd,cintoN
F
ck intoMPa
andf
ck£
8
MPa
where,(15)
z
k
v=
1000
180
+
,1
25
×
Figure 2
Details of the transversal section for the calculation of S
z, adapted from [15]
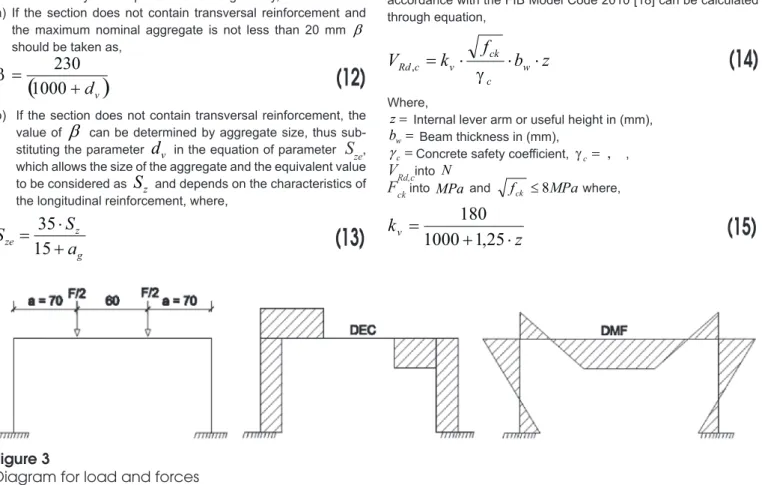
Figure 3
3. Experimental program and materials
3.1 Frame features and properties of materials
Four series of reinforced concrete frames were tested with a height of 1.10 m and 2.25 m in length with equidistant loads on the sup-ports and crescents, Samora [19]. For each series, two frames were used with the same geometric features and variables, as such eight frames were tested.
The scheme for the loading of the frames and the diagrams of the stress corresponding to the free body are presented in Figure 3. The experimental planning was mounted with the resistance factors, characteristic of concrete compression and the longitudinal rein-forcement ratio of the beam, Table 1. The interest in variation or fac-tor input levels is the shear resistance of the concrete on the rupture. The test models had a geometric ratio of longitudinal reinforcement of 1.32% for the type A frames and of 1.55% for type B frames. The frame beams have a rectangular cross section of 15 m width, 30 cm in height by 2.25 m in length. The frame columns have a rect-angular cross section of 15 cm in width and 25 cm in length and a height of 1.10 m from the support to the upper side of the beam. The dimensions and details of the frames are indicated in Figures 4 and 5.
The concrete used in the test study was of ready-mix type, sup-plied by specialized companies. For the pairs P1, P2 and P3, P4 concrete of classes C20 and C40 was used respectively, and refer to an age of 28 days.
The results from the laboratory tests for resistance to concrete compression at diverse ages along with the values for the modules of elasticity and traction are presented on Tables 2 and 3.
On Table 4, dates are presented for the performing of the tests and the age of each part in relation to the date of concreting.
The ABNT 6118:2014 permits the veriication of the resistance cal -culation for the concrete in t (days) in relation to the age 28 days is given by the expression,
c ck
c j ck
cd
f
f
f
g
b
g
@
×
=
, 1In this case, the weighting coeicient adopted for the concrete resis -tance is
γ
c=
1
. The value forβ
1 can be obtained by the expression,ïþ
ï
ý
ü
ïî
ï
í
ì
ú
ú
û
ù
ê
ê
ë
é
÷
ø
ö
ç
è
æ
-×
=
21
1
exp
s
1
28
t
b
Figure 4
Frame dimensions – dimensions in cm
Table 1
Identiication of the models
Series Type Model fc (MPa)
Longitudinal reinforcement
traction
Asl (cm2) ρ
l (%) a/d
P1 A a
20
4ø 12,5mm 4,90 1,32 2,83
b
P2 B a 3ø 16,0mm 6,03 1,55 2,67
b
P3 A a
40
4ø 12,5mm 4,90 1,32 2,83
b
P4 B a 3ø 16,0mm 6,03 1,55 2,67
M. S. SAMORA | A. C. DOS SANTOS | L. M. TRAUTWEIN | M. G. MARQUES
Table 2
Results from tests on compression strength of concrete from the frames
Age (C) fc (20 MPA) fcm (MPA) fc (40 MPA) fcm (MPA)
fc, 7 days 8,90 8,92 23,24 22,61
8,94 21,29
fc, 14 days 12,7 12,26 27,72 28,95
11,82 30,18
fc, 28 days 17,65 17,13 35,87 36,72
16,62 37,57
fc, 56 days 21,36 21,61 41,05 40,50
21,86 39,95
Table 3
Results from tests on modulus of elasticity and tensile strength
Concrete Age (C) fcm (MPA) Ec (GPA) fct, sup (MPA) fct = 0,9 • fct, sup
(MPA)
fc (20 MPa) 56 days 21,54 28,79 2,45 2,21
fc (40 MPa) 56 days 44,13 36,30 3,98 3,58
Figure 5
With,
s = 0,38
for concrete from cement CPIII and CPIVs = 0,25
for concrete from cement CPI and CPIIs = 0,20
for concrete from cement CPV-ARI=
t
efective age of the concrete, in days.Table 5 presents the probable resistance to compression estimated for the concrete used in the frames on the date of the laboratory tests.
One airms that there was no inluence in relation to the age of the
concrete used in the frames on the data of the test to the varia-tion that occurred on the compression resistance, in relavaria-tion to the value obtained through the testing of cylindrical specimens of 10 cm x 20 cm at 56 days of age for the frame concrete, which was adopted for the calculations and considerations of the study. Table 6 presents the measured results obtained for the mechanical properties from the steel bars.
3.2 Instrumentation
The speciic deformations on the reinforcements and the concrete
were measured by electric extensometers from Excel Sensores.
These meters were stuck to the longitudinal reinforcements and the concrete by means of cyanoacrylate based adhesive, isolated and sealed with plastic tape as shown in Figure 6. These exten-someters stuck to the longitudinal reinforcements were designated by the letter L, those immersed in the concrete letter I, and those stuck to the compressed side of the concrete, letter C.
3.3 Equipment used in the tests
For applying the loads the metallic frame was used, which was mount-ed on a response slab at the structures laboratory at UFU. The load was applied by the hydraulic actuator feed by a manual pump and transferred to two symmetrical points away from the beam at 70 cm at
each extremity, by means of a beam made up of a metallic proile “I”
250 mm × 44.80 kg/m. For the measuring of the load, a load cell was employed, made up of a steel cylinder with the resistance electric ex-tensometer calibrated until 500 kN placed on it, as shown in Figure 7. The load was applied with increases of 15 kN. At each stage of loading, observations were made and registered on panoramic vid-eo of the cracks that occurred on the frame. The rate at which the load increased one noted the evolution of the cracks, which were marked with crayon on the concrete surface, Figure 8.
Through the use of electric extensometers linked to the data log-ger, measurements were made of the deformations of the rein-forcements and the concrete.
4. Results and discussions
The values for the portion of shear stress resisted by complementary
Table 4
Age of specimen
Series Type Model fc (MPa) Date of concreting Date of test Age (days)
P1 A a
20
04/04/2014
07/08/2014 125
b 11/07/2014 98
P2 B a 18/07/2014 105
b 04/07/2014 91
P3 A a
40
16/06/2014 73
b 24/07/2014 111
P4 B a 27/06/2014 84
b 01/08/2014 119
Table 5
Probable compression strength estimated for the concrete
Series Type Model fc, 28 days (MPa) fc, 56 days (MPa) Age (days) Estimated probable strength (MPa)
P1 A a
17,13 21,60
125 19,54
b 98 19,24
P2 B a 105 19,33
b 91 19,15
P3 A a
36,72 40,50
73 40,39
b 111 41,59
P4 B a 84 40,81
b 119 41,76
Table 6
Test results for traction on the steel bars
Ø (mm) fy (MPa) Es (MPa)
12,5 603,60 193.073,00
M. S. SAMORA | A. C. DOS SANTOS | L. M. TRAUTWEIN | M. G. MARQUES
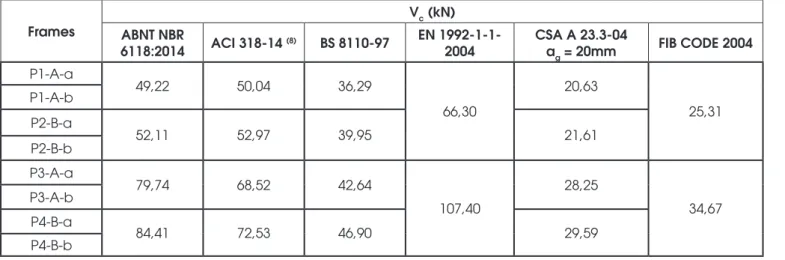
mechanisms were calculated as deined by the norms ABNT NBR
6118:2014 [2], ACI 318-14 [14], BS 8110-97 [15], EN 1992-1-1-2004 [17], CSA A23. 3-04 [16] and FIB MODEL CODE 2004 [18], Table 7.
Through the longitudinal reinforcement proposed, the theo-retical value of the last moment of longitudinal reinforcement
low was calculated in accordance with the hypotheses of
Figure 6
General position of extensometers on the frame
Figure 7
Figure 8
Panorama of cracks in the frames and rupture loads
Rupture
Rupture
Rupture
Rupture
Rupture
Rupture
Rupture
M. S. SAMORA | A. C. DOS SANTOS | L. M. TRAUTWEIN | M. G. MARQUES
ABNT NBR 6118:2014 [2], where rectangular distribution on the stresses of the concrete compression was admitted. This bend-ing moment corresponds to a shear force, the last to be obtained through use of the program Ftool [20]. Table 8 presents the com-parative results of the theoretical value with the experimental value.
The comparison calc u u
V
V
, exp ,, of the experimental results in relation to
the last shear stress values obtained from the calculated values,
shows that the frames with the highest ratio of reinforcement
%
5
5
,
1
=
lρ
(P2 e P4) present the lowest shear relation when com-pared to the shear relation of the frames with the lowest ratio of reinforcementρ
l=
1
1,32 %
(P1 e P3).Table 9 presents the results of the resistance variation of shear of the complementary mechanisms, which maintained constant per-centages of longitudinal reinforcement in function of the concrete compression resistance.
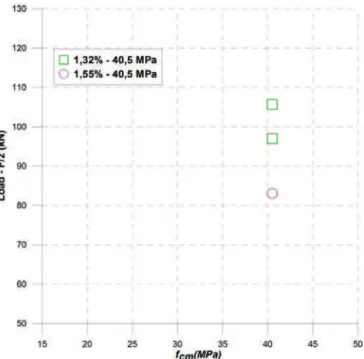
One notes that for the frame beams analysed without transversal rein-forcement, with the same ratio of longitudinal reinrein-forcement, there was an increase in shear strength from the complementary mechanisms of the truss, with an increase in resistance to concrete compression. Figures 9 and 10, present the comparison of load resistance of the beams with the same resistance to concrete compression, by varying the ratio of reinforcement. Stated here is that beams that possess lower ratios of reinforcement to the same concrete com-pression resistance, support higher loads.
Upon the analysis of the beam deformations with a higher value given to the bending moment, extensometer
L
0
, Figure 11, one notes that the reinforcements do not reach the maximumadmit-ted low by the norm of 10 mm/m. The highest value obtained was 0.0013 mm/m for beam P1-A-a, conirming the rupture of the
beams by shear stress and not simple bending.
Table 7
Strength values in accordance with norms
Frames
Vc (kN) ABNT NBR
6118:2014 ACI 318-14 (8) BS 8110-97
EN 1992-1-1-2004
CSA A 23.3-04
ag = 20mm FIB CODE 2004
P1-A-a
49,22 50,04 36,29
66,30
20,63
25,31 P1-A-b
P2-B-a
52,11 52,97 39,95 21,61
P2-B-b
P3-A-a
79,74 68,52 42,64
107,40
28,25
34,67 P3-A-b
P4-B-a
84,41 72,53 46,90 29,59
P4-B-b
Table 8
Comparison of calculated and experimental values
Frames
Calculated values Experimental values
Vu,exp /Vu,cal Vu,cal (kN) Mu,cal (kN • m) F
2 =Vu (kN) Mu,exp (kN • m)
P1-A-a
150,30 57,34 65,40 25,00 0,435
P1-A-b 70,20 26,80 0,467
P2-B-a
189,60 69,89 57,93 22,10 0,316
P2-B-b 59,92 22,90 0,327
P3-A-a
169,50 64,68 105,66 40,30 0,623
P3-A-b 96,98 37,00 0,572
P4-B-a
210,00 80,32 83,11 31,70 0,397
P4-B-b – – –
Observation: The results for frame P4-B-b were withdrawn as they did not obtain randomly distributed values around an average value and did not follow the tendency of the samples.
Table 9
Strength variation of the complementary
mechanisms in function of the concrete
compression strength
Frames F
2 =Vu (kN) Δ (%)
21,60 MPa – 1,32% 67,80
49,44
40,50 MPa – 1,32% 101,32
21,60 MPa – 1,55% 58,93
41,03
Table 8 shows the results for the comparison of the experimen-tal values of the resistant portion of the concrete to shear without transversal reinforcement
(
V
u,exp)
in relation to the values of(
V
c)
calculated by the norms [2, 14, 15, 16, 17, 18].
One notes that there is a great variation in the values calculated by the norms compared to the experimental values. The ABNT NBR 6118:2014 and the ACI 318-14 are those that most converge the
calculated values with a diference of approximately 10%, Table 10.
5. Conclusions
This work had as its objective to present the analyses of the
experimental results concerning the portion of shear stress strength
c
V
, in beams from embedded frames, with the strength variation characteristic of concrete and the ratio of longitudinal reinforce-ment. One concludes that,1) With the lower ratio of longitudinal reinforcement, maintaining constant the strength characteristics of the concrete, there was an increase in strength of the complementary mechanisms of truss, when faced with shear. Based on the tensile and com-pression stresses applied to the concrete by a bar of steel of
stress to be transferred by the pin efect, the maximum trans
-ferred stress through the pin efect was negatively afected with
the increase in the diameter of the bars.
Figure 9
Variation of the longitudinal reinforcement ratio/
concrete compression strength 21.6 MPa
Figure 10
Variation of the longitudinal reinforcement ratio/
concrete compression strength 40.5 MPa
Figure 11
M. S. SAMORA | A. C. DOS SANTOS | L. M. TRAUTWEIN | M. G. MARQUES
2) With the increase in strength characteristic of concrete under compression, maintaining constant the ratio of longitudinal reinforcement of the beam, the experimental results show an increase in strength in the complementary mechanisms of the truss, when faced with shear, evincing therefore a higher mobi-lization by the meshing of the aggregates.
3) Regarding values obtained experimentally compared to calcu-lation values from norms, the results that are closest to the ex-perimental are from EUROCODE: 2004.
4) The ixed values from the norm ABNT NBR 6118: 2014 are
lower in approximately 21,6% in relation to those values ob-tained experimentally for shear concrete strength. The formula for calculating the portion of shear stress resisted by comple-mentary mechanisms to the truss model
V
c=
0
,
6
⋅
f
ctd⋅
b
w⋅
d
in simple bending, the multiplying factor of the equation terms can be equal to
0
,
7296
when considering the results from this research study.6. Bibliographic references
[1] FUSCO, Péricles Brasiliense. Estruturas de concreto: Solicita-ções Tangenciais. São Paulo: Editora Pini Ltda., 2008. 328 p. [2] ASSOCIAÇÃO BRASILEIRA DE NORMAS TÉCNICAS.
NBR 6118:2014. Projeto de estruturas de concreto – Proce-dimento. Rio de Janeiro, 2014.
[3] Ritter W. Die bauweise hennebique. Schweizerische Bauzei-tung 1899;33:41–61.
[4] ASCE-ACI Committee 445 on Shear and Torsion. Recent approaches to shear design of structural concrete. ASCE, J Struct Eng 1998;124(12):1375–417.
[5] K. De Wilder, P. Lava, D. Debruyne, Y. Wang, G. De Roeck, L.
Vandewalle. Experimental investigation on the shear capacity of prestressed concrete beams using digital image correlation. [6] ACI Committee 318. 318-11: Building code requirements for
structural concrete and commentary. ACI; 2011. p. 503. [3] CEN European Committee for Standardization.
[7] Eurocode 2. Design of concrete structures – general rules and rules for buildings. EN 1992-1-1, Brussels, Belgium; 2004. p. 225.
[8] M. Fernández Ruiz, A. Muttoni, J. Sagaseta. Shear streng-th of concrete members wistreng-thout transverse reinforcement: A mechanical approach to consistently account for size and
strain efects. Engineering Structures, Volume 99 (2015)
360–372.
[9] WALRAVEN, Joost Cornelis. AGGREGATE INTERLOCK:
A theoretical and experimental analysis. 1980. 202 f. Tese Doutorado - Curso de Engenharia Civil, Delft University Of Technology, Holanda do Sul, 1980.
[10] KIM, Jin-keun; PARK, Yon-dong. Prediction of Shear Streng -th of Reinforced Concrete Beams wi-thout Web Reinforce-ment. ACI Materials Journal, Estados Unidos, v. 93, n. 3, p.213-222, maio 1996.
[11] Yang Y. Shear behaviour of reinforced concrete members
without shear reinforcement, a new look at an old problem. PhD thesis, Delft University of Technology, Delft, Netherlan-ds; 2014. p. 344.
[12] Bentz EC, Vecchio FJ, Collins MP. Simpliied modiied com
-pression ield theory for calculating shear strength of reinfor -ced concrete elements. ACI Struct J 2006;103(4):614–24. [13] ASSOCIAÇÃO BRASILEIRA DE NORMAS TÉCNICAS.
NBR 7222: 1994. Argamassa e concreto – Determinação da resistência à tração por compressão diametral de corpos de prova cilíndricos. Rio de Janeiro, 1994.
[14] AMERICAN CONCRETE INSTITUTE. Building Code Re-quirements for Structural Concrete (ACI 318-14). Michigan, USA, 2014.
[15] BRITISH STANDARD INSTITUTION, BS 8110 Structural Use of Concrete, Part. 1. Code of Practice for Design and Construction, BSI publications , London, 1997,160 p. [16] CANADIAN STANDARDS ASSOCIATION. A23.3-04:
De-sign of concrete structures. xviii ed. Ontário: Canadian Stan-dards Association, 2004, 232 p.
Table 10
Comparison between experimental and calculated values of the norms
Frames
Vu,exp /Vc
ABNT NBR 6118:2014 ACI 318-14 (8) BS 8110-97 EN 1992-1-1:2004 CSA A23.3.04
ag=20mm
FIB CODE 2014
P1-A-a 1,328 1,307 1,802 0,986 3,170 2,584
P1-A-b 1,426 1,403 1,934 1,059 3,403 2,774
P2-B-a 1,112 1,094 1,450 0,874 2,681 2,289
P2-B-b 1,149 1,131 1,500 0,904 2,773 2,368
P3-A-a 1,325 1,542 2,469 0,984 3,740 3,048
P3-A-b 1,216 1,415 2,274 0,903 3,433 2,797
P4-B-a 0,985 1,146 1,772 0,774 2,809 2,390
P4-B-b – – – – – –
[17] EUROPEAN STANDARD EN 1992-1-1: Eurocode 2: Design
of Concrete Structures – Part 1: General rules and rules for
buildings, London, 1992.
[18] Fédération Internationale du Béton (ib), Model Code 2010 – inal draft, vols. 1 and 2, fédération internationale du béton,
Bulletins 65 and 66, Lausanne, Switzerland; 2012. p. 350 and p. 370.
[19] Samora, M. S. Avaliação dos mecanismos resistentes ao ci-salhamento em concreto armado sem armadura transversal. 140 p. Dissertação (Mestrado), Faculdade de Engenharia Civil, Universidade Federal de Uberlândia, 2015.
[20] Ftool - Two-dimensional Frame Analysis Tool: versão 3.0.
Luiz Fernando Martha, 2012. Disponível em