INTRODUCTION
Trace elements (TE) are inorganic elements that are required in small quantities for normal metabolic functions. Chromium (Cr) is a well-known TE, that displays a major role in carbohydrates, lipids and proteins, and its deiciency seems to be associated with Type 2 Diabetes Mellitus(1,3,26). Cr acts by reducing insulin resistance,
being part of a Glucose Tolerance Factor (GTF) that also includes nicotinic acid, glycine, cysteine and glutamic acid(1,4,5,11,14,18,19,22).
Also, Cr may participate in lipid metabolism and may have some effect on body composition.
Dietary Cr is found in food as a stable trivalent form (Cr3+) that
is poorly absorbed in the gut. In fact, absorption seems to have an inverse relationship with the amount ingested, preventing dietary toxicity(23). Dietary Reference Intakes (DRIs) for Cr range between
20-25 mg/day for both adult men and women(2). Dietary sources of
Cr include whole grain foods. Meat and ish provide around 1-2 mg per dose. Vegetables and fruit contribute with a variable amount of Cr with a major concentration in broccolis. We also ind a high amount of Cr in nuts, egg yolk, bear yeast and some French wine.
Cr deiciency signs include reduced glucose tolerance, in-creased insulin needs, inin-creased free fatty acids, weight loss and peripheral neuropathy. Deiciency is seldom reported except for
Low serum Chromium is rare in patients that
underwent endoscopic gastrostomy for long term
enteral feeding
Carla Adriana
SANTOS
1, Jorge
FONSECA
1,2, Elisabete
CAROLINO
3and António Sousa
GUERREIRO
4,5Received 7/2/2017 Accepted 9/3/2017
ABSTRACT – Background – Patients that underwent Percutaneous Endoscopic Gastrostomy (PEG) present with protein-energy malnutrition. Trace ele-ments are required in small quantities and Chromium (Cr) displays a major role in the metabolism. Objective – This study aims to evaluate Cr levels and its relationship with serum proteins, BMI and underlying diseases during the irst 3 months of PEG feeding. Methods – Prospective observational study during 3-months, when PEG was performed (T0), after 4 (T1), and 12 weeks (T3). Initial evaluation included: age, gender, underlying disease, NRS-2002, BMI, serum albumin, transferrin and Cr concentration. At T1 and T3 a blood sample was collected for Cr, albumin and transferrin. A Graphite Furnace Atomic Absorption Spectroscopy was used to assess Cr. According with the underlying disease, patients were divided into two
groups: head and neck cancer (HNC) and neurological dysphagia (ND). All patients were fed with homemade meals. Results – A one hundred and
twenty-nine patients (80 males), 26-95 years old were studied: HNC-52; ND-77. The observed data included low mean values of BMI from 71 patients; low Cr-8, low albumin-70, low transferrin-85 and 57 with both proteins low. Albumin was associated with survival time (P=0.024) and there was a signiicant correlation between albumin and Cr (r=0.217, P=0.012). A good evolution of Cr and proteins values was observed, with no low Cr levels at T3. Conclusion – Low serum Cr is rare in PEG-patients, with no relationship to other studied parameters. For the minority of patients displaying low Cr before gastrostomy, homemade PEG meals seem to be effective.
HEADINGS – Gastrostomy, rehabilitation. Gastrointestinal endoscopy. Chromium, deiciency. Enteral nutrition.
Declared conflict of interest of all authors: none Disclosure of funding: no funding received
1 GENE – Enteral Feeding Team. Hospital Garcia de Orta, Portugal; 2 Center for Interdisciplinary Research Egas Moniz (CiiEM), Almada, Portugal; 3 Departamento das Ciências Naturais
e Exatas, Escola Superior de Tecnologias da Saúde de Lisboa, Instituto Politécnico de Lisboa, Portugal; 4 Centro de Estudos de Doenças Crónicas (CEDOC), NOVA Medical School / Faculdade
de Ciências Médicas, Universidade Nova de Lisboa, Portugal; 5 Serviço de Medicina 4 / Hospital Santa Marta / Centro Hospitalar de Lisboa Central, Portugal.
Correspondence: Carla Adriana Santos. Bloco de Exames Especiais, Hospital Garcia de Orta. Av. Professor Torrado da Silva, 2800 – Almada, Portugal. E-mail: [email protected]
the classic case reports of patients under long term parenteral nutrition without adequate Cr supply(7).
Clinical settings where oral intake is not suficient or safe are the usual indications for tube feeding. For long term tube feeding, longer than 3 weeks, Percutaneous Endoscopic Gastrostomy (PEG) is the gold standard(10). In recent years, more and more patients, mostly with
METHODS
A prospective observational study was performed to evaluate serum Cr concentration in consecutive adult patients that were referred to and underwent endoscopic gastrostomy, to have nutri-tional support for long-term dysphagia (more than 3-4 weeks). All patients were fed enteral homemade meals. All adult PEG-patients were invited to participate. The subjects and/or their legal caregiv-ers were informed of the study aim and procedures and gave their informed consent. This study was approved by the Hospital Ethics Committee. Patients were included in one of two groups according to the dysphagia-inducing disease: (1) head and neck cancer (HNC) including oral cavity, pharyngeal, laryngeal and oesophageal proximal cancer; (2) neurological dysphagia (ND) including acute and chronic disorders.
The inclusion criteria included:
1. Indication for endoscopic gastrostomy with dysphagia longer than 3-4 weeks.
2. Previous oral intake of 50% of caloric needs.
3. After gastrostomy, patients should be fed with homemade diets through PEG.
4. Complete medical records should be available. 5. Patients had to be clinically stable.
Exclusion criteria included: 1. Age <18 years.
2. Refusal to be included in the study. 3. Clinical instability.
All these patients were evaluated by the dietitian, the gastro-enterologist and the nurse of the “Artiicial Feeding Team”, using the same protocol, at the time of the PEG procedure, and after 4 weeks and 12 weeks.
Nutritional assessment of protein-energy intake was performed by the dietitian of the Artiicial Feeding Team. A retrospective 24h dietary recall was performed before the gastrostomy, to the patient or their caregiver, to evaluate the previous protein-energy intake. For calculating the protein-energy consumption, the software SANUT® was used.
After gastrostomy, patients lived at their own homes or in nurs-ing homes. Each patient and/or a family member or caregiver was trained in home tube feeding, which included meal preparation, diet administration, and complications monitoring. Each patient was fed with homemade meals tailored according to an individual evaluation of nutritional needs. No measures were employed to improve Cr content in the diets.
Collected data included: 1. Age and gender.
2. Underlying dysphagia-inducing disease (classiied as HNC or ND).
3. Nutritional Risk Screening 2002 (NRS 2002). 4. Body Mass Index (BMI).
5. Serum albumin, transferrin and Cr concentrations. 6. Presence of type 2 diabetes.
Nutritional Risk Identification
For nutritional screening the tool recommended by E.S.P.E.N. was used, the Nutritional Risk Screening – NRS 2002(9).
Global Nutritional Assessment
Most patients showed speech impairments as well as dysphagia caused by the same underlying disorders. For these patients, global nutritional assessment relied mostly in objective data, anthropom-etry and serum data, including albumin and transferrin. Body Mass Index (BMI) was obtained in most patients and expressed as the ratio of body weight/height squared (kg/m2). If patients were
bed-ridden and could not stand up for weight and height evaluation, BMI was estimated using the Mid Upper Arm Circumference and regression equations described by Powell-Tuck/Hennessy, previ-ously been used by the team(12,13,25). Malnutrition was deined as a
BMI <18.5 kg/m2 for adult patients younger than 65 years and <22
kg/m2 for patients with 65 years or older(24). Although serum
pro-teins may be inluenced by a wide range of non-nutritional factors, albumin <3.5 g/dL and transferrin <200 mg/dL were considered to be representative of malnutrition. A dietary recall from the previous weeks was obtained from patients, family or caregivers.
Blood samples assays
Blood samples were obtained following at least 12 hours of fasting, between 8:00 and 10:00 AM. From each patient, a blood sample was obtained minutes before the gastrostomy procedure and 4 and 12 weeks after the gastrostomy, at the Artiicial Feeding outpatient’s consultation. Part of the blood sample of each patient was used for the standard PEG-patient evaluation, including serum proteins. Other part was split into speciically designed metal-free tubes for Cr assessment. After centrifugation serum samples were kept frozen (-80ºC) until the analysis. Serum concentration of Cr was analyzed and reported from the laboratory REQUIMTE (Rede de Química e Tecnologia Departamento de Química/Faculdade de Ciências e Tecnologia da Universidade Nova de Lisboa). Serum Cr samples were assayed using GFAAS (Graphite Furnace Atomic Absorption Spectroscopy). The reference values considered for Cr were between 50-200 μg/dL(20).
Statistical analysis
The Statistical Package for Social Sciences (IBM SPSS Statis-tics), version 22.0, was used in the study. The results are considered signiicant at a 5% signiicance level. The Shapiro-Wilk test was used to assess the normality of the data. Descriptive statistics were used to evaluate Cr levels in dysphagic patients. Independent Samples t-test was used (since the assumption of normality was veriied) to compare Cr levels and proteins (albumin and transferrin) between the two groups (HNC and ND). To study the relationship between Cr levels, albumin and transferrin, Pearson correlation was used. To compare Cr levels between BMI categories, the Kruskal-Wallis test was used, since the assumption of normality of data in BMI categories was not veriied. To compare protein concentration be-tween BMI categories, ANOVA was used, since the assumption of normality of data in BMI categories was veriied. Cox regression was used for the determination of association with etiology, Cr, BMI, Albumin and transferrin with survival time.
RESULTS
Characteristics of the study population (Table 1)
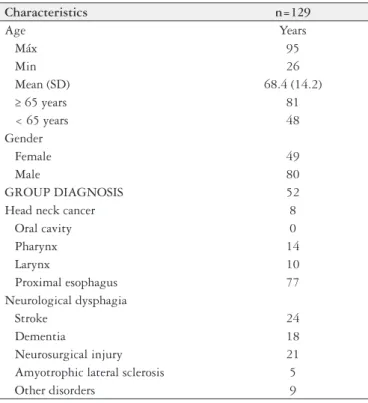
Seventy-seven with Neurologic Dysphagia (ND), the most common diagnostic. Twenty-four comprises strokes, eighteen with dementias, twenty-one from neurosurgical setting, ive with amyotrophic lateral sclerosis and nine from other neurological diseases. Fifty-two from Head and Neck Cancer (HNC). This group comprises cancers located in the oral cavity (n=8), larynges (n=14), pharynges (n=20), and proximal oesophagus (n=10). No patients presented with Diabetes or increased fasting blood glucose. Before the PEG procedure, all patients had dysphagia for at least one month. All of them had a prior intake below 50% of daily caloric needs. All patients were clinically stable at the moment of the gastrostomy procedure and sample collection (unstable patients were postponed).
Body Mass Index
Most of the patients had the BMI calculated from Quetelet’s equation kg/m2. Only in 55 (42.5%) of the cases (48 ND, 7 HNC)
was BMI estimated using the Mid Upper Arm Circumference and regression equations described by Powell-Tuck/Hennessy. From 129 patients, 71 (55%) showed low BMI (<18.5 kg/m2 for patients
younger than 65 years old and <22 kg/m2 for patients with 65 years
old or older). When dividing the study population by the cause of dysphagia, 42 patients from the ND group presented a low BMI (52%), while in HNC group 29 patients also presented a low BMI (55%). In the group of older patients, 49 (64%) presented low BMI, while in the younger group only 12 (36%) presented low BMI.
Cr and serum proteins concentrations • Cr concentration
One hundred twenty-nine patients were evaluated regarding Cr in the range 0.01-7.5 µg/dL (normal range: 0.05-0.2 µg/dL), with a mean of 0.907 µg/dL ±1.37 µg/dL. Only eight (6%) patients had low values, four from HNC group and four from ND group. No statistically
sig-niicant differences were detected between the two groups (t125=0.235, P=0.814). Six patients with low values were from the elderly group, two from the younger patients group. No patients from the low Cr group presented Diabetes or glucose intolerance.
• Albumin and transferrin serum concentrations
One hundred twenty-nine patients were evaluated. Albumin, presented a mean of 3.4g/dL ±0.35 ranging from 1.4 to 5.2 g/ dL (normal range 3.5-5 g/dL). Half of the patients 54% (n=70) presented low albumin. Transferrin obtained a mean of 183.0 mg/ dL ranging from 74 to 331 mg/dL (normal range 200-300 mg/dL). More than half, 85 (66%) patients, presented low levels of trans-ferrin. Almost half of the, 57 patients (n=57; 44%), presented low levels of both proteins.
• Albumin, transferrin and serum Cr concentrations
A signiicant positive correlation was found between albumin and Cr (r=0.217, P=0.012).
• BMI and serum proteins concentrations
No statistically signiicant differences in proteins were found between underweighted (mean=6.419 g/dL) and normal BMI pa-tients (mean=6.367 g/dL) (t126=0.375, P=0.708). Only 35 patients (24.3%) showed simultaneously low BMI, albumin and transferrin.
• BMI and serum Cr concentrations
No statistically signiicant differences were found between BMI and Cr.
Follow-up
After 4 weeks of PEG procedure, 75 patients were followed up (49 men, 26 women).
• Cr: From the initial eight patients with low Cr, three patients maintained their low values, one improved their values, two were lost to follow-up, and 2 died. From the initial 121 pa-tients with normal Cr, 71 maintained their values, 21 were lost to follow-up, 27 died, and two were not compliant with PEG feeding and his tube was removed.
• Albumin: From 75 patients, 27 (36%) had values under normal, and 48 (64%) patients had normal values. From the previous evaluation (T0) 31 patients maintained normal values, 25 maintained low values, 2 decreased values and 17 increased their values from low to the normal range. Looking at the two main study groups, similar mean was found for albumin with 3.9 g/L from HNC and 3.53 g/L from ND.
• Transferrin: From 75 patients, 39 (52%) had values under normal, and 36 (48%) patients had normal values. From the previous evaluation (T0) 25 patient maintained normal values, 38 maintained low values, 1 decreased values and 11 increased their values from low to the normal range. Looking at the two main study groups (HNC and ND) a similar mean was found of 205.37 mg/dL from HNC and 187.72 mg/dL from ND.
• BMI: The mean BMI for the youngest group was 19.88 Kg/ m2,
and 20.98 Kg/m2 for the older group. Considering two main
study groups, a mean of 19.88 Kg/m2 was found for HNC
and 20.82 Kg/m2 for ND. According age and underlying
disease a mean of 19.86 Kg/m2 was found for HNC and 20.43
Kg/m2 for ND from youngest group and 19.91 Kg/m2 and
21.20 Kg/m2 for HNC and ND for the older. No signiicant
differences were found.
TABLE 1. Characteristics of the study population (n=129)
Characteristics n=129
Age Years
Máx 95
Min 26
Mean (SD) 68.4 (14.2)
≥ 65 years 81
< 65 years 48
Gender
Female 49
Male 80
GROUP DIAGNOSIS 52
Head neck cancer 8
Oral cavity 0
Pharynx 14
Larynx 10
Proximal esophagus 77
Neurological dysphagia
Stroke 24
Dementia 18
Neurosurgical injury 21 Amyotrophic lateral sclerosis 5
After 12 weeks of PEG procedure, follow-up on 32 patients was performed. Four patients died between the 4th and the 12th week after gastrostomy. Thirty-seven were lost to follow-up and PEG was removed in two of them.
• Cr – All 32 (100%) patients had normal serum Cr concen-tration. From the previous evaluation with 72 patients with normal Cr 31 maintained their values. From the three patients with low values, one improved their values and two were lost. Looking at the two-main study groups a similar mean for Cr was found.
• Albumin – Thirty-two patients were evaluated, 24 (75%) had normal values, while 8 (25%) had values under normal range. From the previous evaluation (T1), 22 patients maintained normal values, 8 maintained low values and 2 increased their values from low to the normal range. Looking at the two-main study groups a similar mean was found for albumin with 4.06 g/L for HNC and 3.57 g/L for ND.
• Transferrin – Thirty-two patients were evaluated, 21 (66%) had normal values while 11 (34%) were under normal range. From the previous evaluation (T1), 20 maintained values into normal range, 1 improved their values into normal range, 10 maintained their values low and 1 decreased for low values. Looking at the two-main study groups a similar mean was found for transferrin with 226.12 mg/dL from HNC and 211.61 mg/dl from ND.
• BMI – For the youngest group BMI presented a mean of 20.22 Kg/m2, and a mean of 21.51 Kg/m2 for the older group.
Looking at the two main study groups a mean of 20.46 Kg/ m2 was found for HNC and 20.48 Kg/m2 for ND. By age and
underlying disease, a mean of 20.78 Kg/m2 was found from
HNC and 18.99 Kg/m2 from ND in the youngest group, and
20.14 Kg/m2 and 21.96 Kg/m2 from HNC and ND respectively
in the older group. No signiicant differences were found.
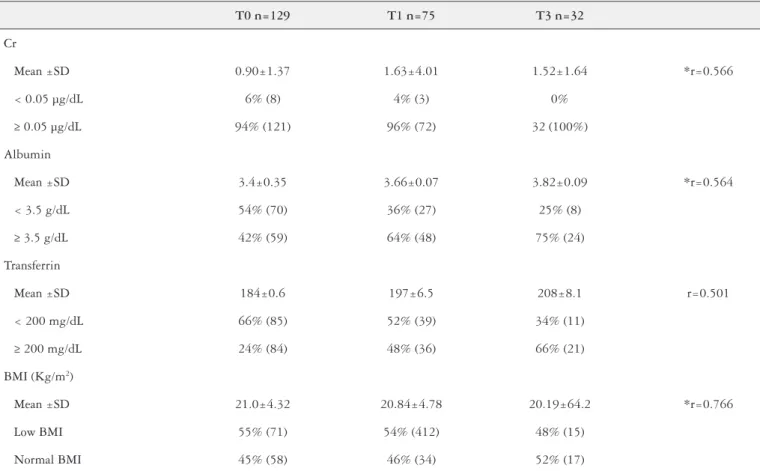
Evolution of Cr concentration after 4 weeks and 12 weeks, and its relationship with proteins and underlying diseases (Table 2)
Regarding the Cr in patients with ND, positive correlations with Cr were detected after four and twelve weeks (r=0.566). At the irst assessment, positive correlations of moderate intensity were detected with Albumin (r=0.375, P=0.005), both from the irst moment of assessment, and negative correlations of moderate intensity with BMI and Albumin, all at the third stage of evalu-ation (r=-0.428, P=0.047) and (r=-0.368, P=0.045) respectively. In the second evaluation moment, negative correlations were also detected with Albumin, both at the third evaluation moment. In patients with HNC, in addition to positive correlations with Cr at other evaluation moments, strong positive correlations were also detected with Transferrin (r=0.769, P=0.015).
Determinations of the association with etiology, Cr, BMI, Albumin, and Transferrin with survival time (Table 3)
No statistically signiicant differences in survival time were found between types of aetiology (χ2
LogRank(1) = 0.447, P = 0.504).
TABLE 2. Evolution of Chromium, Albumin, Transferrin and BMI serum concentrations and BMI values in follow-up
T0 n=129 T1 n=75 T3 n=32
Cr
Mean ±SD 0.90±1.37 1.63±4.01 1.52±1.64 *r=0.566
< 0.05 µg/dL 6% (8) 4% (3) 0%
≥ 0.05 µg/dL 94% (121) 96% (72) 32 (100%)
Albumin
Mean ±SD 3.4±0.35 3.66±0.07 3.82±0.09 *r=0.564
< 3.5 g/dL 54% (70) 36% (27) 25% (8)
≥ 3.5 g/dL 42% (59) 64% (48) 75% (24)
Transferrin
Mean ±SD 184±0.6 197±6.5 208±8.1 r=0.501
< 200 mg/dL 66% (85) 52% (39) 34% (11)
≥ 200 mg/dL 24% (84) 48% (36) 66% (21)
BMI (Kg/m2)
Mean ±SD 21.0±4.32 20.84±4.78 20.19±64.2 *r=0.766
Low BMI 55% (71) 54% (412) 48% (15)
Normal BMI 45% (58) 46% (34) 52% (17)
To determine which attributes are associated with survival time, independent variables included aetiology, Cr, BMI, Albumin, and Transferrin, all at irst assessment and applied in the Cox regres-sion. Regressors were found, as albumin at the irst assessment was associated with survival time (P=0.024) and there was an increase in survival of about 59% per additional unit of Albumin.
DISCUSSION
Patients suffered from long standing dysphagia, for more than 1 month, with daily oral intake below 50% of nutritional needs, thus having indication for immediately nutritional support by enteral feeding for long time. Guidelines recommended the use of PEG(10).
Home enteral feeding is a good choice for enteral feeding, because when compared to hospital stay it presents a lower cost, lower rate of infections and allows the patients stay at home in a comfortable environment. Most of the patients went home after the PEG procedure. All of them were fed with enteral homemade meals, since the commercial formulas are expensive and they are not reimbursed by the NHS, making their continued use impracti-cal for low-income families(8). Meals use mostly blended nutrients,
although it is sometimes dificult to reach the desired caloric density because manipulated foods are diluted due to the tube gauge, and the capacity to tolerate bolus is sometimes diminished(21).
The long-standing dysphagia had a direct impact in weight and in albumin and transferrin levels, but the behaviour of TE is unknown. Most of the patients displayed low serum proteins at the time of PEG procedure, relecting the reduced dietary intake and the activity of the underlying diseases. More than half (54%) of the patients presented low albumin and nearly two-thirds (66%) presented low transferrin. Almost half of the patients (46%) pre-sented low serum levels of both proteins. Looking at T1 and T3 (4 weeks and 12 weeks after PEG procedure, respectively), an increase in the proteins levels was found. The content of homemade meals with adjusted protein-energy intake seemed to be suficient to increase serum proteins.
For the implication in the metabolic pathways the identiication of important TE deiciency is mandatory. In previous studies, the Artiicial Nutrition Team identiied selenium deiciency in dys-phagic patients who underwent enteral feeding, but also a major deiciency in zinc with potential compromise of the metabolic and biochemical pathways(15-18). As far as the study is concerned no
studies were found with low serum Cr levels in enteral nutrition. The results were similar, low Cr was identiied only in few patients, 6% (eight patients) before PEG, 4% (three patients) after 4 weeks PEG feeding and 0% after 12 weeks. Long term dysphagia seems to induce low Cr only in a very small fraction of PEG patients and homemade PEG meals seem to be effective for normalizing serum
Cr. This could be partially attributed to the fact that Cr is widely distributed in food, like seafood, butter and oil.
Limitations of the study
The main limitation this study was the dificulty on controlling which ingredients the patients were using at home to prepare their meals. Despite the efforts to clearly register the right quantities and ingredients the patients should use at home, it is uncertain if they behave according to the recommendations.
The follow-up of these PEG patients is very dificult, creating a limitation to the study. There was a big percentage of dropouts together with a share of PEG feeding incompliance and tube re-moval. The team uses routinely the predictive model that foretells high mortality risk in PEG patients during the irst 3 weeks after the procedure, as previously described and high risk patients are selected for nasogastric tube feeding(6). Nevertheless, some patients
may die in the irst few weeks. Also, some patients were either sent away to distant institutions, or lack suficient social support. These limitations may explain the small number of published studies focusing long term follow-up of PEG patients.
CONCLUSION
Most dysphagic PEG patients that underwent endoscopic gas-trostomy present normal serum Cr when gasgas-trostomy is performed. Low serum Cr seems to be unrelated with glycaemia, gender, nature of the underlying disorders, normal or low BMI, serum albumin or transferrin. The results also suggest that, for the minority of pa-tients displaying low serum Cr before gastrostomy, homemade PEG meals seem to be effective for normalizing serum values and teams taking care of PEG patients need not to be concerned about Cr.
ACKNOWLEDGEMENTS
We acknowledge of the patients included in this article and their caregivers.
Authors’ contributions
All authors have made substantial contributions and final approval the conceptions, drafting, and inal version. Santos CA, conceived and design the study, collected and conducted the data analysis, drafted the manuscript, and inal approval de version to be submitted. Fonseca J, analysed and interpreted of data, revised and contributed to inal approval of the version to be submitted. Carolino E analyzed and played of data, revised and contributes to inal approval. Guerreiro AS, conceived and design the study, revised and contributed to inal approval of the version to be submitted. All authors had read and approved the manuscript.
TABLE 3. Results of Cox Regression: Dependent variable – Survival time (days); Independent Variables -Cr moment 0, IMC moment 0, Albumin moment 0, Transferrin moment 0 and etiology.
Variables in the Equation
B SE Wald df Sig. Exp (B) 95,0% CI for Exp (B) Lower Upper
Cr moment 0 -0.050 0.142 0.125 1 0.724 0.951 0.721 1.255
IMC moment 0 -0.065 0.047 1.940 1 0.164 0.937 0.855 1.027
Albumin moment 0 -0.899 0.398 5.090 1 0.024 0.407 0.186 0.889
Transferrin moment 0 0.004 0.006 0.362 1 0.547 1.004 0.991 1.017
REFERENCES
1. Ali A, Ma Y, Reynolds J, Wise JP Sr, Inzucchi SE, Katz DL. Chromium effects on glucose tolerance and insulin sensitivity in persons at risk for diabetes mellitus. Endocr Pract. 2011;17:16-25.
2. Cefalu WT, Hu FB. Role of Chromium in Human Health and in Diabetes. Diabetes Care. 2004;27:2741-51.
3. Clarkson PM. Effects of exercise on chromium levels: Is supplement required Sports Med. 1997;23:341-9.
4. EFSA. Scientiic opinion of the Panel on Food Additives and Nutrient Sources added to Food on chromium nitrate as a source of chromium added for nutri-tional purposes to food supplements following a request from the European Commission. EFSA Journal. 2009;1111:1-19.
5. Fébel H, Szegedi B, Huszar S. Absorption of inorganic, trivalent and hexava-lent chromium following oral and intrajejunal doses in rats. Acta Vet Hung. 2001;49:203-9.
6. Fonseca J, Santos CA, Brito J. Predicting survival of endoscopic gastrostomy candidates using the underlying disease, serum cholesterol, albumin and trans-ferrin levels. Nutr Hosp. 2013;28:1280-5.
7. Freund H, Atamian S, Fischer JE. Chromium deiciency during total parenteral nutrition. JAMA. 1979;241:496-8.
8. Hebuterne X, Bozzetti F, Moreno Villares JM, Pertkiewicz M, Shaffer J, Staun M, Thul P, Gossum A. Home enteral nutrition in adults: a European multicentre survey. Clin Nutr 2003;22:261-6.
9. Kondrup J, Rasmussen HH, Hamberg O, Stanga Z; Ad Hoc ESPEN Working Group. Nutritional Risk Screening (NRS-2002): a new method based on an analysis of controlled clinical trials. Clin Nutr. 2003;22:321-66.
10. Löser C, Aschl G, Hébuterne X, Mathus-Vliegen EM, Muscaritoli M, Niv Y, et al. ESPEN guidelines on artiicial enteral nutrition-percutaneous endoscopic gastrostomy (PEG). Clin Nutr. 2005;24:848-61.
11. Melo V, Cuamatzi O. Bioquimica de los procesos metabólicos. Barcelona and Mexico D.F.:Reverte; 2007.
12. Pereira M, Santos CA, Fonseca J. Body mass index estimation on gastrostomy patients using the mid upper arm circumference. J Aging Res Clin Practice. 2012;1:252-3.
13. Powell-Tuck J, Hennessy E. A comparison of mid upper arm circumference, body mass index and weight loss as indices of undernutrition in acutely hospitalized patients. Clin Nutr. 2003;22:307-12.
14. Roussel AM, Andriollo-Sanchez M, Ferry M, Bryden NA, Andersen RA. Food chromium content, dietary chromium intake and related biological variables in French free-living elderly. Br J Nutr. 2007;98:326-31.
15. Santos CA, Fonseca J, Carolino E, Lopes T, Sousa Guerreiro A. Selenium in dysphagic patients who underwent endoscopic gastrostomy for long term enteral feeding. Nutr Hosp. 2015;32:2725-33.
16. Santos CA, Fonseca J, Carolino E, Sousa Guerreiro A. Serum trace elements in dysphagic gastrostomy candidates before endoscopic gastrostomy for long term enteral feeding. Clin Nutr. 2016;35:718-23.
17. Santos CA, Fonseca J, Brito J, Fernandes T, Gonçalves L, Sousa Guerreiro A. Serum Zn levels in dysphagic patients who underwent endoscopic gastrostomy for long term enteral nutrition. Nutr Hosp. 2014;29:359-64.
18. Santos CA, Fonseca J, Carolino E, Lopes T, Sousa Guerreiro A. Serum zinc evolution in dysphagic patients that underwent endoscopic gastrostomy for long term enteral feeding. Asia Pac J Clin Nutr. 2017;26:227-33.
19. Schwartz K, Mertz W. A glucose tolerance factor and its differentiation from factor 3. Arch Biochem Biophys. 1957;72:515-8.
20. Shenkin A. Vitamins and trace elements. In: Burtis CA, Ashwood ER, Bruns DA, editors. Textbook of clinical chemistry and molecular diagnosis. 4th ed. St Louis: Elservier Saunders; 2006.
21. Sousa LRM, Ferreira SMR, Schieferdecker MEM. Physicochemical and nutri-tional characteristics of handmade enteral diets. Nutr Hosp. 2014;29:568-74. 22. Vincent JB. Chromium: is it essential, pharmacologically relevant, or toxic? Met
Ions Life Sci. 2013;13:171-98.
23. Vincent JB. The Biochemistry of Chromium. J Nutr. 2000;130:715-8. 24. Yu S, Visvanathan T, Field J, Ward LC, Chapman I, Adams R, et al. Lean body
mass: the development and validation of predicted equations in healthy adults. BMC Pharmacol Toxicol. 2013;14:53.
25. WHO: Technical report series. Obesity: preventing and managing the global epidemic Report of a WHO Consultation (WHO Technical Report Series 894). World Health Organization Geneva 2000; 242.
26. Zima T, Mestek O, Tesar V, Tesarová P, Nĕmecek K, Zák A, Zeman M. Chromium levels in patients with internal diseases. Biochem Mol Biol Int. 1998;46:365-74.
Santos CA, Fonseca J, Carolino E, Guerreiro AS. O Cromo sérico baixo é raro em doentes submetidos a gastrostomia endoscópica para nutrição entérica de longa duração. Arq Gastroenterol. 2017;54(3):211-6.
RESUMO – Contexto – Doentes submetidos a gastrostomia endoscópica percutânea apresentam desnutrição energético-proteica. Os elementos traço são necessários em pequenas quantidades e o Cromo (Cr) tem um papel importante no metabolismo. Objectivo – Pretendeu-se avaliar os níveis séricos de Cr e sua relação com as proteínas séricas, índice de massa corporal (IMC) e as doenças subjacentes nos primeiros 3 meses de alimentação por
gastrostomia endoscópica percutânea. Métodos – Estudo prospetivo observacional durando 3 meses: avaliações no momento do procedimento (T0),
após 4 (T1) e 12 semanas (T3). A avaliação inicial incluiu: idade, gênero, doença subjacente, Nutricional Risk Screening 2002, IMC, concentração sérica de Cr, albumina e transferrina. Em T1 e T3, colheu-se sangue para Cr, albumina e transferrina. Para avaliação do Cr, utilizou-se espectrometria de absorção atómica em forno de graite. Classiicaram-se os doentes em dois grupos: neoplasias cervicofaciais (NCF) e disfagia neurológica (DN). Todos foram alimentados com alimentos de preparação doméstica. Resultados – Avaliaram-se 129 doentes (80 homens), entre 26-95 anos: NCF-52; DN-77. Encontraram-se valores baixos do IMC-71; Cr-8, albumina-70, transferrina-85 e 57 com ambas as proteínas baixas. Identiicou-se correlação com signiicado estatístico entre a albumina e Cr (r=0,217, P=0,012) e entre a albumina e tempo de sobrevivência (P=0,024). Foi observada boa evolução do Cr e proteínas, não sendo encontrados valores baixos de Cr em T3. Conclusão – O Cr baixo é raro em doentes com gastrostomia endoscópica per-cutânea, sem relação com outros parâmetros, incluindo o tipo de doença subjacente. Para a minoria dos doentes com Cr baixo antes da gastrostomia, refeições de preparação doméstica parecem ser adequadas.