INTRODUCTION
More than 2 billion people around the world have been infected by hepatitis B (HBV) and C (HCV) virus, resulting in approximately 400 million patients with advanced end chronicle liver disease. For the next 30 years, around 15%–40% of them will develop cirrhosis, hepatic failure, and hepatocellular carcinoma(30,34). The annual expenditure with HCV and advanced liver disease comprises more than 32 billion dollars, with increases over time. The number of patients with viral hepatitis is growing annually and some stu dies estimated an increase of 60% of this amount in the next few years(14,29,35,45).
The pretransplant period is complex and includes large quanti ties of procedures(19,22). To date, previous studies have shown that the increased severity of liver disease predisposes to a high number of hospitalizations, high costs procedures increased morbidity and a high number of deaths(12,13,41,46). Studies have shown that the cost of hospitalizations of patients with alcoholic cirrhosis overpass US$ 8 thousand each stay. The annual cost of health care in this patient can reach 848 million dollars in the USA annually(12,13). In
Higher MELD score increases the overall cost on
the waiting list for liver transplantation:
a micro-costing analysis based study
Jose Antonio Orellana
TURRI
1, Tassia Cristina
DECIMONI
2, Leandro Augusto
FERREIRA
3,
Marcio Augusto
DINIZ
4, Luciana Bertocco de Paiva
HADDAD
1and Alessandro Gonçalves
CAMPOLINA
5Received 7/3/2017 Accepted 10/4/2017
ABSTRACT – Background – The pretransplant period is complex and includes lots of procedures. The severity of liver disease predisposes to a high
number of hospitalizations and high costs procedures. Economic evaluation studies are important tools to handle costs on the waiting list for liver transplantation. Objective – The objective of the present study was to evaluate the total cost of the patient on the waiting list for liver transplantation and the main resources related to higher costs. Methods – A cost study in a cohort of 482 patients registered on waiting list for liver transplantation was carried out. In 24 months followup, we evaluated all costs of materials, medicines, consultations, procedures, hospital admissions, laboratorial tests and image exams, hemocomponents replacements, and nutrition. The total amount of each resource or component used was aggregated and multiplied by the unitary cost, and thus individual cost for each patient was obtained. Results – The total expenditure of the 482 patients was US$ 6,064,986.51. Outpatient and impatient costs correspond to 32.4% of total cost (US$ 1,965,045.52) and 67.6% (US$ 4,099,940.99) respectively. Main cost drivers in outpatient were: medicines (44.31%), laboratorial tests and image exams (31.68%). Main cost drivers regarding hospitalizations were: medicines (35.20%), bed use in ward and ICU (26.38%) and laboratorial tests (13.72%). Patients with MELD score between 25–30 were the most expensive on the waiting list (US$ 16,686.74 ± 16,105.02) and the less expensive were those with MELD below 17 (US$ 5,703.22 ± 9,318.68). Conclusion – Total costs on the waiting list for liver transplantation increased according to the patient’s severity. Individually, hospitalizations, hemocomponents reposition and hepatocellular carcinoma treatment were the main cost drivers to the patient on the waiting list. The longer the waiting time, the higher the total cost on list, causing greater impact on health systems.
HEADINGS – Health evaluation. Costs and cost analysis. Waiting lists. Liver transplantation.
Declared conflict of interest of all authors: none Disclosure of funding: no funding received
1 Departamento de Gastroenterologia, Faculdade de Medicina, Universidade de São Paulo, SP, Brasil; 2 Departamento de Medicina Preventiva, Faculdade de Medicina, Universidade de São Paulo, SP, Brasil; 3 Departamento de Estatística, Instituto de Matemática e Estatística, Universidade de São Paulo, SP, Brasil; 4 Centro de Bioestatística e Bioinformática, Instituto de Estudos do Câncer Samuel Oschin, Los Angeles, Estados Unidos; 5 Centro de Pesquisa Translacional em Oncologia, Instituto do Câncer do Estado de São Paulo, Faculdade de Medicina, Universidade de São Paulo, SP, Brasil.
Correspondence: Jose Antonio Orellana Turri. Departamento de Gastroenterologia, Faculdade de Medicina, Universidade de São Paulo. Av Dr. Enéas de Carvalho Aguiar, 455 – CEP: 01246-903 – São Paulo, SP, Brasil. E-mail: [email protected]
Brazil, the annual cost of heath care of each patient with advanced liver disease can reach more than 20 thousand dollars(1,2,11,27,28,38,44,49). Some correlated disease has strong linkage with high costs procedures and hospitalizations. Hepatocellular carcinoma is a malignancy associated with a high rate of mortality and costs(4). Hepatocellular carcinoma (HCC) currently, affects 1.5% of the world population and reach approximately 15% of patients on the waiting list for liver transplantation(1,11,21). Mishra et al.(28) has demonstrated that the costs of treating patients with HCC in 2009 were around US$ 31 thousand, with total treatment costs of ap proximately US$ 2 billion in the USA.
Patient’s severity, waiting time, highcost procedures and medications, and hospitalizationrelated complications increase the number of employed resources and consequently the patient’s costs, making these expenses increasingly important in the sum total of costs of these patients(2,14,46).
can lead to differences between € 855 and € 3221 in the cost per day with hospitalizations.
In studies carried out with microcosting methodology, all the relevant components and resources are individually raised to the highest level of detail possible(7,9,10,23,39). This methodology increases the accuracy of the cost estimate and relects the truthful use of the resources and their economic value through the detailed data collec tion of each resource used and the unit value of these resources(48). Lack of detail, bias or underestimated analysis of costs may result in failures in the cost evaluation of diseases or programs under analysis with considerable implications(5).
There is a growing interest of governments and health systems in economic evaluation studies that can improve the way in which limited budget resources allocated to patient care are shared out(8,15,37,42,47). Health technology assessment helps to achieve this purpose, making it possible to identify areas that require more in vestment and interventions associated with higher costs. The objec tive of this study was to determine the total cost of patients on the waiting list for liver transplantation and the resources that caused a greater impact on these costs, using microcosting methodology.
METHODS
This was a prospective cohort study that included all patients on waiting list for liver transplantation attended at Clinics Hospital, Sao Paulo Medical School (HCFMUSP) between January 2012 and December 2013. An economic evaluation study using micro costing methodology was carried out. The hospital perspective was taken in the measurement of resource use and costs by patients within the followup.
For each patient included in this study, patient demographics, clinical and overall cost were obtained. The amounts of resources (in units) were obtained using datasheet developed speciically for this study and individual data for each patient were registered. The followup period was individually calculated by the inclusion date of the listed patient until one of the following outcomes: list removal for improvement or worsening of the clinical health status, death, hospitalization for transplantation or completion of the study.
The MELD (Model of EndStage Liver Disease) values were calculated for each patient on the day of enrollment and on the irst day of hospitalization using the logarithmic formula of the results of the creatinine, total bilirubin, and INR tests.
[MELD = 3.78 [Ln serum bilirubin (mg/dL)] + 11.2 [Ln INR] + 9.57 [Ln serum creatinin (mg/dL)] + 6.43]
Four groups of patients were formed according to their MELD score severity based on the quartiles. This approach was carried out to better separate the groups with fewer outliers values and reach a better homogeneity intra quartiles.
The amounts of resources were directly obtained from differ ent care sectors.
The total amount of medication used per patient was obtained by the hospital pharmacy sector through a computerized prescrip tion system and a number of materials used were obtained from a data sheet developed for this study and illed in by the Nursing Service during the patient’s hospitalization. The quantities of labo ratory tests and imaging were obtained directly in the electronic patient’s database. The total number of consultations performed
by medical and nonmedical professionals was obtained directly from the electronic database of each patient. Regarding nutrition, the total quantities of diets received were obtained directly from the patient’s electronic database by medical prescription. The total amounts of paracentesis, lasks, and albumin used per patient were provided directly by the nursing service of this sector. The amounts of dialysis performed were obtained from the patient’s electronic database. The total amount of blood bags received per patient in hospitalizations were obtained directly in the electronic medical database of the hospitalized patient.
Cost data
The costs of each resource represent the costs of purchasing inputs and services by the hospital and do not represent the “full” price practiced by the pharmaceutical service or other market research inputs. Indirect costs were not included in this study. All costs were added together for the calculation of total cost per patient. Resources were divided into outpatient costs and hospi talization costs.
Outpatient costs included all services related to medical, dental, psychological, nutritional, nursing and social service consultations per patient were quantiied and analyzed. We also considered the costs of procedures such as paracentesis and dialysis, materials, medicines, laboratory and imaging tests. Inpatient charges included all costs related to materials, medications, laboratory and imaging exams, procedures performed, blood transfusions, the length of stays and costs related to nursing and ICU diaries were quantiied and analyzed.
The cost values of medication and materials were obtained from the Materials Administration System (MAS), where updated values of the last trading sessions paid for each item are recorded. The cost values of each image examination were obtained from the specialized department of each sector. The cost values of each laboratorial test were obtained at the hos pital’s central laboratory. Human resources costs were obtained directly from the administrative and managerial sector of the hospital and were calculated by the total amount of the wages received (including vacations, 13th salary, premiums, overtime surcharges, and withdrawals, etc.) divided by the total number of visits monthly and by the time spent in each service. The values of each type of enteral diet were determined by the Division of Nutrition and the values for parenteral diets were determined by the Division of Pharmacy. The values of each resource used for paracentesis, ambulatory dialysis and dialysis in hospitalization were provided by the Material Administration System (MAS) and directly by the department responsible for the procedure. The values of each blood component were obtained directly from the Hemotherapy Department through the administrative systems of cost management in this sector.
Procedures related to the treatment of hepatocellular carci noma were obtained directly from the Institute of Cancer of the State of Sao Paulo (ICESP) using the methodology of absorption costing. The amounts of procedures performed and the costs were provided by the electronic databases of this hospital and are related to all resources and services used for each procedure, human resources, materials and related drugs and divided by the number of patients attended.
of the cost of daily hospital bed included amounts spent by the sector on human resources, specialized cleaning services, cloakroom sterilization, electric power, medical gasses and telephone calls. The total cost was obtained and values of bed use were calculated and divided for the number of patients attended.
Statistical analysis
Statistical analysis was performed using the R software version 3.3.1(33). In all cases, the level of signiicance considered was 5%. The categorical data were presented in percentages and the cost data were presented in averages, standard deviations, and ranges.
To analyses the cost differences by the MELD groups was per formed using the ANOVA test for variables that follow a normal distribution (AndersonDarling test) and for variables that do not follow normality, the KruskalWallis test. The assumption of Normality was veriied by AndersonDarling test and homogeneity of variances by Levene test. Multiple comparisons were done by Tukey’s parametric and nonparametric tests.
For comparative analysis, in addition to the total values, the costs per day (total cost/day) and the costs per day in hospitaliza tion (hospitalization cost/day) were also presented.
RESULTS
In this study, 482 patients were regularly included on the waiting list for liver transplantation. Among them, 134 patients were trans
planted (27.8%), 103 patients were removed from the list (21.4%), 66 patients died (13.9%) and 179 patients (36.9%) remained on the list until the end of the study.
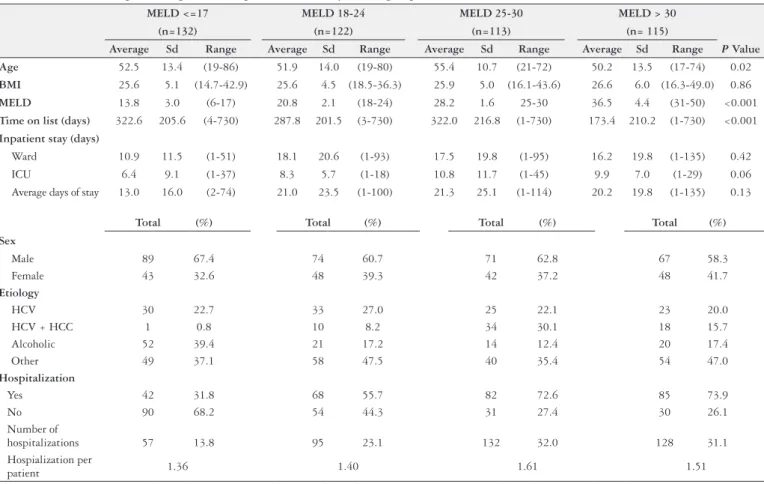
The most frequent etiology was cirrhosis caused by hepatitis C virus (HCV) in 187 patients (38.8%), followed by alcoholic cirrho sis in 152 (31.5%). There were 301 male patients (62.4%) and 181 female patients (37.6%). There were 277 patients requiring hospi talizations (69.25%), with 412 admissions in total and an average of 1.4 hospitalizations per patient. The clinical and demographic data of patients divided by MELD group, procedures performed, wai ting time and numbers of hospitalizations are presented in Table 1. Patients were divided into four groups by MELD score to verify the differences in cost. 132 patients had MELD below or equal to 17 (27.39%), 122 patients with MELD between 18 and 24 (25.31%), 113 patients with MELD between 25 and 30 (23.44%) and 115 patients with MELD above 30 (23.86%).
The total expenditure of the 492 patients followed by 24 months on the waiting list for liver transplant was US$ 6,064,986.51 and of these total, (US$ 1,965,045.52) 32.4% cost in outpatient care and (US$ 4,099,940.99) 67.60% cost in hospitalizations.
In outpatient care, there were 10,638 consultants in physician and medical team (8.96% of total cost), 167,182 laboratory tests and image exams (31.68% of total cost), 3,062,209 unitary doses of medicines and drugs (44.31% of total cost). In hospitalizations, there were 5,017 days of stays (26.38% of total cost), 276,890 laboratory tests and image exams (16.72% of total cost) and
TABLE 1. Clinical and epidemiological data of patients divided by MELD group (N=492)
MELD <=17 MELD 18-24 MELD 25-30 MELD > 30
(n=132) (n=122) (n=113) (n= 115)
Average Sd Range Average Sd Range Average Sd Range Average Sd Range P Value
Age 52.5 13.4 (19-86) 51.9 14.0 (19-80) 55.4 10.7 (21-72) 50.2 13.5 (17-74) 0.02
BMI 25.6 5.1 (14.7-42.9) 25.6 4.5 (18.5-36.3) 25.9 5.0 (16.1-43.6) 26.6 6.0 (16.3-49.0) 0.86
MELD 13.8 3.0 (6-17) 20.8 2.1 (18-24) 28.2 1.6 25-30 36.5 4.4 (31-50) <0.001
Time on list (days) 322.6 205.6 (4-730) 287.8 201.5 (3-730) 322.0 216.8 (1-730) 173.4 210.2 (1-730) <0.001
Inpatient stay (days)
Ward 10.9 11.5 (1-51) 18.1 20.6 (1-93) 17.5 19.8 (1-95) 16.2 19.8 (1-135) 0.42 ICU 6.4 9.1 (1-37) 8.3 5.7 (1-18) 10.8 11.7 (1-45) 9.9 7.0 (1-29) 0.06 Average days of stay 13.0 16.0 (2-74) 21.0 23.5 (1-100) 21.3 25.1 (1-114) 20.2 19.8 (1-135) 0.13
Total (%) Total (%) Total (%) Total (%)
Sex
Male 89 67.4 74 60.7 71 62.8 67 58.3
Female 43 32.6 48 39.3 42 37.2 48 41.7
Etiology
HCV 30 22.7 33 27.0 25 22.1 23 20.0
HCV + HCC 1 0.8 10 8.2 34 30.1 18 15.7
Alcoholic 52 39.4 21 17.2 14 12.4 20 17.4
Other 49 37.1 58 47.5 40 35.4 54 47.0
Hospitalization
Yes 42 31.8 68 55.7 82 72.6 85 73.9
No 90 68.2 54 44.3 31 27.4 30 26.1
Number of
hospitalizations 57 13.8 95 23.1 132 32.0 128 31.1 Hospialization per
patient 1.36 1.40 1.61 1.51
226,865 units of medicines and drugs (35.2% of total cost). The main resources, quantities and average values are shown in Table 2.
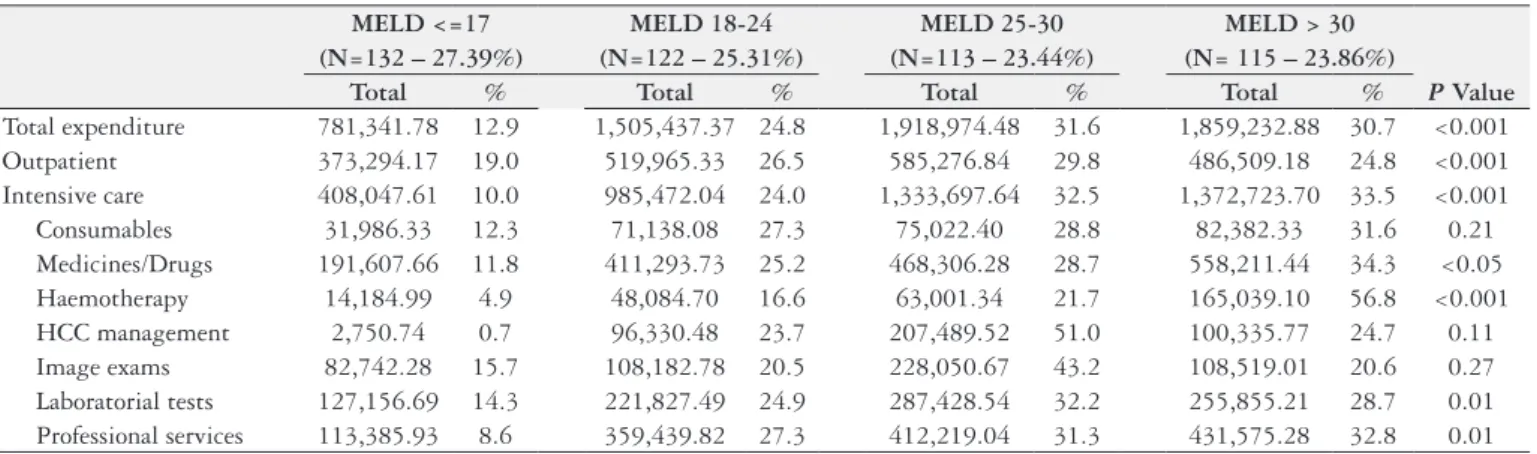
The total expenditure for each MELD score group, the total cost, and percentage of the total expenditure of main resources are shown in Table 3.
The total cost of patients on the waiting list for liver transplan tation was higher in those with MELD score between 25 and 30 (US$ 16,686.74±16,105.02) and lower among those with MELD below 17 (US$ 5,703.22±9,318.68). However, such average totals are directed related to the length of stay of patients in the hospital.
TABLE 3. Total expenditure of each MELD score group. (US$)
MELD <=17 MELD 18-24 MELD 25-30 MELD > 30 (N=132 – 27.39%) (N=122 – 25.31%) (N=113 – 23.44%) (N= 115 – 23.86%)
Total % Total % Total % Total % P Value
Total expenditure 781,341.78 12.9 1,505,437.37 24.8 1,918,974.48 31.6 1,859,232.88 30.7 <0.001
Outpatient 373,294.17 19.0 519,965.33 26.5 585,276.84 29.8 486,509.18 24.8 <0.001
Intensive care 408,047.61 10.0 985,472.04 24.0 1,333,697.64 32.5 1,372,723.70 33.5 <0.001
Consumables 31,986.33 12.3 71,138.08 27.3 75,022.40 28.8 82,382.33 31.6 0.21
Medicines/Drugs 191,607.66 11.8 411,293.73 25.2 468,306.28 28.7 558,211.44 34.3 <0.05 Haemotherapy 14,184.99 4.9 48,084.70 16.6 63,001.34 21.7 165,039.10 56.8 <0.001 HCC management 2,750.74 0.7 96,330.48 23.7 207,489.52 51.0 100,335.77 24.7 0.11 Image exams 82,742.28 15.7 108,182.78 20.5 228,050.67 43.2 108,519.01 20.6 0.27 Laboratorial tests 127,156.69 14.3 221,827.49 24.9 287,428.54 32.2 255,855.21 28.7 0.01 Professional services 113,385.93 8.6 359,439.82 27.3 412,219.04 31.3 431,575.28 32.8 0.01
MELD: Model of End-Stage Liver Disease; HCC: hepatocellular carcinoma
TABLE 2. Direct Costs of procedures and treatments. Total number and average unit cost of main resources utilized of patients on waiting list for liver transplant. (US$)
Outpatient Inpatient
Total amount
Unit
Price Total Cost %
Total amount
Unit
Price Total Cost %
Human Resources Hospitalization
Physician 6,396 27.53 176,081.88 8.96 Ward days 4,003 136.76 547,450.28 13.35 Psicology 1,506 11.88 17,891.28 0.91 ICU days 1,014 527.20 534,580.80 13.03 Nutitionist 600 9.22 5,532.00 0.28 Laboratoryal tests* 275,043 2.03 558,336.60 13.61 Odontologist 295 14.12 4,165.40 0.21 Image exams
Case-worker 312 13.77 4,296.24 0.22 MNR 20 385.90 7,718.00 0.18 Nursery 1,529 10.37 15,855.73 0.81 Biopsy 28 175.82 4,922.96 0.12
Laboratory tests* CT 204 152.13 31,034.52 0.75
Laboratoty tests 164,498 2.03 333,930.94 16.99 US 258 95.47 24,631.26 0.60
Image exams XR 1,082 21.03 22,754.46 0.55
Colangiography 39 922.32 35,970.48 1.83 Other* 255 148.66 37,908.30 0.91 MNR 85 385.90 32,801.50 1.67 Food/Meal/Diet 4,720 25.78 121,681.60 2.96 CT 249 152.24 37,907.76 1.93 Consumables* 67,590 3.85 260,221.50 5.34 US 437 95.57 41,764.09 2.13 Medicines
XR 398 9.61 3,824.78 0.19 ATB* 21,275 5.06 35,591.58 0.86 Endoscopy 584 19.99 11,674.16 0.59 Ativirals* 3,116 82.47 388,999.04 9.38 Other* 892 139.99 124,871.08 6.35 Imunosupress* 2,870 3.82 2,528.63 0.06
Medicines Heart drugs* 16,087 17.30 172,943.41 4.21
ATB* 102,688 30.37 13,237.61 0.68 Gastric Drugs* 25,524 0.38 25,253.83 0.61 Ativirals* 27,537 7.18 114,195.10 5.82 Antiinlamatories* 4,376 5.99 25,175.39 0.61 Immunosuppressants* 161,300 3.76 209,924.39 10.69 Other 153,617 5.48 836,897.67 19.47 Heart drugs* 128,995 0.62 13,056.62 0.67 HCC management
Gastric Drugs* 836,942 1.05 31,132.35 1.59 Chemoembolization 59 2,750.74 162,293.66 3.96 Anti-inlamatories* 69,527 0.20 18,465.30 0.94 Radiofrequency Abblation 26 4,818.04 125,269.04 3.06 Other 1,735,220 2.46 470,031.36 23.92 Hemotherapy
Paracentesis Plasma 576 145.92 84,049.92 2.05
Paracenthesis 631 112,78 71,164.18 3.62 Red Blood cells 531 153.14 81,317.34 1.98 Albumin units 3,207 37,56 120,454.92 6.13 Platelets 280 153.15 42,882.00 1.05 Bottles/Flasks 1,253 44,74 56,059.22 2.85 Aferesis 69 779.83 53,808.27 1.31
Total Ambulatory 1,965,045.52 100.00 Total Hospitalization 4,099,940.99 100.00
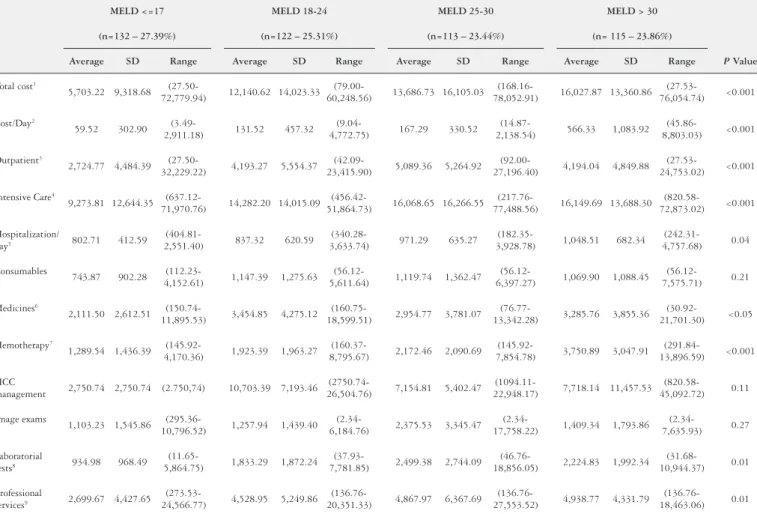
In this way, the cost/day related to each MELD group shows the relationship between the severity of disease and the costs over the time. We found that the more severe the patient, the greater its cost. The highest cost/day was found in those patients who had MELD >30 (US$ 566.33±1,083.92) followed by those with MELD 2530 (US$ 167.29±330.52). The total average cost per patient for each MELD score group are shown in Table 4.
DISCUSSION
Patients on the waiting list for liver transplantation are subject to a series of complications and intercurrences that lead to the
need for hospitalizations and procedures that increase the costs of care(17). This is the irst prospective cohort study that has used a microcosting methodology for the analysis of the total cost of patients on the waiting list for liver transplantation. Most studies, to date, do not address the patient’s total costs, and these high costs cannot be overlooked(2).
A standard methodology in microcosting was used so that accuracy of each patient costs was improved. This procedure in tended to ensure that the cost differences were related to real clinical practice and not to data acquisition failures or general averages.
In our study, we found that more severe patients have a subs tantially higher cost than less severe patients. Studies addressing
TABLE 4. Health Cost of Waiting List. Main resources utilization of patients on waiting list for liver transplantation divided by MELD score group. (US$)
MELD <=17 MELD 18-24 MELD 25-30 MELD > 30
(n=132 – 27.39%) (n=122 – 25.31%) (n=113 – 23.44%) (n= 115 – 23.86%)
Average SD Range Average SD Range Average SD Range Average SD Range P Value
Total cost1
5,703.22 9,318.68
(27.50-72,779.94) 12,140.62 14,023.33
(79.00-60,248.56) 13,686.73 16,105.03
(168.16-78,052.91) 16,027.87 13,360.86
(27.53-76,054.74) <0.001
Cost/Day2
59.52 302.90
(3.49-2,911.18) 131.52 457.32
(9.04-4,772.75) 167.29 330.52
(14.87-2,138.54) 566.33 1,083.92
(45.86-8,803.03) <0.001
Outpatient3
2,724.77 4,484.39
(27.50-32,229.22) 4,193.27 5,554.37
(42.09-23,415.90) 5,089.36 5,264.92
(92.00-27,196.40) 4,194.04 4,849.88
(27.53-24,753.02) <0.001
Intensive Care4
9,273.81 12,644.35
(637.12-71,970.76) 14,282.20 14,015.09
(456.42-51,864.73) 16,068.65 16,266.55
(217.76-77,488.56) 16,149.69 13,688.30
(820.58-72,873.02) <0.001
Hospitalization/
day5 802.71 412.59
(404.81-2,551.40) 837.32 620.59
(340.28-3,633.74) 971.29 635.27
(182.35-3,928.78) 1,048.51 682.34
(242.31-4,757.68) 0.04
Consumables
743.87 902.28
(112.23-4,152.61) 1,147.39 1,275.63
(56.12-5,611.64) 1,119.74 1,362.47
(56.12-6,397.27) 1,069.90 1,088.45
(56.12-7,575.71) 0.21
Medicines6
2,111.50 2,612.51
(150.74-11,895.53) 3,454.85 4,275.12
(160.75-18,599.51) 2,954.77 3,781.07
(76.77-13,342.28) 3,285.76 3,855.36
(30.92-21,701.30) <0.05
Hemotherapy7
1,289.54 1,436.39
(145.92-4,170.36) 1,923.39 1,963.27
(160.37-8,795.67) 2,172.46 2,090.69
(145.92-7,854.78) 3,750.89 3,047.91
(291.84-13,896.59) <0.001
HCC
management 2,750.74 2,750.74 (2.750,74) 10,703.39 7,193.46
(2750.74-26,504.76) 7,154.81 5,402.47
(1094.11-22,948.17) 7,718.14 11,457.53 (820.58-45,092.72) 0.11
Image exams
1,103.23 1,545.86
(295.36-10,796.52) 1,257.94 1,439.40
(2.34-6,184.76) 2,375.53 3,345.47
(2.34-17,758.22) 1,409.34 1,793.86
(2.34-7,635.93) 0.27
Laboratorial
tests8 934.98 968.49
(11.65-5,864.75) 1,833.29 1,872.24
(37.93-7,781.85) 2,499.38 2,744.09
(46.76-18,856.05) 2,224.83 1,992.34
(31.68-10,944.37) 0.01
Professional
services9 2,699.67 4,427.65
(273.53-24,566.77) 4,528.95 5,249.86
(136.76-20,351.33) 4,867.97 6,367.69
(136.76-27,553.52) 4,938.77 4,331.79 (136.76-18,463.06) 0.01
MELD: Model of End-Stage Liver Disease; HCC: Hepatocelullar Carcinoma; P value of all groups (Kruskal-Wallis test). P Value inter-groups (Non-Parametric Tukey test)
1. MELD <=17 and MELD 18-24 (P<0.001); MELD <=17 and MELD 25-30 (P<0.001); MELD <=17 and MELD>30 (P<0.001); MELD 18-24 and MELD 25-30 (P=0.002); MELD 18-24 and e MELD>30 (P=0.001).
2: MELD <=17 and MELD 18-24 (P<0.001); MELD <=17 and MELD 25-30 (P<0.001); MELD <=17 and MELD>30 (P<0.001); MELD 18-24 and MELD 25-30 (P=0.046); MELD 18-24 and MELD>30 (P<0.001); MELD 25-30 and MELD>30 (P<0.001)
3: MELD <=17 and MELD 18-24 (P=0.017); MELD <=17 and MELD 25-30 (P<0.001); MELD <=17 and MELD>30 (P=0.026); MELD 18-24 and MELD 25-30 (P=0.029). 4: MELD <=17 and MELD 25-30 (P=0.005); MELD <=17 and MELD>30 (P<0.001).
5: MELD <=17 and MELD 18-24 (P=0.012); MELD <=17 and MELD 25-30 (P=0.001); MELD <=17 and MELD>30 (P<0.001); MELD 18-24 and MELD>30 (P<0.001); MELD 25-30 and MELD>30 (P<0.001)
6: MELD <=17 and MELD 18-24 (P=0.001); MELD <=17 and MELD 25-30 (P<0.001); MELD <=17 and MELD>30 (P<0.001); MELD 18-24 and MELD>30 (P=0.003); MELD 25-30 and MELD>30 (P=0.049)
7: MELD <=17 and MELD>30 (P=0.006); MELD 18-24 and MELD>30 (P=0.032)
the relationship between patient costs and MELD have already pointed to this causal relationship(18,46). We also found that high costs are the result of a series of complications and intercurrences that lead to a greater number of hospitalizations and highcost procedures(13,17,20).
Although the total cost of patient care in our study was con sidered low, averaging just over US$ 12,000, compared to studies showing the annual cost of about US$ 20,000 in HCV patient care, we found that the cost of treating the most severely ill patient may exceed the costs of liver transplantation(26,30). Currently, the manage ment of the patient in the list is aimed at maintaining the patient’s health until the moment of transplantation and more effective and preventive actions can reduce the number of complications and hospitalizations.
Hemocomponents are a vital but expensive resource with a high increase in total cost. In patients with MELD >30, this cost is approximately 22% of the total cost and ive times higher than in patients with MELD <=17. Studies addressing the cost of replacement of blood components are rare, however we observed in a recent study that the cost of the blood component per bag in Brazil (approximately US$ 300) is similar to values found in other studies, ranging from US$ 210 to US$ 338(6,16,24,43). Coelho et al. showed that the replacement of blood components represented about 41% of the total cost(6).
In our study, the cost of human resources was 15% in the out patient clinic and 26% in hospitalizations, similar to other public hospitals in Brazil(32). McAdam found costs related to human re sources to be 19.8% and 23.3% of total costs(26). In another study, Oroz mentions that 32% to 44% of total costs are related to human resources, in the United States and OECD countries respectively(31). Materials and drugs accounted for 9.9% and 26.8% respectively of the total costs per patient. The use of highcost drugs for the treatment of the patient in the list raises the costs of this resource. In developed countries, this value represents a lower percentage in relation to the total costs per patient, between 12.5% and 13.7% with unstable cirrhosis and CHC patients, respectively(26).
Treatment of patients with hepatocellular carcinoma causes a large impact on the total cost of these patients, with an average of US$ 7700 (the second most relevant resource in total costs). In other studies, this igure reaches US$ 20,000 per year(25). Despite the high cost, treatment of hepatocellular carcinoma is a costeffective procedure, recommended for the cure and withdrawal of the patient from the waiting list for transplantation, in other settings(25).
Patients with MELD 2530 accounted for 31.6% of the total costs, 51% of all costs in HCC management, 43.2% of the total expenditure in image exams and 32.2% of all costs in laboratorial tests. These MELD group patients had 2.0, 2.2 and 75.4 times higher costs related to HCC management than those with MELD >30, 1824 and <=17 respectively.
Patients with MELD >30 accounted for 30.7% of the total costs, 33.5% of hospitalization costs, 56.8% of costs with blood components, and 34.3% of drug costs. These MELD patients had 2.6, 3.4 and 11.6 times higher costs related to replacement of blood components when compared to patients with MELD 2530, 1824 and <=17 respectively.
The data presented in this study had some limitations that should be highlighted. All resources were calculated using the
hospital costs, thus market values were not considered. This methodology can limit the comparison with other studies or with the costs of others hospitals. Furthermore, we decided not to use governmental reimbursement or similar tables of costs, because this could underestimate the cost data presented. The MELD value of each patient was calculated at the time of the inclusion on the waiting list or at the time of hospitalization. This procedure was necessary for the formation of MELD groups and posterior comparisons. The MELD evolution of each patient would be very dificult to perform in this study, but this is an important perspec tive for future studies.
When we analyzed the time length on the list, in relation to the cost/day and the total cost from each MELD score group, we found that the more severe patients remained less time on the list, but presented the highest cost/day. Considering the cost/day, patients with MELD >30 have cost/day 9.5 and 4.3 times more expensive than those with MELD <17 and 1824, respectively. Thus, it is possible to understand that, if the time on list of the more severe patients were longer, the total cost would be even higher, causing a high impact in the limited healthcare budgets.
Although, the data presented can be used as a subsidy for bet ter use of resources in the treatment of patients on the waiting list for liver transplantation and can provide important information, regarding frequency of complications, the percentage of resources and expenditures related to the severity of health status.
CONCLUSION
The patient’s waiting list cost for liver transplantation increases as the patient’s severity increases. Procedures related to the treat ment of the patient with hepatocellular carcinoma, the use of blood components and hospitalizations are the main cost drivers for the health care of these patients. As costs increase through time, it is also expected that the longer the time on waiting list, the higher the total costs and higher will be the economic impact in the limited healthcare budgets.
ACKNOWLEDGEMENTS
We would like to thank all the members of HCFMUSP and ICESP who helped us to develop this microcosting study for the patients on the waiting list. The authors would also like to acknowledge the professors Patrícia Coelho, Andréa Tenório and Juliana Yukari from Preventive Medicine Department of Sao Paulo Medical School for the explanations of how to interpret the data and how to better present the results.
Authors’ contributions
REFERENCES
1. Bodzin AS, Busuttil RW. Hepatocellular carcinoma: advances in diagnosis, man agement, and longterm outcome. World J Hepatol. 2015;7:1157–67. 2. Brand DA, Viola D, Rampersaud P, Patrick PA, Rosenthal WS, Wolf DC. Waiting
for a liverhidden costs of the organ shortage. Liver Transpl. 2004;10:1001–10. 3. Buchanan P, Dzebisashvili N, Lentine KL, Axelrod DA, Schnitzler MA, Salva laggio PR. Liver transplantation cost in the model for endstage liver disease era: looking beyond the transplant admission. Liver Transplant. 2009;15:1270–77. 4. Carrillo FJ, Mattos AA, Vianey AF, Vezozzo DC, Marinho F, et al. Brazilian
society of hepatology recommendations for the diagnosis and treatment of hepatocellular carcinoma. Arq Gastroenterol. 2015;52:2–14.
5. Charles JM, Edwards RT, Bywater T, Hutchings J. Microcosting in public health economics: steps towards a standardized framework, using the incredible years toddler parenting program as a worked example. Prev. Sci; 2013, pp. 377–89. 6. Coelho JCU, Wiederkehr JC, Lacerda MA, Campos ACL, Zeni Neto C, et al.
Custo do transplante hepático no hospital de clínicas da universidade federal do Paraná. Rev Assoc Med Bras. 1997;43:53–7.
7. Drummond MF, Sculpher MJ, Claxton K, Stoddard GL, Torrance GW. Me thods for the economic evaluation of health care programmes. Oxford: Oxford University Press, 1987.
8. Drummond MF. Economic evaluation of treatment strategies in gastroenterology. Am J Gastroenterol. 2005;100:2143–5.
9. Drummond MF, Sculpher MJ, Torrance GW, O’Brien BJ, Stoddart GL. Meth ods for the economic evaluation of health care programmes, second edition. By Oxford: Oxford University Press, 1997. Vol. 2. 43 pp.
10. Drummond MF, Sculpher MJ, Torrance GW, O’Brien BJ, Stoddart GL. Critical assessment of economic evaluation. In Method for the Economic Evaluation of Health Care Programmes. Oxford University Press. 2005, pp. 27–53.
11. ElSerag HB. Hepatocellular carcinoma: recent trends in the United States. Gastroenterology. 2004; 127:S27–34.
12. Farnsworth N, Fagan SP, Berger DH, Awad SS. 2004. ChildTurcottePugh versus MELD score as a predictor of outcome after elective and emergent surgery in cirrhotic patients. Am J Surg. 188:580–83.
13. Fink MA, Berry SR, Gow PJ, Angus PW, Wang BZ, et al. Risk factors for liver transplantation waiting list mortality. J Gastroenterol Hepatol. 2007;22:119–24. 14. Foxton MR, AlFreah MAB, Portal AJ, Sizer E, Bernal W, et al. Increased MELD score at the time of liver transplant results in prolonged hospitalization and overall intensive care unit costs. Liver Transplant. 2010;16:668–7.
15. Fragoso AV, Pedroso MR, Herman P, Montagnini AL, et al. Comparing the en zyme replacement therapy cost in post pancreatectomy patients due to pancreatic tumor and chronic pancreatitis. Arq Gastroenterol. 2016;53:94–7.
16. Fragoulakis V, Stamoulis K, Grouzi E, Maniadakis N. The cost of blood collec tion in Greece: an economic analysis. Clin Ther. 2014;36:1028–36.e5.
17. Gambato M, Lens S, Navasa M, Forns X. Treatment options in patients with decompensated cirrhosis, pre and posttransplantation. J Hepatol. 2014;61(1 Suppl):S12031.
18. Gordon SC, Pockros PJ, Terrault NA, Hoop RS, Buikema A, et al. Impact of disease severity on healthcare costs in patients with chronic hepatitis C (CHC) virus infection. Hepatology. 2012;56:1651–60.
19. Heidelbaugh JJ, Bruderly M. Cirrhosis and chronic liver failure: part I. diagnosis and evaluation. Am Fam Physician. 2006;74:756–62.
20. Heidelbaugh JJ, Sherbondy M. Cirrhosis and chronic liver failure: part II. com plications and treatment. Am Fam Physician. 2006;74:767–76.
21. Herman P, Lopes F de LM, Kruger JA, Fonseca GM, Jeismann VB, et al. Is re section of hepatocellular carcinoma in the era of liver transplantation worthwile? A single center experience. Arq Gastroenterol. 2016;53:169–74.
22. Jay CL, Skaro AI, Ladner DP, Wang E, Lyuksemburg V, et al. Comparative effectiveness of donation after cardiac death versus donation after brain death liver transplantation: recognizing who can beneit. Liver Transplant. 2012;18: 630–40.
23. Johnston K, Buxton M, Jones D, Fitzpatrick R. Assessing the costs of health care technologies in clinical trials. Health Technol Assess. (Rockv). 1999;3:176. 24. Kanavos P, Yfantopoulos J, Vandoros C, Politis C. The economics of blood:
gift of life or a commodity? Int J Technol Assess Health Care. 2006;22:338–43. 25. Llovet JM, Mas X, Aponte JJ, Fuster J, Navasa M, et al. Cost effectiveness of
adjuvant therapy for hepatocellular carcinoma during the waiting list for liver transplantation. Gut. 2002;50:1238.
26. McAdamMarx C, McGarry LJ, Hane CA, Biskupiak J, Deniz B, Brixner DI. All cause and incremental per patient per year cost associated with chronic hepatitis C virus and associated liver complications in the United States: a managed care perspective. J Manag Care Pharm. 2011;17:531–46.
27. Merion RM, Schaubel DE, Dykstra DM, Freeman RB, Port FK, Wolfe RA. The survival beneit of liver transplantation. Am J Transplant. 2005;5(September 2004):307–13.
28. Mishra A, Otgonsuren M, Venkatesan C, Afendy M, Erario M, Younossi ZM. The inpatient economic and mortality impact of hepatocellular carcinoma from 2005 to 2009: analysis of the US nationwide inpatient sample. Liver Int. 2013;33:1281–86.
29. Myers RP, Krajden M, Bilodeau M, Kaita K, Marotta P, et al. Burden of dis ease and cost of chronic hepatitis C infection in Canada. Can. J Gastroenterol Hepatol. 2014;28:243–50.
30. Neff GW, Duncan CW, Schiff ER. 2011. The current economic burden of cir rhosis. Gastroenterol Hepatol. 7:661–71.
31. Orosz E. The OECD System of Health Accounts and the US National Health. 2005.
Turri JAO, Decimoni TC, Ferreira LA, Diniz MA, Haddad LBP, Campolina AG. Altos valores de MELD aumentam o custo total em lista de espera para o transplante hepático. Um estudo de microcusteio. Arq Gastroenterol. 2017;54(3):23845.
RESUMO – Contexto – O período prétransplante é complexo e inclui grande quantidade de procedimentos. A gravidade da doença hepática predispõe
a um alto número de internações e procedimentos de alto custo. Estudos em avaliação econômica são uma importante ferramenta para o manejo dos custos em lista de espera para o transplante hepático. Objetivo – O objetivo do presente estudo foi avaliar o custo total do paciente em lista de espera para o transplante hepático e os principais recursos relacionados ao alto custo. Métodos – Foi realizado um estudo de coorte em 482 pacientes registrados em lista de espera para o transplante hepático. Os pacientes foram acompanhados por um período de 24 meses, no qual foram avaliados todos os custos de materiais, medicamentos, consultas, procedimentos internações, exames laboratoriais e de imagem, reposição de hemocomponentes e nutrição recebida. A quantidade total de cada recurso e componente utilizado foi obtida e multiplicada pelo seu valor unitário e, desta maneira, o custo individual de cada paciente foi obtido. Resultados – O total gasto pelos 482 pacientes foi de US$ 6.064.986,51. Os custos ambulatoriais cor responderam a 32,4% do total (US$ 1.965.045,52) e os custos em internação corresponderam a 67,6% do total (US$ 4.099.940,99). Os principais determinantes do custo em ambulatório foram: medicamentos (44,31%) e exames laboratoriais e de imagem (31,68%). Os principais determinantes de custo em internações foram: medicamentos (35,20%), utilização do leito em enfermaria e em UTI (26,38%) e exames laboratoriais (13,72%) Pacientes com valores de MELD entre 25–30 foram os de maiores custos em lista de espera (US$ 16.686,74 ± 16,105.02) e os de menor custo foram os pacientes com MELD abaixo de 17 (US$ 5.703,22 ± 9.318,68). Conclusão – O custo total em lista de espera para o transplante hepático aumenta de acordo com a gravidade do paciente. Individualmente, internações, reposição de hemocomponentes e o tratamento do paciente com carcinoma hepatocelular são os principais determinantes de custo para os pacientes em lista de espera para o transplante hepático. Quanto maior o tempo de espera, maiores serão os custos em lista, causando maior impacto nos sistemas de saúde.
32. Portela MP, Neri EDR, Fonteles MMF, Garcia JHP, Fernandes MEP. O custo do transplante hepático em um hospital universitário do Brasil. Rev Assoc Med Bras. 2010; 56:322–6.
33. R Core Team. R: A language and environment for statistical computing. 2014. Available from: http://www.rproject.org
34. Rajendra A, Wong JB. Economics of chronic hepatitis B and hepatitis C. J. Hepatol. 2007,47:608–17.
35. Razavi H, Waked I, Sarrazin C, Myers RP, Idilman R, et al. The present and future disease burden of hepatitis C virus (HCV) infection with today’s treatment paradigm. J Viral Hepat. 2014;21(Suppl):34–59.
36. Santos R, Miyazaki MCOS, Domingos NAM, Valério NI, Silva RF, Silva RCMA. Patients undergoing liver transplantation: psychosocial characteristics, depressive symptoms, and quality of life. Transplant. Proc. 2008;40:802–4.
37. Secoli SR, Nita ME, OnoNita SK, Nobre M. Avaliação de tecnologia em saúde: II. A análise de custoefetividade. Arq. Gastroenterol. 2010;47:329–33. 38. Soárez PC de, Novaes HMD, Sartori AMC. Impact of methodology on the results
of economic evaluations of varicella vaccination programs: is it important for decisionmaking? Cad Saúde Pública. 2009;25(Suppl 3):S40114.
39. Swan Tan S, Bakker J, Hoogendoorn ME, Kapila A, Martin J, et al. Direct cost analysis of intensive care unit stay in four European countries: applying a standardized costing methodology. Value Heal. 2012, pp. 81–6.
40. Tan SS, Hakkaartvan Roijen L, Al MJ, Bouwmans CA, Hoogendoorn ME, et al. A microcosting study of intensive care unit stay in the Netherlands. J Intensive Care Med. 2008;23:250–7.
41. Teh SH, Nagorney DM, Stevens SR, Offord KP, Therneau TM, et al. Risk factors for mortality after surgery in patients with cirrhosis. Gastroenterology. 2007;132:1261–9.
42. Teixeira UF, Goldoni MB, Machry MC, Ceccon PN, Fontes PR, et al. Ambulatory laparoscopic cholecystectomy is safe and costeffective: a brazilian single center experience. Arq Gastroenterol. 2016;53:103–7.
43. Tretiak R, Laupacis A, Rivière M, McKerracher K, Souêtre E. Cost of allogeneic and autologous blood transfusion in Canada. Canadian cost of transfusion study group. CMAJ. 1996;154:1501–8.
44. Vonlanthen R, Slankamenac K, Breitenstein S, Puhan MA., Muller MK, et al. The impact of complications on costs of major surgical procedures. Ann Surg. 2011;254:907–13.
45. Wanna AGB, Noble JH, Carlson ML, Gifford H, Dietrich MS, et al. Chronic hepatitis C virus (HCV) disease burden and cost in the United States. Laryngo scope, 2014, pp. 2–31.
46. Washburn WK, Pollock BH, Nichols L, Speeg K V, Halff G. Impact of recipient meld score on resource utilization. Am J Transplant. 2006;6:2449–54. 47. Wong G, Howard K, Webster AC, Morton RL, Chapman JR, Craig JC. How is
health economics relevant to transplant clinicians? Transplantation. 2014;98:124–30. 48. Xu X, Grossetta Nardini HK, Prah Ruger J. Microcosting studies in the health and medical literature: protocol for a systematic review. Syst Rev. 2014;3:1–7. 49. Zalesak M, Francis K, Gedeon A, Gillis J, Hvidsten K, et al. Current and future