INTRODUCTION
Liver has essential physiological functions in food digestion, absorption of nutrients and metabolism, playing a central role in the maintenance of a healthy nutritional status. Patients with chronic liver disease (CLD) suffer from a signiicant impairment of these functions, which may result in protein-calorie malnutri-tion (PCM)(27).
PCM is a transversal condition in all stages of liver cirrhosis. Hospitalised CLD patients are particularly at risk, with malnutri-tion being present in 65%-90% at admission(14). PCM is considered
an independent predictor of mortality and is associated with an increased number of complications such as variceal bleeding, hepatic encephalopathy, spontaneous bacterial peritonitis, hepa-torenal syndrome and an impaired liver regeneration capacity. Furthermore, CLD patients are more susceptible to fat-soluble vitamin and trace element deiciency, which also may lead to an impaired outcome(4,13,23).
Several factors contribute to malnutrition in patients with liver cirrhosis. A reduction in food intake is caused by anorexia, nausea,
Outcome and nutritional assessment of chronic
liver disease patients using anthropometry and
subjective global assessment
Gonçalo
NUNES
1, Carla Adriana
SANTOS
1, Rita
BAROSA
1, Cristina
FONSECA
1,
Ana Teresa
BARATA
1and Jorge
FONSECA
1,2Received 11/2/2017 Accepted 7/3/2017
ABSTRACT – Background – Protein-calorie malnutrition is common in chronic liver disease (CLD) but adequate clinical tools for nutritional assessment
are not deined. Objective – In CLD patients, it was aimed: 1. Characterize protein-calorie malnutrition; 2. Compare several clinical, anthropometric and functional tools; 3. Study the association malnutrition/CLD severity and malnutrition/outcome. Methods – Observational, prospective study. Consecutive CLD ambulatory/hospitalised patients were recruited from 01-03-2012 to 31-08-2012, studied according with age, gender, etiology, alcohol consumption and CLD severity deined by Child-Turcotte-Pugh. Nutritional assessment used subjective global assessment, anthropometry, namely body-mass index (BMI), triceps skinfold, mid upper arm circumference, mid arm muscular circumference and handgrip strength. Patients were followed during two years and survival data was recorded. Results – A total of 130 CLD patients (80 men), aged 22-89 years (mean 60 years) were included. Most suffered from alcoholic cirrhosis (45%). Hospitalised patients presented more severe disease (P<0.001) and worst nutritional status deined by BMI (P=0.002), mid upper arm circumference (P<0.001), mid arm muscular circumference (P<0.001), triceps skinfold (P=0.07) and subjective global assessment (P<0.001). A third presented deicient/low handgrip strength. Alcohol consumption (P=0.03) and malnutrition detected by BMI (P=0.03), mid upper arm circumference (P=0.001), triceps skinfold (P=0.06), mid arm muscular circumference (P=0.02) and subjective global assessment (P<0.001) were associated with CLD severity. From 25 patients deceased during follow-up, 17 patients were severely malnourished according with triceps skinfold. Malnutrition deined by triceps skinfold predicted mortality (P<0.001). Conclusion – Protein-calorie malnutrition is common in CLD patients and alcohol plays an important role. Triceps skinfold is the most eficient anthropometric parameter and is associated with mortality. Nutritional assessment should be considered mandatory in the routine care of CLD patients.
HEADINGS – Liver cirrhosis, complications. Protein-energy malnutrition. Skinfold thickness. Avaliação nutricional.
Declared conflict of interest of all authors: none Disclosure of funding: no funding received
1 Hospital Garcia de Orta, Departamento de Gastroenterologia, GENE - Artificial Feeding Team, Almada, Portugal; 2 CiiEM, Centro de Investigação Interdisciplinar Egas Moniz, Monte da Caparica, Portugal.
Correspondence: Gonçalo Nunes. Departamento de Gastroenterologia. Hospital Garcia de Orta. Av. Torrado da Silva, 2805-267 – Almada, Portugal. E-mail: [email protected] dysgeusia, early satiety (mainly when splenomegaly is present), heavy alcohol consumption, encephalopathy and the prescription of severely restrictive diets with low sodium content(4,8,13,19,23).
Im-paired digestion and absorption occurs due to biliary salt deiciency, bacterial overgrowth and also portal hypertension that promote changes in the intestinal mucosa. High metabolic demands with an increase in rest energy expenditure are common in those patients, leading to increased malnutrition if an adequate calorie supply is not provided(4,8,13,19,23,27).
Nutritional assessment in CLD patients can be challenging. Subjective Global Assessment (SGA) is a practical tool that combines data from clinical history and physical examination (weight loss, changes in dietary intake, gastrointestinal symptoms, functional capacity, metabolic demands, signs of muscle wasting and the presence of peripheral oedema)(7). SGA is validated in
cir-rhotic patients, has been shown to predict prognosis and is highly reproducible(12,13,23). Classic anthropometric parameters such as
inluenced by patient luid status and despite the possibility of inter-observer variability, these measures are considered to be more sensitive than BMI to detect malnutrition in CLD patients(13,20,26).
Laboratory parameters such as albumin and other serum proteins are unreliable as true nutritional status markers and its low serum concentration is associated with severity of liver disease and degree of inlammation(13,23). Handgrip strength (dynamometry) is a very
sensitive method to detect the functional impairment that relects PCM and seems to be a good predictor of CLD complications(1,2,6).
Indirect calorimetry and bioimpedance are more sophisticated tools but they are not available in most centres(8,11,13,22).
Given the high prevalence of malnutrition in liver cirrhosis, the assessment of nutritional status should always be performed in those patients. According with the guidelines of the European Society for Clinical Nutrition and Metabolism (ESPEN), use of simple bedside tools such as SGA, anthropometry or handgrip strength to identify patients at risk of undernutrition is considered adequate and should be the irst approach to further select patients who may need nutrition therapy if nutritional requirements are not satisied(16).
Currently, there is no consensus about the best method for quantiication and classiication of malnutrition(13,19).
The present study aims to characterize the nutritional status of CLD patients followed at Hospital Garcia de Orta Gastroenterol-ogy Department.
The primary aims are
1) To perform a nutritional assessment of CLD patients using anthropometry and SGA, and to compare the accuracy of each tool to identify PCM in CLD patients.
2) To study the relationship between nutritional status and outcome of CLD patients.
The secondary aims include
3) To compare the nutritional status of inpatients admitted to the gastroenterology ward with those who are followed at gastro-enterology outpatient clinic.
4) To evaluate if alcohol consumption is a major contribution for PCM in CLD patients.
5) To study the relationship between PCM and severity of liver disease using Child-Turcotte-Pugh score(5).
METHODS
Study design
A single centre, observational, longitudinal and prospective study was performed in a large hospital setting. This project was approved by Hospital Garcia de Orta Ethical Committee.
Patients
Consecutive ambulatory and hospitalized CLD patients were included and evaluated by Artiicial Feeding Team (GENE) of the Gastroenterology Department of Hospital Garcia de Orta from 1st March 2012 to 31th August 2012 and underwent nutritional assessment using clinical, anthropometric and functional tools. The diagnosis of CLD was previously made by conjugation of clinical (ascites or hepatic encephalopathy), laboratory (low albumin, prolonged coagulation times or other abnormal laboratory tests) and morphologic (enlarged and heterogeneous liver with irregular contours or evidence of portal hypertension in ultrasonography
and CT/MRI scan) features. Liver biopsy was performed only when needed to study the etiology of liver disease if clinical and laboratorial data were inconclusive.
Exclusion criteria included medication with corticosteroids, which has an important impact in body composition, VIH in-fection as these patients are most followed by infectiology team, the presence of speciic endocrinopathies like Graves’ disease and Cushing syndrome and lack of compliance with follow-up medical consultations and therapies.
Anthropometric evaluation
Anthropometric evaluation was performed at the time of refer-ral, according with the ISAK manual of International Society for the Advancement of Kinanthropometry(25). The average of three
consecutive measurements was then recorded on the patients’ ile. Body Mass Index (BMI) was obtained using the equation weight/height2. Each patient was classiied according to age as
having low weight if BMI <18.5 kg/m2 for patients under 65 years
or BMI <22 kg/m2 for patients 65 years old or older.
Mid Upper Arm Circumference (MUAC) was measured in centimeters, using a lexible measuring tape wrapped around the mid upper arm, halfway between the olecranon and the acromion process.
Triceps Skinfold (TSF) was measured in millimeters, using a skinfold caliper on the mid-line of the posterior surface of the arm, halfway between the olecranon and the acromion process.
Mid Arm Muscular Circumference (MAMC) was
esti-mated through MUAC and TSF according with the formula: MAMC (cm) = MUAC (cm) – [TSF (mm) x 0.314].
The anthropometric values of each patient were compared with the NHANES (National Health and Nutrition Examination Survey) reference values on Frisancho tables, and the nutritional status was classiied according with the criteria described by Black-burn & Thornton(10,15). Patient nutritional status was classiied as
being eutrophic, overweight, and obese or having mild, moderate and severe malnutrition according with MUAC, TSF and MAMC.
Dynamometry
In order to determine the handgrip strength a hydraulic dyna-mometer Jamar® previously adjusted to the patient hand size was
used. The results were presented in kilogram force. The measure-ment was performed with the patient sitting down, the elbow lexed at 90º and the arm along the body. Alternatively, the patient could also be lying in the bed with the elbow supported and the head at 30º. Three measurements were performed using the non-dominant hand, always encouraging the patient to exert his greatest strength. The best value obtained was recorded. The results were further categorized in percentiles according with gender, age and height(24).
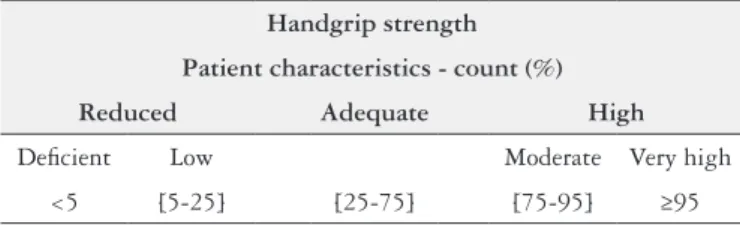
Patient functional status was classiied using the classiication described in Table 1.
TABLE 1. Classiication of patient functional status according with dynamometry results(24)
Handgrip strength
Patient characteristics - count (%)
Reduced Adequate High
Deicient Low Moderate Very high
Subjective global assessment
Nutritional assessment was also performed using Subjective Global Assessment (SGA) taking into account recent changes in weight, dietary intake, gastrointestinal symptoms, changes in functional capacity, perception of subcutaneous fat and muscle wasting, edema and ascites(7). Patients were classiied as being
well nourished (A), moderately malnourished (B) or severely malnourished (C).
Severity of liver disease
The severity of liver disease was deined using Child-Turcotte-Pugh (CTP) system based in clinical (ascites, encephalopathy) and laboratorial parameters (albumin, bilirubin, international normal-ized ratio – INR) assessed simultaneously with the anthropometric evaluation(5).
Alcohol consumption
Alcohol consumption was deined by ingestion of more than 20 and 40 g of alcohol per day in women and men, respectively. Quan-tiication of the amount of alcohol ingested was performed through anamnesis considering that one standard drink corresponds to approximately 10 g of pure alcohol. The present study, did not discriminate patients who maintained active alcohol ingestion from patients who were supposed to be in abstinence. Actually, CLD patients often hide surreptitious alcohol ingestion from caregivers and health professionals. It was opted to standardize this parameter since there were no robust methods available to ascertain if patients who deny active alcohol consumption are really compliant with complete abstinence.
Clinical outcome
After the initial evaluation, patients maintained follow-up at gastroenterology outpatient clinic and survival data were recorded at three, six, twelve and twenty-four months periods. According to the clinical outcome, patients were divided into three categories:
alive and maintaining follow-up at gastroenterology outpatient clinic, deceased and lost for follow-up. All the patients lost for follow-up were excluded from the study.
Statistical analysis
The statistical analysis was performed using the Statistical Package for Social Sciences (SPSS® Inc., Chicago, IL), version 21,
and Microsoft Ofice Excel Professional 2013®.
The variables analyzed in every patient were age, gender, etiology of CLD, alcohol consumption, patient provenience (ambulatory or hospitalized), CTP staging of CLD, SGA stag-ing of nutritional status, anthropometry, handgrip strength and outcome.The anthropometric variables considered were BMI, MUAC, TSF and MAMC. Total survival in months as well as mortality rate at 3 months, 6 months, 1 year and 2 years were calculated in all patients.
After a descriptive analysis of all the variables, the Chi-Square test was applied (or alternatively the Exact Fisher Test variation when individuals in each category were less than ive) to ascertain the association between patient provenience, alcohol consumption, CLD severity, anthropometric parameters, SGA, handgrip strength and mortality. Data were also studied through a multivariable analysis using a binary logistic regression to identify factors as-sociated with mortality. Inferential tests were performed at the 5% level of statistical signiicance.
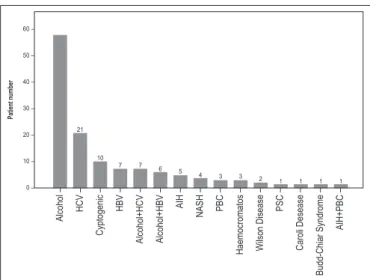
FIGURE 1. Patient distribution according with the etiology of CLD. HCV: Hepatitis C virus; HBV: hepatitis B virus; AIH: autoimmune hepatitis; NASH: non-alcoholic steato-hepatitis; PBC: primary biliary cirrhosis; PSC: primary sclerosing cholangitis.
RESULTS
Patients
One hundred and thirty-six CLD patients were eligible and underwent nutritional assessment by the Artiicial Feeding Team, of whom six patients were lost to follow-up, 25 have died and 105 remained alive and followed in gastroenterology outpatient clinic. Patients lost to follow-up were excluded from the study.
One hundred and thirty CLD patients were studied were included (80 men and 50 women) ranging from 22 to 89 years old (mean: 60 years). Alcohol consumption was present in 74 (57%) patients, being considered the single etiology of CLD in 59 (45%) patients. Forty-one (32%) patients suffered from chronic viral hepatitis (13 patients with hepatitis B and 28 patients with hepatitis C). Autoimmune and metabolic causes represented a small portion of patients and 12 (9%) patients presented cryptogenic cirrhosis. Patient distribution according to the etiology of CLD was represented in Figure 1.
Eighty-nine patients (68.5%) were initially assessed in the gastroenterology outpatient clinic and 41 (31.5%) patients were hospitalized in the gastroenterology ward due to acute decompen-sation of liver disease.
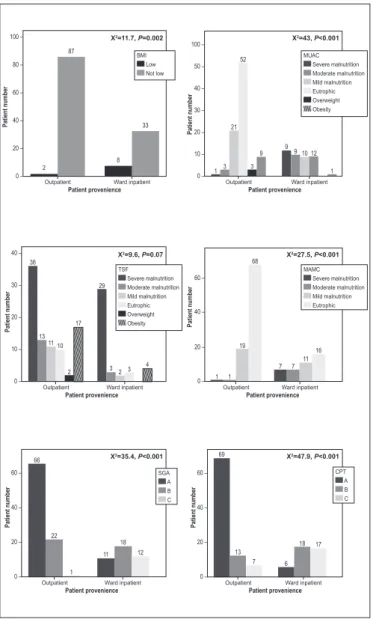
Regarding the severity of liver disease, 75 (57%) patients were CTP-A, 31 (24%) patients were CTP-B and 24 (19%) patients were CTP-C. There was a signiicant association between severity of liver disease and patient provenience, CTP-A patients prevalence being higher in ambulatory and CTP-B/CTP-C being predominant in hospitalized patients (X2=47.9, P<0.001) – Figure 2.
Demographic data of the sample is represented in Table 2.
Anthropometric evaluation
All patients included in the study were submitted to a full anthropometric evaluation using BMI, MUAC, TSF and MAMC.
Ten (8%) patients present low BMI being considered malnour-ished and 120 (92%) patients displayed normal or high BMI.
Outpatient 2 87 8 33 100 – 80 – 60 – 40 – 20 – 0 – Pa ti en t n u m b er
X2=11.7, P=0.002
BMI Low Not low Ward inpatient Patient provenience 1 3 21 52 3 9 9 9 10 12
1 100 – 50 – 40 – 30 – 20 – 10 – 0 – MUAC Severe malnutrition Moderate malnutrition Mild malnutrition Eutrophic Overweight Obesity
X2=43, P<0.001
Pa ti en t n u m b er
Outpatient Ward inpatient
Patient provenience 36 13 11 10 2 17 29 3 2 3 4 40 – 30 – 20 – 10 – 0 – Pa ti en t n u m b er
X2=9.6, P=0.07
TSF Severe malnutrition Moderate malnutrition Mild malnutrition Eutrophic Overweight Obesity
Outpatient Ward inpatient
Patient provenience Pa ti en t n u m b er 1 1 19 68 7 7 11 16
Outpatient Ward inpatient
Patient provenience
60 –
40 –
20 –
0 –
X2=27.5, P<0.001
MAMC Severe malnutrition Moderate malnutrition Mild malnutrition Eutrophic 69 13 7 6 18 17 66 22 1 11 18 12 60 – 40 – 20 – 0 – Pa ti en t n u m b er
X2=35.4, P<0.001
Outpatient Ward inpatient
Patient provenience SGA A B C 60 – 40 – 20 – 0 – Pa ti en t n u m b er
X2=47.9, P<0.001
CPT A B C
Outpatient Ward inpatient
Patient provenience
FIGURE 2. Patient distribution according with nutritional parameters, SGA, severity of CLD and provenience. BMI: body mass index; MUAC: mid upper arm circumference; TSF: triceps skinfold; MAMC: mid arm muscular circumference; SGA: subjective global assessment; CTP: Child-Turcotte-Pugh.
TABLE 2. Demographic characteristics of the included patients
Patient characteristics - count (%)
Age M = 60 years ± 12.2
Gender male: 80 (61.5) female: 50 (15.5) Provenience Outpatient: 89 (68)
Ward inpatient: 41 (32) Alcohol consumption 74 (57)
Child-Turcotte-Pugh A: 75 (57) B: 31 (24) C: 24 (19) Subjective global assessment A: 77 (59) B: 40 (31) C: 13 (10) Body Mass Index Low: 10 (8)
Not low: 120 (92)
Mid upper arm circumference Severe malnutrition: 13 (10) Moderate malnutrition: 13 (10) Mild malnutrition: 30 (23) Eutrophic: 61 (47) Overweight: 3 (2) Obesity: 10 (8)
Triceps skinfold Severe malnutrition: 65 (50) Moderate malnutrition: 16 (12) Mild malnutrition: 13 (10) Eutrophic: 13 (10) Overweight: 2 (2) Obesity: 21 (16) Mid arm muscular
circumference
Severe malnutrition: 8 (6) Moderate malnutrition: 8 (6) Mild malnutrition: 30 (23) Eutrophic: 84 (65) Handgrip strength Deicient: 16 (12)
Low: 27 (21) Adequate: 24 (19) Moderate: 8 (6) High: 2 (1) Mortality 3 months 8 (6)
Mortality 6 months 8 (6)
Mortality 1 year 15 (11.5)
Mortality 2 years 25 (19)
Regarding TSF, 94 (72%) patients were considered malnour-ished, 13 (10%) patients were eutrophic, 2 (2%) patients displayed overweight and 21 (16%) patients present obesity.
Measuring MAMC, 46 (35%) patients were considered mal-nourished and 84 (65%) patients were eutrophic. No patient dis-played MAMC exceeding the normal range.
Comparing patients in whom nutritional status was assessed in ambulatory, with hospitalized patients evaluated in an acute decompensation setting it was veriied that patients with low BMI were more frequent in the ward (X2=11.7, P=0.002). Furthermore,
moderate and severe malnutrition defined by MUAC (X2=43,
P<0.001) and MAMC (X2=27.5, P<0.001) were also more
preva-lent in hospitalized patients. Data regarding TSF showed that the proportion of patients presenting with severe malnutrition tend to be higher in hospitalized patients (X2=9.6, P=0.07) – Figure 2.
Subjective Global Assessment (SGA)
Nutritional assessment performed using SGA showed 77 (59%) patients being considered well nourished (A), 40 (31%) patients being moderately malnourished (B) and 13 (10%) patients being severely malnourished. There were a signiicant association between severity of malnutrition deined by SGA and patient provenience, SGA-A patients being higher in ambulatory and SGA-B/SGA-C being pre-dominant in hospitalized patients (X2=35.4, P<0.001) – Figure 2.
Dynamometry
Impact of alcohol consumption in PCM – Table 3
It was also compared present/past signiicant alcohol con-sumption with severity of liver disease and severity of PCM de-ined by SGA, handgrip strength and the diverse anthropometric parameters.
ished. Dynamometry results showed the same tendency with the proportion of patients who were CTP-C presenting with deicient values (X2=11.2, P=0.15).
There was an association between severity of liver disease and SGA since patients being CTP-B and CTP-C were more frequently moderate-severe malnourished being SGA-B and SGA-C (X2=23.8,
P<0.001).
Nutritional status and outcome of CLD patients
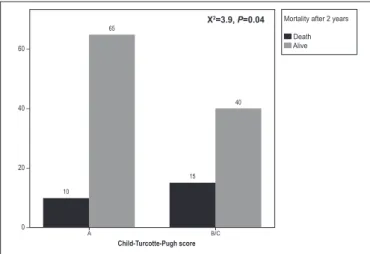
From the 25 deaths, 8 patients died during the irst 6 months and 19 patients died after this period and during the irst two years. Mortality rate at 2 years’ time was 19%. All deaths were associated with progression of liver disease. Eighteen patients had present/ past alcoholic habits and 15 patients presented moderate-to-severe liver disease being CTP-B and CTP-C (X2=3.9, P=0.04) – Figure 3.
According with SGA, 11 patients were well nourished (A) and 14 presented moderate-severe malnutrition (B-C).
TABLE 3. Association between alcohol consumption/severity of malnutri-tion in CLD patients and severity of CLD/PCM deined by anthropometry, subjective global assessment and dynamometry
Chi-square Signiicance
Alcohol-BMI 0.76 0.51
Alcohol-MUAC 4.2 0.52
Alcohol-TSF 2.2 0.86
Alcohol-MAMC 3.3 0.38
Alcohol-dynamometry 7.7 0.09
Alcohol-SGA 3.9 0.15
Alcohol-CTP 6.81 0.03
CTP-BMI 6.81 0.03
CTP-MUAC 25.9 0.001
CTP-TSF 15.9 0.06
CTP-MAMC 14.1 0.02
CTP-dinamometry 11.2 0.15
CTP-SGA 23.8 0.001
BMI: body mass index; MUAC: mid upper arm circumference; TSF: triceps skinfold; MAMC: mid arm muscular circumference; SGA: subjective global assessment; CTP: Child-Turcotte-Pugh.
The alcohol ingestion habits tends to be associated with low BMI although the association did not reach statistical signiicance (X2=0.76, P=0.51). In addition, patients who consumed ethanol
appeared to have more moderate and severe malnutrition deined by MUAC (X2=4.2, P=0.52) and MAMC (X2=3.3, P=0.38) as well
as more severe malnutrition deined by TSF (X2=2.2, P=0.86).
Alcohol consumption tended to be associated with severity of malnutrition using SGA score with more patients who consumed ethanol presenting with more moderate and severe malnutrition (X2=3.9, P=0.15). Deicient and low handgrip strength levels were
associated with ethanol consumption (X2=7.7, P=0.09).
As a major contributor to CLD in this sample, alcoholic hab-its were signiicantly associated to severity of liver disease with more patients being CTP-B or CTP-C (X2=6.81, P=0.03) in this
subgroup.
Relationship between PCM and severity of liver disease – Table 3
To evaluate the impact of PCM in severity of liver disease it was compared CTP to SGA, handgrip strength and the different anthropometric parameters.
Low BMI was more prevalent in patients with B and CTP-C (X2 = 6.81, P=0.03). Patients who were considered moderately
and severely malnourished using MUAC presented commoner as CTP-B and CTP-C (X2=25.9, P=0.001). Data regarding TSF
(X2=15.9, P=0.06) and MAMC (X2=14.1, P=0.02) showed that
although the absolute number of patients with moderate and severe malnutrition was higher when they were CTP-A, the proportion of patients being CTP-B and CTP-C were more frequently
malnour-A 10
Child-Turcotte-Pugh score
65
B/C 15
40
Mortality after 2 years
Death Alive 60 –
40 –
20 –
0 –
X2=3.9, P=0.04
FIGURE 3. Patient distribution according with mortality after 2 years of follow-up and severity of chronic liver disease.
On a irst statistical approach, comparing each anthropometric parameter with overall mortality, only severe malnutrition deined by TSF appeared to be clearly associated with mortality, since 17 from the 25 patients who died until the end of the follow-up period display severe malnutrition according with this tool. A multivariable analysis applied to identify predictors of survival using a binary logistic regression showed that severe malnutrition deined by TSF is associated with patient mortality (OR 15.2, P<0.001) with no signiicant data regarding the other anthropometric parameters.
DISCUSSION
PCM is a common complication of liver cirrhosis being as-sociated with adverse prognosis if left untreated. It is of critical importance to assess the nutritional status of all CLD patients and to optimize nutritional support, maintaining adequate protein and caloric intake and correcting nutrient deiciencies(3,13).
As expected, BMI was insensitive to identify malnutrition in CLD patients as only 8% of the sample was considered malnour-ished according with this anthropometric parameter. Actually, BMI calculation relects body weight, which is often overestimated by hydrosaline retention without representing true nutritional status. Body circumferences such as MUAC and MAMC as well as cuta-neous skinfolds like TSF appear to recognize malnutrition early and better. In this sample, 72% of the patients were considered malnourished and 50% displayed severe malnutrition according with TSF. MUAC and MAMC also identiied high number of patients presenting with mild and moderate malnutrition but fewer patients with severe malnutrition. In fact, fat mass is frequently irst sacriiced in starvation status, which may explain the early impact of malnutrition in TSF, a parameter that relect adipose reserves. Nevertheless, malnourished CLD patients often present with sig-niicant loss of muscle mass and thereby body circumferences seem also to be a good marker of malnutrition in these patients. SGA identiied malnutrition in 41% of the patients with most of them being considered moderately malnourished. Those indings were consistent with recent studies on this issue(9,17,18,21).
Furthermore, these results clearly shows that patients assessed in a ward setting present more frequent and severe malnutrition whatever the tool used to assess nutritional status. This fact may be explained by hypercatabolism, low food intake and loss of fat-free mass, which are exacerbated in decompensated disease.
Several reported studies have shown that functional status deined by handgrip strength correlates with severity of malnutri-tion and clinical outcome in different disease states(9,17,18,21). More
than a half of the tested patients in this sample displayed deicient/ low values in dynamometry, which was associated with the high prevalence of PCM detected in CLD patients as it was previously reported(4,8,13,14,19,23,27).
The present or past heavy alcoholic habits, even when they were present in patients with viral disease, were signiicant corre-lated with severity of liver disease and tend to be associated with severity of PCM as more severe malnourished patients deined by MUAC, TSF, MAMC and SGA were present in this subgroup. This data were also consistent with previous reportsthat generally also used a similar methodology(27). In addition, patients with history
of alcohol consumption appeared to have deicient/low handgrip strength values and consequently high degree of functional impair-ment. However, these results comparing alcohol consumption with severity of malnutrition approached but did not reach statistical signiicance (P=0.09).
PCM identiied by BMI, MUAC, MAMC and SGA was signii-cant associated with severity of liver disease. Data regarding TSF showed the same tendency and approaches statistical signiicance (P=0.06). Patients with more deteriorated functional status were especially CTP-C. Although data from handgrip strength were not statistically signiicant, this was probably due to the smaller number of patient that was evaluated by dynamometry.
During the follow-up period, a low mortality rate was found as only 19% of patients have died at the end of the study. All deaths were associated with CLD progression with most patients having advanced liver disease and moderate-to-severe malnutri-tion according with SGA. Nevertheless, a signiicant number of death patients were CTP A, which could mean that even in the
presence of mild liver impairment, malnutrition may have a nega-tive impact in the outcome. As it was also shown previously(21),
TSF revealed to be the most sensitive anthropometric parameter to identify PCM and appeared to predict poor outcome in CLD patients identifying up to two thirds of patients who died and displayed severe malnutrition.
However, it was recognized some limitations in these study. It was used a convenience sample. The methodology used here did not accurately discriminate which patients continued alcohol consumption from those who were in total abstinence. This fact may constitute an important bias in the analysis as alcoholism can potentiate malnutrition in CLD and hence leading to a worst prognosis. On the other hand, dynamometry was not used to as-sess functional status in all patients, as the necessary equipment was not available during the all period of the study. Also, more sophisticated methods like bioimpedance and indirect calorimetry that are emerging in several institutions(7,20)were not applied in these
study, as they are not available in most of Portuguese health centres. Nevertheless, the study highlights the importance of considering clinical and anthropometric data to screen and assess nutritional status in CLD patients showing its accuracy in detecting malnutri-tion especially using TSF and SGA.
CONCLUSION
With this experience, PCM is common in CLD patients, those with advanced liver disease tend to be more severely malnourished and alcohol consumption may play a very important causative role. Malnutrition deined by anthropometric and SGA is more prevalent in hospitalized CLD patients and contributed to a poor prognosis both in a hospital and in ambulatory setting. The present results shows that SGA is accurate to detect malnutrition in CLD. TSF seems to be the most eficient anthropometric parameter to assess nutritional status in these patients and is clearly associated with a poor outcome. Further studies are needed to evaluate the true importance of functional status deined by handgrip strength. As a rule, CLD patients have high risk of malnutrition and therefore, nutritional assessment is mandatory in their routine care.
ACKNOWLEDGMENTS
The authors thanks to Tiago Carrapito who has worked as a dietitian in the artiicial feeding team, the collaboration in the data collection and patient nutritional assessment.
Ethical approval
All procedures performed were in accordance with the ethical standards of the Institutional and/or National Committee and with the 1964 Helsinki declaration and its later amendments or comparable ethical standards.
Authors contributions
REFERENCES
1. Alvares-da-Silva MR, Reverbel da Silveira T. Comparison between handgrip strength, subjective global assessment, and prognostic nutritional index in assessing malnutrition and predicting clinical outcome in cirrhotic outpatients. Nutrition. 2005;21:113–7.
2. Augusti L, Franzoni LC, Santos LA, Lima TB, Ietsugu MV, et al. Lower values of handgrip strength and adductor pollicis muscle thickness are associated with hepatic encephalopathy manifestations in cirrhotic patients. Metab Brain Dis. 2016;31:909-15.
3. Cabre E, Gonzalez-Huix F, Abad-Lacruz A, Esteve M, Acero D, et al. Effect of total enteral nutrition on the short-term outcome of severely malnourished cirrhotics. A randomized controlled trial. Gastroenterology. 1990;98:715-20. 4. Chadalavada R, Sappati Biyyani RS, Maxwell J, Mullen K. Nutrition in hepatic
encephalopathy. Nutr Clin Pract. 2010;25:257-64.
5. Child CG, Turcotte JG. The Liver and Portal Hypertension. Philadelphia, WB Saunders Co. Philadelphia; 1964.
6. de Lima DC, Ribeiro HS, Cristina R, Oliveira M, Generoso Sde V, et al. Function-al status and heart rate variability in end-stage liver disease patients: association with nutritional status. Nutrition. 2015;31:971-4.
7. Detsky A, McLaughlin J, Baker J, Johnston N, Whittaker S, Mendelson R, et al. What is subjective global assessment of nutritional status? J Parenter Enter Nutr. 1987;11:8-13.
8. Fernandes SA, Bassani L, Nunes FF, Aydos ME, Alves AV, Marroni CA. Nu-tritional assessment in patients with cirrhosis. Arq Gastroenterol. 2012;49:19-27. 9. Figueiredo F, Dickson ER, Pasha T, Kasparova P, Therneau T, et al. Impact
of nutritional status on outcomes after liver transplantation. Transplantation. 2000;70:1347-52.
10. Frisancho AR. New standards of weight and body composition by frame size and height for assessment of nutritional status of adults and the elderly. Am J Clin Nutr. 1984;40:808-19.
11. Gottschall CB, Alvares-da-Silva MR, Camargo AC, Burtett RM, da Silveira TR. Nutritional assessment in patients with cirrhosis: the use of indirect calorimetry. Arq Gastroenterol. 2004;41:220-4.
12. Hasse J, Strong S, Gorman MA, Liepa G. Subjective global assessment: alter-native nutrition-assessment technique for liver-transplant candidates. Nutrition. 1993; 9:339-43.
13. Henkel A, Buchman A. Nutritional support in patients with chronic liver disease. Nat Clin Pract Gastroenterol Hepatol. 2006;3:202-9.
14. Huynh DK, Selvanderan SP, Harley HA, Holloway RH, Nguyen NQ. Nutritional care in hospitalized patients with chronic liver disease. World J Gastroenterol. 2015;21:12835-42.
Nunes G, Santos CA, Barosa R, Fonseca C, Barata AT, Fonseca J. Prognóstico e avaliação nutricional de doentes com doença hepática crônica com recurso à antropometria e avaliação global subjetiva. Arq Gastroenterol. 2017;54(3):225-31.
RESUMO – Contexto – A desnutrição calórico-proteica é frequente na doença hepática crônica (DHC), no entanto, ferramentas clínicas adequadas para
avaliação nutricional destes doentes não estão deinidas. Objetivo – Em doentes com DHC, pretendeu-se: 1. Caracterizar a desnutrição calórico-proteica; 2. Comparar diferentes ferramentas clínicas, antropométricas e funcionais de avaliação nutricional; 3. Estudar a associação desnutrição/gravidade da DHC e desnutrição/prognóstico. Métodos – Estudo observacional e prospetivo. Foram recrutados doentes ambulatórios/hospitalizados de 01-03-2012 a 31-08-2012 e estudados tendo em conta a idade, gênero, etiologia, consumo alcoólico e gravidade da DHC deinida pelo score Child-Turcotte-Pugh. A avaliação nutricional incluiu a utilização da avaliação global subjetiva, antropometria nomeadamente índice de massa corporal (IMC), perímetro braquial, circunferência muscular do braço, prega cutânea tricipital e dinamometria. Os doentes foram seguidos durante 2 anos e foi registada a res-pectiva sobrevida. Resultados – Foram incluídos 130 doentes com DHC (80 homens) com idade 22-89 anos (média 60 anos). A maioria apresentava cirrose alcoólica (45%). Os doentes hospitalizados apresentaram doença hepática mais severa (P<0,001) e pior estado nutricional, deinido pelo IMC (P=0,002), perímetro braquial (P<0,001), circunferência muscular do braço (P<0,001), prega cutânea tricipital (P=0,07) e avaliação global subjetiva (P<0,001). Um terço apresentava força de preensão manual deiciente/baixa. O consumo alcoólico (P=0,03) e a desnutrição detetada pelo IMC (P=0,03), perímetro braquial (P=0,001), prega cutânea tricipital (P=0,06), circunferência muscular do braço (P=0,02) e avaliação global subjetiva (P<0,001) encontraram-se associados à gravidade da DHC. Dos 25 doentes que faleceram durante o seguimento, 17 apresentavam desnutrição severa deinida pela prega cutânea tricipital. A desnutrição deinida pela prega cutânea tricipital revelou ser um fator preditivo de mortalidade (P<0,001).
Conclusão – A desnutrição calórico-proteica é comum na DHC para a qual o álcool desempenha um papel importante. A prega cutânea tricipital
é o parâmetro antropométrico mais eiciente e encontra-se associado à mortalidade. A avaliação nutricional deve ser considerada mandatória na abordagem rotineira de doentes com DHC.
DESCRITORES – Cirrose hepática, complicações. Desnutrição proteico-calórica. Pregas cutâneas. Avaliação nutricional.
15. McDowell M, Fryar C, Ogden C, Flegal K. Anthropometric reference data for children and adults: United States, 2003-2006. Natl Health Stat Report. 2008;(10):1-48.
16. Plauth M, Cabré E, Riggio O, Assis-Camilo M, Pirlich M, Kondrup J; DGEM (German Society for Nutritional Medicine), Ferenci P, Holm E, Vom Dahl S, Müller MJ, Nolte W; ESPEN Guidelines on Enteral Nutrition: Liver disease. Clin Nutr. 2006;25:285-94.
17. Reijnierse EM, Trappenburg MC, Leter MJ, Blauw GJ, de van der Schueren MA, et al. The Association between Parameters of Malnutrition and Diag-nostic Measures of Sarcopenia in Geriatric Outpatients. PLoS One. 2015;10: e0135933.
18. Rijk JM, Roos PR, Deckx L, van den Akker M, Buntinx F. Prognostic value of handgrip strength in people aged 60 years and older: A systematic review and meta-analysis. Geriatr Gerontol Int. 2016;16:5-20.
19. Rivera Irigoin R, Abilés J. Nutritional support in patients with liver cirrhosis. Gastroenterol Hepatol. 2012;35:594-601.
20. Romeiro FG, Augusti L. Nutritional assessment in cirrhotic patients with hepatic encephalopathy. World J Hepatol. 2015;7:2940-54.
21. Santos LA, Lima TB, Augusti L, Franzoni Lde C, Yamashiro Fda S, et al. Hand-grip strength as a predictor of bone mineral density in outpatients with cirrhosis. J Gastroenterol Hepatol. 2016:229-34.
22. Selberg O, Selberg D. Norms and correlates of bioimpedance phase angle in healthy human subjects, hospitalized patients, and patients with liver cirrhosis. Eur J Appl Physiol. 2002;86:509-16.
23. Silva M, Gomes S, Peixoto A, Torres-Ramalho P, Cardoso H, Azevedo R, et al. Nutrition in Chronic Liver Disease. GE Port J Gastroenterol. 2015;22: 268-76.
24. Spruit MA, Sillen MJ, Groenen MT, Wouters EF, Franssen FM. New normative values for handgrip strength: Results from the UK Biobank. J Am Med Dir Assoc. 2013;14:1-7.
25. Stewart A, Marfell-Jones M, Olds T, de Ridder H. International standards for anthropometric assessment. Lower Hutt: International Society for the Advance-ment of Kinanthropometry; 2011.
26. Thuluvath PJ and Triger DR. Evaluation of nutritional status by using anthro-pometry in adults with alcoholic and nonalcoholic liver disease. Am J Clin Nutr. 1994;602:269-73.