PROCESS, WHY DOES IT NOT HAPPEN?
Iuri A. de Vasconcelos1, Marcella F. Soares2 and Luiz Fernando M. Heineck3
ABSTRACT
Lean construction principles emphasize indistinctively streamlining construction processes, being them part of the initial stages of construction or as suggested by Just-in-Time (JIT) concentrated nearer to customers taking possession of the new building. Every new project offers an opportunity to start afresh with better management techniques and it might be taken that this earlier period, free from time pressures to hand over the building, is more receptive for the application of lean concepts, as compared to latter stages. As a hypothesis, it is believed that cash flow could be jeopardized and the strategic decision to leave greater proportion of work for the end of construction might decrease the effect of ongoing lean management techniques or require greater efforts in connection to them. This research work investigates the application of lean construction principles on a 16,800sqm construction site in Fortaleza, Brazilian northeast, investigating performance outcomes as related to management lean grading according to a questionnaire developed by Hofacker (2008). It concludes that work disruptions, rework and making ready activities near to the end of the construction period accumulates and lean grading decreases when it is possibly most needed to deliver customers the required quality.
KEY WORDS
Final Stages of Construction, Lean Construction, Interaction.
INTRODUCTION
Ballard and Howell (2004) maintain that traditional management philosophy, by analyzing stages of work as independent from each other, do not favor attaining clients requirements, as they emphasize individual productivity and speed of construction without due care for final building quality. Bernardes et al. (1998) describe quality problems in a series of 52 construction projects associating their reduction to the use of quality programs. A rate of 254 defects per 1000 sqmt is reduced to a tenth of this if the building company performs a series of quality enforcing measures throughout construction but mainly at its final stages, prior to client’s handover checklist. It is worth signaling that correcting for defects impose an
1
Master’s Degree Student, Structural Engineering and Civil Construction Department, 710 Pici University Campus, Univ. of Ceará, Brazil, BR 60455-760, Phone 011-55-88-33669607,
2
Master’s Degree Student, Hydraulic Engineering and Environmental Department, 713 Pici University Campus, Univ. of Ceará, Brazil, BR 60451-970, Phone 011-55-88-33669624,
3
Ph.D. Professor, Structural Engineering and Civil Construction Department, 710 Pici University Campus, Univ. of Ceará, Brazil, BR 60455-760, Phone 011-55-88-33669607,
extra cost of some 3% of building costs, what amounts to US$ 16,00/sqmt, that is, savings can be in the region of US$ 14,40/sqmt, provided a proper management system is employed.
Costa (2007) takes a different view showing that while problems accumulate towards the end of the construction projects, communications between site managers and operatives become scarce. This is contrary to what common sense would dictate: when most needed management action is hampered. It is a common say in Brazilian sites that the end of construction is plagued with dismantling management and control systems for the sake of attaining greater management flexibility and production speed, in order to accommodate time pressures and attain due dates. According to Lundkvist and Meiling (2011), several studies about the construction sector have shown that new projects are designer with a huge number of faults. Companys deal with the problems in a reactive way. They await the client inspection to correct the defects appointed and then move onto the next project.
Valente (2011) developed a managerial lean grading questionnaire and applied it to a leading building company in the Brazilian northeast. A series of research papers have been presented at IGLC meetings describing their Toyota Production System - TPS achievements since 2004 such is Kemmer et al. (2007, 2008, 2009). Despite the high marks obtained throughout the 36 months construction period of a particular building development, it can be seen in Figure 01 that those marks varied through time and steeply decreased during the last four months of construction. As a matter of fact, there is an oscillating behavior that starts around the 11th month of construction. It can be hypothesized that this initial decrease in lean construction adoption is related to the end of the reinforced concrete structure construction period. Lean gradings might be high at this period since it is characterized by a small amount of activities to be performed cyclically (forming, reinforcing, concreting and curing) what do not represent a difficult management task. It also could be associated with a lack of enthusiasm after initial lean construction successful implementation. What is remarkable is that during 6 months starting by the 24th month of execution lean was at its best, such as it makes difficult to understand why after this recovery lean marks once more decreased towards the end of the construction period (VALENTE 2011).
Figure 1: Lean evolution model of an enterprise (Valente 2011)
METHODOLOGY
The authors were involved with the construction of a 16.800 sqmt project, comprising 208 apartments divided into 5 blocks, 7 storeys each. A general view of the site can be seen in Figure 2.
Figure 2: Overview of the site
The building company has 25 years experience in apartment and house building and is well acquainted with quality programs and lean construction developments. It is part of a holding that runs colleges, high schools and faculties, the latter in the business administration area. During the last ten years it incorporated quality systems that were inherited from a major brazilian building company that from 1985 up to 1996 led the building quality movement in the country. It is well aware of lean construction developments that are taking place in Fortaleza, making part of a group of building companies called INOVACON (Francelino et al. 2006). During its strategic annual planning meetings the holding considered hosting lean construction programs within its academic activities, using their construction sites as learning and demonstration projects.
At first, research objectives were connected to find out if such a positive management environment in terms of quality and lean construction was still associated with quantitative large number of work disruptions and rework. It was not expected that this would occur, but daily observations throughout the construction period indicated that this was the case. As it will be demonstrated, just end of construction work disruptions amounted to 500 (some 30 for each 100 square meter, what is in line with what was previously revealed by the literature review).
As this figure was considered high for a supposedly well managed site, research was directed to evaluate if the building site was run according to lean principles, how this evaluation might change through time and the consequences of a decrease/increase in lean marks obtained by site management.
RAPID LEAN CONSTRUCTION-QUALITY MODEL - LCR
A number of lean evaluation models are available including Hofacker (2008) that was finally chosen as comparative tool for this research work. Rocha et al. (2004) proposed two analytical devices. First a questionnaire that opposes what is deemed as lean management behavior to what is taken as standard good project management practice. Then they produce a 100 questions checklist about facts that might be occurring on site but are only perceived through lean management eyes. Both were considered lengthy and too much detailed for the purposes of this research work. Valente (2011), as already mentioned, put forward a simpler tool, but it is very much biased to the jargon and practices of a leading lean construction practioner.
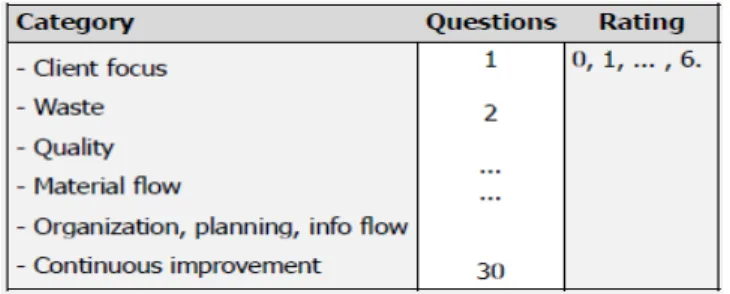
Hofacker model is based on a questionnaire with 30 items divided into 6 categories addressing principles advanced both by Womack, Jones and Roos (1990) and Koskela (1992). For each question a rating system 1 to 6 expresses how much adherence to the principle manager’s belief their project follows. Each question translates the best practices of the category. Figure 3 shows part of the questionnaire.
Figure 3: Input - standardized questionnaire (Hofacker et al. 2008)
Hofacker suggests using two different sources of information (appraisers), was followed: a building company site engineer and a former site assistant, both with a good training on lean concepts were interviewed. Due to their academic background is it believed that their opinions are coherent to real site circumstances, with no intention in altering lean ratings due to commercial or professional interests.
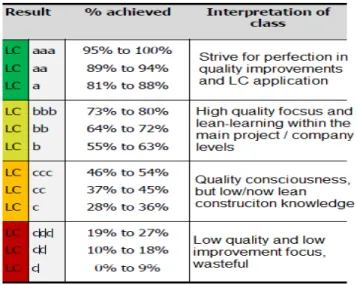
The results are the average of the responses of the two appraisers for each class. Finally, the averages generate the degree of engagement with the lean construction as shown in Table 1. Results are displayed through a diagram as it is depicted in Figure 4. Four different regions of lean concepts adherence are shown, with colours matching 9 lean construction ratings ranging from d to aaa. Table 1 shows how to classify average ratings for the 6 categories under investigation.
Table 1: Categorization and interpretation (Hofacker et al. 2008)
RESULTS AND DATA ANALYSIS
Hofacker model was applied around midterm and at the final stages of construction. By midterm it is taken half the total period of construction that embraces some 36 months. Final stages were the last 6 months, most of them used to hand over apartments to the clients and providing corrections to non-conformities detected both by site engineers and clients.
Mid-term average result of 60.25% gives this site a B rating according to Table 1 and indicates initial steps in lean application but a somehow established practice of quality management. This compares well with results put forward by Hofacker, while studying brazilian sites (Site 1: 50% - CCC and Site 2: 70% - BB).
Final stage of construction result of 44.92% identifies this site to level CC. According to Table 1 it can be argued that the site was quality conscious but not focused (what will be illustrated further on in connection with building details that after rework were still not performing well). In addition, lean knowledge and its application were poorly taken into consideration.
Those results compared badly with Valente (2011) graph for a leading company, as those are in the region of 85-98% compliance with lean principles. At the end of the construction period Valente’s site lost 10 percentage points (Figure 1), while the site under investigation lost more than 15. It should be noted that direct comparisons are not possible due to the fact that the evaluation systems are different.
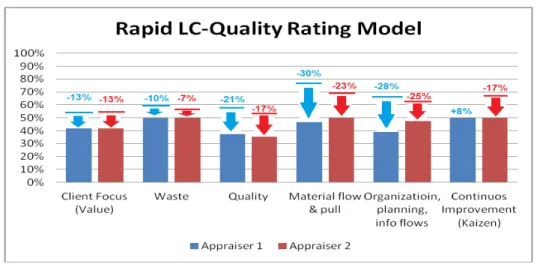
Figure 5: Appraiser's responses – before and during Final Stage of Construction
Figure 6 is a more transparent form of illustrating lean involvement. The first draws what already has been achieved in terms of lean implementation. It is interesting to note that further to the figure’s borders are the best marks, and greater areas that need to be coloured in green. As areas are increasingly greater as the circle radius increases this is in line with the difficulties (and merits) the site faced to improve its lean practices. It is also possible to see these measures in the graphic.
Figure 6: Direct visualization of Lean Degree – before and during Final Stages
Figure 7: Comparison of Lean Degree – before and during Final Stages
QUALITY PROBLEMS IN THE FINAL STAGES OF CONSTRUCTION
Previous section analyses quantitatively how much lean this site was and its decreasing status related to this management philosophy towards the end of the construction period. This section purports to qualitatively investigate possible consequences of this inability to sustain lean implementation efforts throughout construction duration. As evidences indicated quality achievements at the lowest LCR ratings, research effort was directed to analyze them in terms of number of occurrences, client’s perception and cost of remedial rework. Three sources of data were available: photographic records of possible rework demanding details, client’s checklists filled at the handing over contractual stages and cost accounting records in connection with making good, rework and remedial work to satisfy client’s checklist requirements.
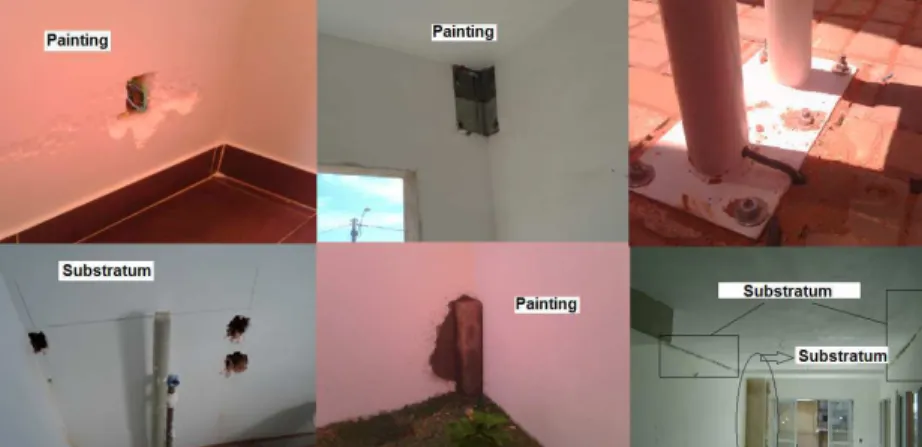
Photographic records portrayed in Figure 8 give a testimony that the building final appearance looked fragile and denouncing that rework or making good activities were executed. This is not what to be expected from a long experienced building company, benefiting from a lean environment with a brand name that should be preserved as it belongs to a reputable holding well known for the quality of its academic colleges and faculties.
Additional labor costs to perform rework and making ready activities were in the region of R$ 35,000.00 (around US$ 20,000.00) what seems quite small when compared to total labor costs for the entire site amounting to R$ 5,000,000.00 (US$ 3,000,000.00). It was not possible to collect materials and indirect costs associated with these activities. The former are deemed to be small as normally they require extra amounts of mortar, jointing materials and painting, what in general are inexpensive buys. Indirect costs due to site logistics, interference with other ongoing activities and demotivation factors might be substantial but their analyses were beyond the scope of this research work. In all, it is taken as a hypothesis for further work that total costs are still small when compared with total revenues from 208 apartments sales in the region of R$ 30,000,000.00 (US$ 18,000,000.00) or total construction costs of R$ 17,000,000.00 (US$ 10,000,000.00).
Client’s appointed defects extracted from handing over checklists amounted to some 700 observations (an average of 3.4 for each of the 208 apartments under construction). It is interesting to note that according to Figure 9 there is a direct correlation between the percentage of defects and costs incurred both before and after their detection.
Figure 9: Nexus between the percentage of defects and major additional costs
It is worth mentioning that costs were not incurred only after clients did required remedial work: they might also had been needed to improve building details site managers were not happy with and most probably assessed as fatally noticeable to clients. In this sense this correlation is not a tautology, that is, the not necessarily greater amount of defects will be associated with greater amount of costs.
For example, costs were also incurred to arrive at the building appearance depicted in Figure 10: those details, fragile incorrect and badly performing as they might be were not further spotted in client’s checklists.
It is instructive to relate percentage occurrence of costs and defects with their timing. Four different building stages of work concentrated the majority of defects and costs: painting (29% of defects and 43% of remedial costs); external balcony grids (18%, 5%), external windows (10%, 10%) and wall’s rendering - Substratum (19%, 16%). They accounted for 76% of defects and 74% of costs. A general category ‘others’ was created to accommodate the myriad of less important problems, amounting to a total of 24% of defects and 26% of costs. Typical problems that were detected within this latter category are problems with tile coating, plumbing, electrical installations and gas installations.
It can be taken that painting, grids and windows problems are typical final stages of construction operations, while rendering is a mid term one. By definition, the other category should be undistinguishable allocated to both periods of time. Thus means that the majority of problems and their costs occurred when lean management efforts were at is minimum. Table 2 depicts the division of problems and their costs according to mid term and final stages of construction.
Table 2: Segregation of defects and their costs before and during Final Stages
Mid term Final stages
Percentage of problems 19% 57%
Percentage of costs 16% 58%
Other activities problems 24%
Other activities costs 26%
LCR ratings 60.25% 44.92%
CONCLUSIONS
ACKNOWLEDGEMENTS
This paper was made possible by the support provided by the Coordination of Improvement of Higher Education Personnel.
REFERENCES
Ballard, G.; Howell, G. A. (2004). “Competing construction management paradigms.” Lean Construction Journal, 1 (1), 38-45.
Bernardes, C; Arkie, A.; Falcão, C. M.; Knudsen, F.; Vanossi, G.; Bernardes, M.; Yaokiti, T. (1998). U. Qualidade e o custo das não-conformidades em obras de construção civil. São Paulo: Pini.
Costa, A. C. F. (2007). A comunicação no gerenciamento da execução de projetos enxutos da construção civil – uma perspectiva da linguagem ação. Dissertação (Mestrado em Engenharia Civil) – Programa de Pós-Graduação em Engenharia Civil, Universidade Federal de Santa Catarina, Florianópolis.
Francelino, T. R.; Barros Neto, J. P.; Heineck, L. F. M.; Teixeira, M. C.; Kemmer, S. L. (2006). Melhorias de processos com a aplicação da filosofia lean. In: XXVI ENEGEP, Ceará.
Hofacker, A.; Oliveira, B. F.; Gehbauer, F.; Freitas, Maria do Carmo Duarte; Mendes Júnior, R.; Santos, A.; Kirsch, J.(2008). “Rapid lean construction-quality rating model (LCR).” 16th International Group for Lean Construction Conference (IGLC16), 2008, Manchester, UK.
Kemmer, S. L., Alves, T. C. L., Macedo, M., Novaes, M. V. and Barros Neto, J. P. (2009) “Lean office at a construction firm” Proceedings 17th Annual Conference Production System Design of the International Group for Lean Construction (IGLC 17), 15-17 July 2009, Taipei, Taiwan.
Kemmer, S. L., Heineck, L. F. M., and Alves, T. C. L. (2008) “Using the line of balance for production system design.” Proceedings 16th Annual Conference of the International Group for Lean Construction (IGLC 16), 16-18 July 2008, Manchester, United Kingdom.
Kemmer, S. L.; Heineck, L. F. M.; Novaes, M. V.; Mourão, C. A. M. A. and Alves, T. C. L. “Medium-term planning: contributions based on field application.” Proceedings 15th Annual Conference of the International Group for Lean Construction (IGLC 15), 18-20 July 2007, East Lansing, Michigan, USA.
Koskela, L. Application of the New Production Philosophy to Construction. Technical Report 72. Center for Integrated Facility Engineering. Department of Civil Engineering. Stanford University. 1992.
Lundkvist, R. & Meiling, J. (2011). “Towards an experience feedback system from building inspections through classification of construction works.” Proceedings of the CIB W78-W102 2011: International Conference, Sophia Antipolis, France. Rocha, F.; Heineck, L.; Rodrigues, I.; Pereira, E. Logística e Lógica na Construção
Lean: um processo de gestão transparente na construção de edifícios. Fortaleza: Fibra, 2004.
Valente, C. P. Acompanhamento e Avaliação Lean em um Canteiro de Obras: Uma Proposta de Auditorias Lean. 2011. 64 p. Monografia (Engenharia Civil), Universidade Federal do Ceará.