Article
#Current adress: Instituto de Química, Universidade Estadual Paulista,
14801-970 Araraquara-SP, Brazil. Tel: +55-16-33016620. *e-mail: [email protected]
Construction and Application of an Electrochemical Sensor for Paracetamol Determination
based on Iron Tetrapyridinoporphyrazine as a Biomimetic Catalyst of P450 Enzyme
Maria D.P.T. Sotomayor,*,#, a Anderson Sigoli,a Marcos R.V. Lanza,a Auro A. Tanakab and Lauro T. Kubotac
aUniversidade São Francisco, 12916-900 Bragança Paulista-SP, Brazil
bDepartamento de Química, Universidade Federal do Maranhão, 65085-580 São Luís-MA, Brazil
cInstituto de Química, Universidade Estadual de Campinas, 13083-970 Campinas-SP, Brazil
Descreve-se a construção e aplicação de um sensor biomimético para determinação de paracetamol em diversos tipos de amostras. O sensor foi construído modificando a superfície de
um eletrodo de carbono vítreo com membrana de Nafion® dopada com tetrapiridinoporfirazina de
ferro (FeTPyPz). Esse sensor apresentou melhor desempenho em tampão acetato 0,1 mol L-1 e pH
3,6. Nessas condições o potencial de oxidação do paracetamol foi de 445 mV vs. Ag|AgCl. O sensor
apresentou uma faixa de resposta linear entre 4,0 e 420 µmol L-1, sensibilidade de 46,015 mA L
mol-1 cm-2, limite de quantificação de 4,0 µmol L-1 e limite de detecção de 1,2 µmol L-1. Estudos
eletroquímicos e de seletividade demonstraram a propriedade catalítica da FeTPyPz como sendo similares a da enzima P450 na oxidação do paracetamol. O sensor foi usado na determinação de paracetamol em formulações comerciais e no acompanhamento de sua degradação eletroquímica em efluentes provenientes de um reator em escala piloto.
This work describes the construction and application of a biomimetic sensor for paracetamol determination in different samples . The sensor was prepared by modifying a glassy carbon
electrode surface with a Nafion membrane doped with FeTPyPz. The best performance of the
sensor in 0.1 mol L-1 acetate buffer was at pH 3.6. Under these conditions, an oxidation potential
of paracetamol was observed at 445 mV vs. Ag|AgCl. The sensor presented a linear response
range between 4.0 and 420 µmol L-1, a sensitivity of 46.015 mA L mol-1 cm-2, quantification and
detection limits of 4.0 µmol L-1 and 1.2 µmol L-1, respectively. A detailed investigation about its
electrochemical behavior and selectivity was carried out. The results suggested that FeTPyPz presents catalytic properties similar to P450 enzyme for paracetamol oxidation. Finally, the sensor was applied for paracetamol determination in commercial drugs and for the monitoring of its degradation in an electrochemical batch reactor effluent.
Keywords: biomimetic system, P450 enzyme, paracetamol, iron tetrapyridinoporphyrazine, electrochemical degradation
Introduction
There are many enzymes in nature that can be mimicked aiming for biomimetic sensor constructions,1 which the
chemistry of the enzymatic catalysis is well known. In addition, there is a lot of information in literature about P450 enzymes that catalyze a great variety of important biological reactions, including hydroxylation of alkanes, xenobiotics, pharmaceuticals products and drugs.2,3
Lately many efforts have been made for mimicking the catalytic activities of P450 enzymes, in order to understand their reaction mechanisms. As a result, porphyrins and phtalocyanines of iron, manganese and cobalt, have been reported as biomimetic catalysts of P450 enzymes,4-6 and their
Determination of many substrates of P450 enzymes is extremely important for the environmental field and attempts to develop biomimetic sensors by using catalysts with structure analogous to the P450 active center (Figure 1a) are very attractive.
Among the substrates of P450, which can be monitored in aquatic environments, is paracetamol (acetaminophen or N-acetyl-4-aminophenol). As a consequence of its great demand and production, due to its use as an alternative to aspirin (acetylsalicylic acid) and dipyrone, it contaminates the aquatic environment, because it is discharged in great amount, mainly in wastewaters.
Paracetamol is metabolized by P450 by a cyclical dehydrogenation,7 as shown in equation 1 and Scheme
1:8
(1)
On the other hand, the necessity of monitoring pollutants in pharmaceutical industries wastewaters with biomimetic catalyst instead of biological catalysts, is economically more interesting, due to the denaturation of
the biological catalyst. Since the catalyst is responsible for the electrochemical signal, effluent analysis with conventional biosensors can not be used for practical reason. These restrictions make the use of biomimetic sensors highly convenient and promising.
So, the use of compounds such as iron(III) tetrapyridinoporphyrazine (Figure 1b) is very attractive in order to verify its potential to mimic some P450 enzymes, when immobilized on a electrode surface for sensing some of P450 substrates.
In this work we described the use of FeTPyPz complex as a biomimetic catalyst of P450 enzyme and its application in the construction of a sensor for paracetamol determination in pharmaceutical samples taken from an electrochemical batch reactor effluent that was used for drug degradation.
Experimental
Chemicals and solutions
All chemicals used in the construction and application of the sensor were analytical grade reagent. All chemicals used
in the chromatographic experiments were high performance liquid chromatography (HPLC) grade reagent.
Iron(III) tetrapyridinoporphyrazine (FeTPyPz)
was prepared and purified as previously described.9
Potassium hexacyanoferrate(II) trihydrate, potassium hexacyanoferrate(III) were acquired from Ecibra, São
Paulo, Brazil. Monopotassium phosphate (KH2PO4),
sodium hydroxide, potassium sulfate, acetic acid and
N,N-dimethyformamide (DMF) were acquired from
Synth, São Paulo, Brazil. Paracetamol (acetaminophen), piperazine-N-N’-bis[2-ethanesulfonic acid] (Pipes) and
N-[2-hydroxyethyl]piperazine-N’-[2-ethanesulfonic acid]
(Hepes) were acquired from Sigma, St. Louis, USA.
Sodium dipyrone, 5% (m/v) Nafion solution were from
Aldrich, Milwaukee, USA. Salicylic acid, sodium oxalate, sodium succinate, sodium acetate, acetylsalicylic acid (ASA), caffeine and sodium diclofenac were acquired from Merck, Darmstadt, Germany. All HPLC grade solvent were resulting from Tedia, Rio de Janeiro, Brazil.
Paracetamol and buffer solutions were prepared with water purified in a Milli-Q Millipore system and the actual
pH determined in a Digimed® (DM-20) pH-meter.
Biomimetic sensor construction
Firstly, a solution containing 5 mg mL-1 of the complex
in DMF was prepared, following the procedure previously described by Kubota et al.10-12 Then, the surface of a
glassy carbon (GC) electrode, acquired from Metrohm,
Switzerland with a geometrical area of 0.126 cm2, was
cleaned according to the procedure described in the literature.13 After cleaning the GC electrode, 100 µL of
FeTPyPz solution was mixed with 50 µL of 5% (m/v) Nafion solution, and an aliquot of 50 µL of this mixture
was placed on the surface of GC electrode. Finally, the solvent was evaporated at room temperature during 6 h, forming a thin green film.
For comparative studies, a CG electrode with the same characteristics of that used for the construction of the sensor, was modified with a simple Nafion® membrane.
Thus, 50 µL of 1.67% (m/v) Nafion solution, prepared in
DMF, was placed on the GC electrode surface. After the solvent evaporation at room temperature, a thin colorless film resulted.
Electrochemical measurements
Voltammetric and amperometric measurements were carried out in a potentiostat from Echo Chemie (Autolab PGSTAT30 model) Utrecht, Netherlands, coupled to a personal computer with GPES 4.9 software for data Figure 1. Chemical structures of (a) protoporphyrin IX, the active site in
acquisition and potential control. All electrochemical measurements were performed in a conventional three-electrode cell at room temperature, with an Ag|AgCl electrode, a platinum wire and the GC electrode, modified
with Nafion membrane doped with FeTPyPz (sensor), as
reference, counter and working electrodes, respectively. Experiments of cyclic voltammetry were carried out in 5.00 mL buffer. Cyclic voltammograms of paracetamol were obtained by adding successively 50 µL aliquots of 4.0 × 10⁻³ mol L-1 of standard solutions into the cell,
and scanning the potential range from 0 up to 0.65 V vs.
Ag|AgCl at 0.02 V s-1.
Chromatographic measurements
In order to validate the results of the proposed sensor, they were compared to those from chromatographic
method, based on HPLC.14 Chromatographic analyses were
performed in a Shimadzu® model 20A liquid chromatograph
coupled to an UV/Vis detector (SPD-20A), auto sampler
(SIL-20A) and a degasser DGU-20A5, coupled to a personal
computer. A C18 column (250 × 4.6 mm, Shim-Pack
CLC–ODS) was used, fixed inside an oven (Shimadzu®
CTO – 10AS) to keep the temperature at 30 °C. Mobile phase was a mixture of methanol and 0.020 mol L-1 acetate
buffer (pH 4.0) in a ratio of 13:87 (v/v). The flow rate was
1.0 mL min-1 and a 20 µL injection sample volume, with
absorption set at 254 nm.
Pharmaceutical formulation analysis
Paracetamol quantification in commercial samples using the proposed sensor was carried out according to the external standard method. Samples of two commercial solutions, Tylenol® (Janssen-Cilag) containing 200 g L-1
(1.32 mol L-1 paracetamol), were analyzed without
additional treating, only a simple dilution (250-fold) with deionized water.
Wastewater analysis
Wastewater samples were taken from an electrochemical batch reactor in which paracetamol was decomposing. The reactor electrolyte was a solution of 0.1 mol L-1 K
2SO4
containing initially 200 mg L-1 paracetamol. This solution
was submitted to electrolysis for two hours, in a range of constant currents (1, 2, 4, 6, 8 and 10 A) to investigate the current influence in paracetamol decomposition. All electrolyses were carried out at 1.2 V potential vs. SCE, using a Tectrol TCA stabilized source. Samples were collected each hour to monitor paracetamol concentration
both by sensor and chromatography, without any previous treatment, by the simple external standard method.
Results and Discussion
Effect of FeTPyPz on the sensor response
In the first step, cyclic voltammetry experiments (0 to 800 mV vs. Ag|AgCl, 20 mV s-1 scan rate) were carried out
in order to evaluate the bare response of the GC electrode for paracetamol. The results showed that paracetamol irreversibly oxidizes on the electrode surface at potentials
higher than 600 mV vs. Ag|AgCl. When amperometric
experiments (applied potential of 600 mV vs. Ag|AgCl) were carried out, no variation in the current was observed for the successive additions of paracetamol. These results demonstrated the inefficiency of the unmodified GC electrode for paracetamol quantification.
After that, in order to verify the iron(III) complex influence in the sensor response, it was compared to a
GC electrode modified with a Nafionmembrane without
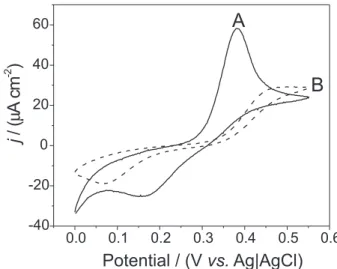
complex. Figure 2, demonstrates that FeTPyPz in the membrane provides higher currents, as well as more defined ones, when compared to those resulting from the modified
electrode with undoped Nafion® membrane, clearly
indicating the role of the complex in the sensor response. Nevertheless, the response profile of the sensor was not the expected for an enzyme catalytic process, in which an increase of current happens in only one direction (oxidation or reduction). So, to verify in which conditions and if the complex would offer the desirable pseudo-enzymatic
Figure 2. Cyclic voltammograms obtained in a 0.1 mol L-1 phosphate
buffer (pH 7.0) containing 7.5 × 10⁻⁴ mol L-1 of paracetamol. (A)
Proposed sensor, GC electrode modified with a Nafion® membrane doped
with FeTPyPz; (B) GC electrode modified with an undoped Nafion®
profile, an exhaustive investigation of the experimental conditions for paracetamol oxidation were performed.
For this, 0.1 mol L-1 buffer solutions with different
pH values (3.5-10.0) were tested. The tested buffers were acetate, phosphate and borate. Figure 3 shows the response for 4.5 × 10⁻⁴ mol L-1 paracetamol in 0.1 mol L-1 acetate
buffer at pH 3.5. It can be observed that in presence of paracetamol the oxidation peak corresponding to the iron(II) oxidation in the complex disappeared (see in curve
A at potential of 325 mV vs. Ag|AgCl). At the same time,
an anodic peak with high current intensity was obtained, while no catodic peak appeared. This response profile was observed only in pH solutions values between 3.5 and 5.5. This behavior was very convenient, because most of the samples are acids. For higher pH values, this profile was not observed, although redox couples for paracetamol (Figure 3, curve A) were observed in which the anodic and catodic current intensities increased with paracetamol concentration, but not linearly.
pH solution influence on the catalytic responses for paracetamol with the proposed sensor can be explained by the electrochemical characteristics of FeTPyPz, previously reported by Tanaka et al.9 Figure 4 illustrates
voltammograms obtained with the sensor in different buffer solution pHs. In acid solutions (pH < 5.5) a redox couple was clearly observed, corresponding to the pair Fe(III)/ Fe(II), in accordance to previously reported results.9 For
solutions of pH 6.0 to 7.5, the catodic peak disappears, and until pH > 8.0, no redox couple is observed. This behavior can be explained by the redox process dependence with the hydroxyl ion, equation (2).9
(2)
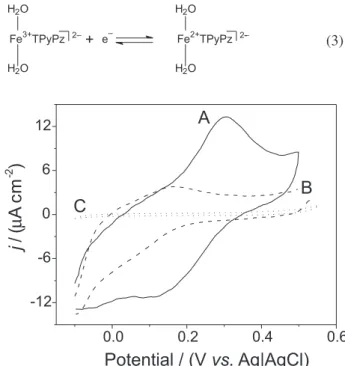
By increasing the hydroxyl concentration of the micro environment around the metallic center (Fe), it is gradually affected by the electronic changes of the molecule, and consequently, the electrochemical profile for Fe(III)/Fe(II) redox couple is also altered. On the other hand, in acid solutions this does not occur, and then the redox reaction of the metallic center is easily observed (equation 3).
(3)
In addition, it was observed that in pH solution lower than 5.5, the redox process for the FeTPyPz complex is
quasi-reversible (data not shown). Thus, it is logical to think that in acid solutions (pH < 5.5), in which the iron can change its oxidation states between 2 and 3, by a quasi -reversible process, the complex availability to oxidize paracetamol by a catalytic process is more probable than in basic solutions.
Based on these observations, further optimization experiments of the sensor response were carried out with buffer solutions in pH around 3.6.
Sensor response optimization
Buffer solution influence in the catalytic response for paracetamol was investigated with the proposed sensor. Figure 3. Catalytic profile for paracetamol oxidation on the proposed
sensor based on a GC electrode modified with a Nafion® membrane doped
with FeTPyPz. (A) 0.1 mol L-1 acetate buffer solution (pH 3.5) and (B)
containing 4.5 × 10⁻⁴ mol L-1 of paracetamol in the buffer.
Figure 4. Voltammetric profiles for FeTPyPz (immobilized in the Nafion®
membrane) as a function of pH. (A) 0.1 mol L-1 acetate buffer at pH 4.0;
(B) 0.1 mol L-1 phosphate buffer at pH 7.0; (C) 0.1 mol L-1 borate buffer
For this, different 0.1 mol L-1 buffer solutions at pH 3.6
were evaluated (Figure 5). In all cases the intended profile (catalytic) was confirmed.
Figure 5 shows that almost all buffers studied offer similar sensitivities. However, acetate buffer presented a slightly higher sensitivity and it was used for further optimization experiments.
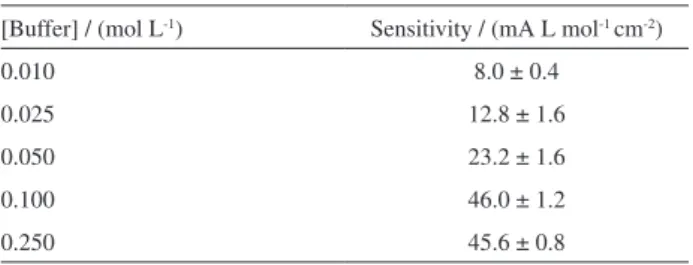
Buffer concentration is another parameter that can influence sensor response. Table 1 shows the effect of the acetate concentration (pH 3.6) in paracetamol oxidation.
It can be observed that in concentration range from 0.10 to 0.25 mol L-1, the sensor response is almost the same. For
this reason, 0.1 mol L-1 acetate buffer solution was used for
all measurements. Finally, pH influence in the range from 3.2 up to 4.0 (0.2 pH unit increments), demonstrated that in pH 3.6 a higher sensitivity was obtained.
Sensor analytical characteristic
Under these optimized conditions the sensor showed a linear response range from 4.0 up to 420 µmol L-1, which
can be expressed by equation (4):
(4)
with a correlation coefficient of 0.9994 for n = 10. Detection and quantification limits were established from the standard deviation from ten independent measurements of the blank and calculated according to
IUPAC recommendations.15 Detection and quantification
limits resulted to be 1.2 and 4.0 µmol L-1, respectively.
Measurement repeatability (evaluated as the relative standard deviation: RSD) was estimated as 3.4%, based on seven successive experiments carried out with a 240 µmol L-1
paracetamol sample. Sensor construction repeatability was evaluated by constructing four sensors and determining the sensitivity of each one. This repeatability, expressed as RSD, was 5%. This indicates a good repeatability in the sensor construction, possible due to the facility of the membrane preparation containing the complex. In fact, chemical modification of the electrode surfaces with ion-exchange polymers (ionomers) has attracted considerable attention in electroanalysis and electrocatalysis due to the polyelectrolyte films (such as Nafion) providing a simple and convenient method for fixing opposite charged redox-active ions at electrode surfaces.16
The sensor could be stored at room temperature, keeping its sensitivity for at least 180 days (evaluation period). Under operational conditions, the sensor was stable during more than fifty consecutive determinations (Figure 6), decreasing its signal by only 5% of the original value.
Studies related with the biomimetic behavior of FeTPyPz
In order to prove that FeTPyPz is mimicking the P450 active site, different experimental procedures were Figure 5. Influence of buffer solution composition in the sensor sensitivity
for paracetamol. Measurements carried out in 0.1 mol L-1 buffer solutions
at pH 3.6. Cyclic voltammograms obtained in the potential range between 0 and 650 mV vs. Ag|AgCl at 20 mV s-1.
Table 1. Influence of acetate buffer concentration in sensor sensitivity for paracetamol
[Buffer] / (mol L-1) Sensitivity / (mA L mol-1 cm-2)
0.010 8.0 ± 0.4
0.025 12.8 ± 1.6
0.050 23.2 ± 1.6
0.100 46.0 ± 1.2
0.250 45.6 ± 0.8
carried out. Firstly, checking if paracetamol oxidation on the proposed sensor occurs by an electrocatalytic process, changes of current density intensity were plotted as a function of potential scan rate (v). According to Figure 7, the resulting curve confirms the expected profile for a catalytic electrooxidation occurrence.17
In cyclic voltammetry it is known that, when the kinetics of the reaction is controlled by the diffusion of the species from the bulk solution to the electrode surface, the peak current (or density) is proportional to the square root of the scan rate, in agreement to Randles-Sevcik equation.18 In this sense, to
investigate if the paracetamol oxidation process is controlled by mass transport, a graph was plotted and the straight line fit could be expressed according to equation (5):
(5)
with a correlation coefficient of 0.9995 for n = 6, indicating that the paracetamol electrooxidation is a process controlled by diffusion.
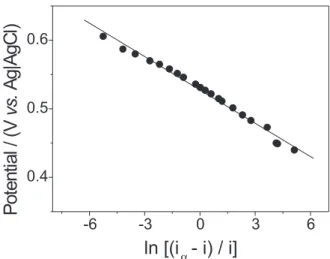
In attempt to estimate the number of electrons involved in paracetamol electrooxidation, E values as a function of ln((iα - i)/i) were plotted (Figure 8) from data taken from a cyclic voltammogram recorded at very slow scan rate (0.1 mV s-1).19 Thus, in this situation, the following linear
relation expressed by equation (6) was obtained:
(6)
with a correlation coefficient of 0.994 for n = 21. Finally, from the slope value, the resulting number of electrons
involved was obtained as 1.6. This suggests that the oxidation process of paracetamol involves 2 electrons, such
as in the enzymatic reaction with the P450 enzyme.7
In addition, using the angular coefficient of equation (5) together with Randles-Sevcik equation and the number of electrons involved in the paracetamol oxidation, it could be estimated for the first time, the diffusion coefficient corresponding to the average diffusion of paracetamol and its NAPQI (oxidation product) during the catalytic process.18 Thus, the following diffusion coefficient was
calculated: 1.066 × 10⁻⁶ cm2 s-1.
With these results it was possible to propose a mechanism that is plausible and can be supported by experimental evidences observed ,considering that the FeTPyPz complex has the same role of the P450 active site.
In order to verify the biomimetic behavior of the FeTPyPz-based sensor, the apparent Michaellis-Menten constant (Kapp
M) was estimated from Lineweaver-Burk
graph (Figure 9). As it can clearly be observed, the data could be adjusted by the equation (7):
(7)
with a correlation coefficient of 0.9995 for n = 32. The resulting value of 2.15 × 10⁻² mol L-1 for Kapp
M
indicates an affinity lower than the usually observed for enzymes. All these experimental evidences strongly suggest that the FeTPyPz complex could be considered as a compound that mimics P450 enzyme in paracetamol oxidation. Figure 7. A typical catalytic electrooxidation profile. 49 µmol L-1 of
paracetamol were electrooxidized by iron complex immobilized in a Nafion® membrane.
Figure 8. Linear relation between E (potential) and ln((iα – i)/i). Experiment was carried out with the proposed sensor immersed in a 0.1 mol L-1 acetate buffer solution (pH 3.6) containing 420 µmol L-1 of
Effect of interfering compounds
Sensor response was tested concomitantly in the presence of 50 µmol L-1 paracetamol, with four different
concentrations ratio of interferences. The evaluated compounds were: ASA, caffeine, diclofenac and salicylic acid. Results listed in Table 2 show that no significant interference of these compounds was observed.
Sensor application
The application of the proposed sensor was carried out in two different samples. The first, the most common one,
was in commercial formulations. The second one, was in effluent analysis taken from a electrochemical batch reactor, aiming to demonstrate the applicability of the biomimetic sensor in environmental samples.
Table 3 shows results of the determination of paracetamol in commercial formulations. Previously, in order to use the external standard calibration for paracetamol quantification, a recovery study to evaluate the matrix effect was carried out. It can be seen in Table
3 that no matrix effect was observed in Tylenol® samples
for paracetamol quantification with the proposed sensor. This was an expected result, once the Tylenol® sample was
diluted 250-fold for the sensor analysis. The higher value found for the sensor is in agreement with the typical average values in pharmaceutical formulations.
In our research group, an effort to develop alternative methods for effluents treatment was carried out, including mainly drugs degradation, such as paracetamol, ranitidine, diclofenac, etc. For this reason, electrochemical techniques were employed,,like gaseous diffusion electrodes coupled as cathodes in batch reactors. This generated in situ species highly oxidizing, for example, H2O2, which is directly responsible for pollutant degradation found in industrial effluents.20
Traditionally, effluents degradation monitoring have been performed by non-specific methods such as total organic carbon and oxygen chemical demand, with expensive instruments and time consuming analysis. Although, it is recognized that chromatographic methods are reliable, the monitoring of paracetamol degradation by HPLC, is very expensive, time consuming and is also susceptible to interferences. In addition, it is known that pharmaceutical industries generate high pH and high level of toxicity effluents from production and washing processes. In such cases, the use of biosensors in these samples is not possible. For all these arguments, the development of biomimetic sensors to analyze effluents is advantageous and opportune, since they provide a quicker and a cheaper analytical alternative.
Table 4 shows the results of the sensor used in the paracetamol degradation process in an electrochemical Figure 9. Lineweaver-Burk plot for paracetamol electrooxidation
catalyzed by FeTPyPz – based sensor.
Table 2. Recovery (%) for 50 µmol L-1 paracetamol in presence of differ-ent interfering compounds, at various molar ratios. Parameters calculated as percentage of the current value of a solution containing Paracetamol + interferent, with those of a solution without interference
Interferent Molar ratio Paracetamol : Interferent
1:200 1:2 1:1 2:1 4:1
ASA n.d. 92 ± 6 96 ± 6 104 ± 3 101 ± 2
Salicylic acid n.d. 105 ± 2 104 ± 4 103 ± 3 102 ± 1
Caffeine n.d. 108 ± 4 106 ± 4 101 ± 4 100 ± 2
Diclofenac n.d. 102 ± 2 102 ± 2 100 ± 3 100 ± 4
*standard deviation for three replicates; n.d. = not determined.
Table 3. Values of recovery (%) studies and quantification of paracetamol in Tylenol® (Janssen-Cilag) containing 200 mg mL-1
Sample
Paracetamol Recovery Paracetamol quantification (mg mL-1)
Found / (µmol L-1)
Added / (µmol L-1)
Recovered / (µmol L-1)
Recovery (%)
Labeled Sensor
Lot 302291(07/06)a 39 55 95 ± 2* 101 ± 2* 200 208 ± 13*
Lot HLL174 (09/08)a 39 55 96 ± 3* 102 ± 3* 200 211 ± 8*
batch reactor. Pharmaceutical degradation was carried out at six electrolysis currents. Aliquots of paracetamol,
were collected each hour in the reactor. All samples were analyzed by the standard chromatographic (HPLC) and by the proposed method. A good correlation between the values for the two analytical techniques, can be observed. Except for samples 14, 15, 17 and 18 (Table 4). This great difference can be attributed to HPLC method and not to the proposed sensor (Table 5), since HPLC analysis demand time and probably samples 14, 15, 17 and 18 were affected by some parameter that reduced their signal, while waiting to be analyzed (sometimes up to 24 hours).
Conclusions
It was possible to conclude that the biomimetic sensor allows a satisfactory paracetamol determination in different matrices. Although, it is recognized that a great number of papers reports paracetamol determination by various analytical techniques, this work demonstrated that an electrochemical sensor can be constructed with high performance, supported on a simple biomimetic catalyst, according to the chemistry of P450 enzyme. Thus, other models could be investigated to detect or quantify different analytes of pharmaceutical and/or environmental interest. On the other hand, some environments are highly adverse for enzymes and biomimetic sensors are a promising tool that presents similar sensitivity and selectivity compared to conventional enzymatic biosensors. An additional advantage is that the compound responsible for the Table 4. Paracetamol determination in samples taken from an
electro-chemical batch reactor
Sample# (Electrolysis
current, Electrolysis time)
Paracetamol / (mg L-1)
Deviation (%)
HPLC Sensor
1 (1 A, 0 h) 202 186 92
2 (1 A, 1 h) 132 134 102
3 (1 A, 2 h) 107 104 97
4 (2 A, 0 h) 188 191 102
5 (2 A, 1 h) 132 128 97
6 (2 A, 2 h) 103 93 90
7 (4 A, 0 h) 199 205 103
8 (4 A, 1 h) 139 125 90
9 (4 A, 2 h) 104 105 101
10 (6 A, 0 h) 191 205 107
11 (6 A, 1 h) 124 116 94
12 (6 A, 2 h) 88 96 109
13 (8 A, 0 h) 181 204 113
14 (8 A, 1 h) 18 115 639
15 (8 A, 2 h) 17 88 517
16 (10 A, 0 h) 185 210 114
17 (10 A, 1 h) 31 106 342
18 (10 A, 2 h) 15 83 553
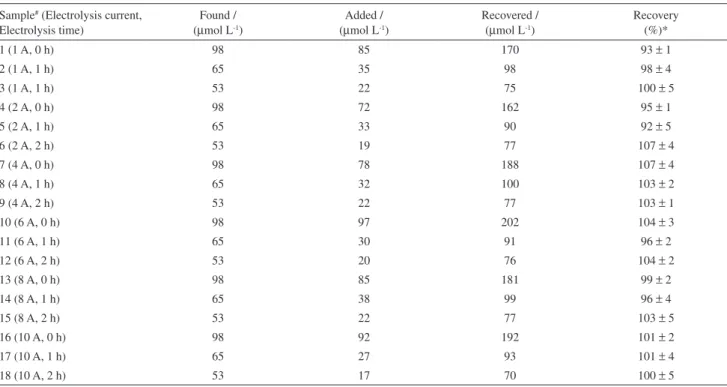
Table 5. Values of recovery studies of paracetamol in samples taken from an electrochemical batch reactor
Sample# (Electrolysis current,
Electrolysis time)
Found / (µmol L-1)
Added / (µmol L-1)
Recovered / (µmol L-1)
Recovery (%)*
1 (1 A, 0 h) 98 85 170 93 ± 1
2 (1 A, 1 h) 65 35 98 98 ± 4
3 (1 A, 1 h) 53 22 75 100 ± 5
4 (2 A, 0 h) 98 72 162 95 ± 1
5 (2 A, 1 h) 65 33 90 92 ± 5
6 (2 A, 2 h) 53 19 77 107 ± 4
7 (4 A, 0 h) 98 78 188 107 ± 4
8 (4 A, 1 h) 65 32 100 103 ± 2
9 (4 A, 2 h) 53 22 77 103 ± 1
10 (6 A, 0 h) 98 97 202 104 ± 3
11 (6 A, 1 h) 65 30 91 96 ± 2
12 (6 A, 2 h) 53 20 76 104 ± 2
13 (8 A, 0 h) 98 85 181 99 ± 2
14 (8 A, 1 h) 65 38 99 96 ± 4
15 (8 A, 2 h) 53 22 77 103 ± 5
16 (10 A, 0 h) 98 92 192 101 ± 2
17 (10 A, 1 h) 65 27 93 101 ± 4
18 (10 A, 2 h) 53 17 70 100 ± 5
7. Sono, M.; Roach, M. P.; Coulter, E. D.; Dawson, J. H.; Chem. Rev.1996, 96, 2841.
8. Heitmeier, S.; Blaschke, G.; J. Chromatogr. B1999,721, 93. 9. Tanaka, A. A.; Fierro, C.; Scherson, D. A.; Yeager, E.; Mat.
Chem. Phys.1989,22, 431.
10. Sotomayor, M. D. P. T.; Tanaka, A. A.; Kubota, L. T.; Electroanalysis2003, 15, 787.
11. Sotomayor, M. D. P. T.; Tanaka, A. A.; Kubota, L. T.; Electrochim. Acta 2003, 48, 855.
12. Sotomayor, M. D. P. T.; Tanaka, A. A.; Kubota, L. T.; J. Electroanal. Chem.2002, 536, 71.
13. Calvo-Marzal, P.; Rosatto, S. S.; Granjeiro, P. A.; Aoyama, H.; Kubota, L. T.; Anal. Chim. Acta2001, 441, 207.
14. Lunn, G.; HPLC-Methods for Pharmaceutical Analysis, John Wiley & Sons, Inc.: New York, 2000,vol. 1.
15. Currie, L. A.; Anal. Chim. Acta 1999, 391, 105.
16. Komura, T.; Yamagushi, T.; Sato, H.; Shimatani, H.; Takahashi, K.; Electrochim. Acta2001, 46, 3579.
17. Caro, C. A.; Bedioui, F.; Zagal, J. H.; Electrochim. Acta2002, 47, 1489.
18. Cruz, A. G. B.; Wardell, J. L.; Simão, R. A.; Rocco, A. M.; Electrochim. Acta 2007, 52, 1899.
19. Bard, A. J.; Faulkner, L. R.; Electrochemical Methods: Fundamentals and Applications, 2nd ed., John Wiley & Sons, Inc.: New York, 2001.
20. Forti, J. C.; Rocha, R. S.; Lanza, M. R. V.; Bertazolli, R.; J. Electroanal. Chem. 2007, 601, 63.
Received: September 30, 2007
Web Release Date: April 29, 2008
FAPESP helped in meeting the publication costs of this article. chemical recognition does not denaturize, since it contains
inorganic substances and not biological recognizers. In this sense, this work has shown that FeTPyPz could be considered as a biomimetic catalyst of P450 enzyme for paracetamol oxidation. The biomimetic sensor showed good performance, selectivity and sensitivity, allowing a satisfactory determination of paracetamol in commercial formulations and effluents.
Acknowledgments
The authors acknowledge the financial support from the Conselho de Desenvolvimento Científico e Tecnológico, Brazil (Proc. CNPq 470025/2006-9 and 479473/2006-4). M.D.P.T.S. is indebted to Fundação de Amparo à Pesquisa do Estado de São Paulo, Brazil (Proc. FAPESP 2005/03537-9) for the fellowship.
References
1. Sotomayor, M. D. P. T.; Kubota, L. T.; Quim. Nova2002, 25, 123.
2. White, R. E.; Groves, J. T.; McClusky, G. A.; Acta Biol. Med. Ger.1979, 38, 475.
3. Nelson, S. D.; Pearson, P. G.; Ann. Rev. Pharmacol. Toxicol.
1990,30, 169.
4. Nam, W.; Lee, H. J.; Oh, S. Y.; Kim, C.; Jang, H. G.; J. Inorg. Biochem.2000, 80, 219.
5. Banfi, S.; Montanari, F.; Quici, S.; J. Org. Chem. 1988, 53, 2863.