* Corresponding author.
E-mail address: [email protected] (M. Ghazimoradi) © 2016 Growing Science Ltd. All rights reserved.
doi: 10.5267/j.dsl.2016.2.002
Decision Science Letters 5 (2016) 395–406
Contents lists available at GrowingScience
Decision Science Letters
homepage: www.GrowingScience.com/dsl
Diagnosing the success of the construction projects during the initial phases
Mostafa Ghazimoradia*, Ali Kheyroddinb and Omid Rezayfarc
aPh.D. Student of Construction Management, Semnan University, Semnan, Iran bProfessor, Department of Civil Engineering, Semnan University, Semnan, Iran cAssistant Professor, Department of Civil Engineering, Semnan University, Semnan, Iran C H R O N I C L E A B S T R A C T
Article history:
Received October 25, 2015 Received in revised format: December 12, 2015 Accepted February 14, 2016 Available online
Februray 14 2016
As construction projects are becoming more deployed and more complicated at the same time, having an instrument for anticipation of success has become a primary requirement for every stakeholder. On this basis, several models have been introduced which implement different methods for anticipation of the entire goals or a series of goals of projects. In this research, at the first step, 16 criteria as instruments of anticipation of success and 33 factors as required instruments for obtaining success were extracted through library studies, semi-structured interviews and the Delphi method. At the next step, by having 169 questionnaires filled by senior managers of construction projects, the importance and priority of each of these 16 criteria and 33 factors for the initial phases of projects were determined according to Iran’s local conditions. Ultimately, through modeling of data by a propagation neural network including 35 hidden layers, the anticipator model for success of construction projects during their initial phases was developed with Performance and Regression. This model is able to anticipate the level of realization of projects’ success criteria according to the level of realization of success factors at the initial phase.
Growing Science Ltd. All rights reserved. 6
© 201
Keywords:
Anticipation of success Criterion
Factor
Construction project Initial phase Neural networks
1. Introduction
hand, roughly long lifecycle of construction projects has led to introduction of errors into the results provided by anticipator models.
The purpose of the present research is to provide a model to forecast the level of realization of success criteria according to the level of realization of success factors at the initial phase.
2. Review of Literature
2.1 Anticipation of project success
In early 1900s, the word success was, for the first time, academically introduced in the contexts of industry (Atkinson, 1999; Wit, 1988). The initial definitions were simple and qualitative. However, as the range of projects was expanded, more complicated definitions were developed with more deployed dimensions including both qualitative and quantitative concepts (Lavagnon, 2009). At first, the subject of assessment of success of finished projects and later, the subject of anticipation of projects which had not yet been started became the main subjects of researches in this context. Previous researches regarding anticipation of the success of projects, are ready to be categorized in terms of different perspectives irrespective of their selected method of anticipation:
Researches who tried to provide a model for predicting a single criterion such as time, expense, etc. For instance, Hwang (2008) used a regression model to forecast expenses. Also in another research, Hwang (2011) tried to anticipate the expenses of projects through Time series.
Researches who tried to provide a model for predicting several criteria through defining a variable dependent on several other independent variables. For instance, Lipke et al. (2009) anticipated the time and expenses of a project through application of EVM (earned value management) technic. Also, Kim and Reinschmidt (2010) provided a model to anticipate project success through the earned value management (EVM) method.
Researches who tried to develop performance and efficiency through considering different concepts as the basis. For instance, Li et al. (2006) tried to anticipate projects’ potentials for violation of time tables and approved budgets through defining a potential function for a project as well as application of Fuzzy logics. In another similar research, the same researchers developed a model for design and construction contracts through application of regression (Lam et al., 2008). In another research, Cheung et al. (2008) tried to anticipate the index of satisfactory settlement of disputes through application of Regression method. In addition, Cheng et al. (2006) developed a model for anticipation of project efficiency through neural networks.
On the other hand, several methods have been used for anticipation as follows,
Time series (Hwang, 2011; Wong et al., 2007)
Various regression methods (Cheung et al., 2010; Hwang, 2008; Wang & Gibson, 2010)
Neural networks (Cheung et al., 2006; Chua et al. 1997; Ko & Cheng, 2007; Wang & Gibson, 2010)
Fuzzy logics (Ko & Cheng, 2007; Li et al., 2006; Young & Poon, 2013)
In previous researches, most researchers and authors have recommended future researchers to provide their anticipator models with respect to things like localization in other countries, application of more precise and simple methods and a model for different phases of a project (Bygballe et al., 2010; Chang et al., 2013; davis, 2013; Eigbe et al., 2014; Han et al., 2007; Han et al. , 2007; Petro & Gardiner, 2015).
2.2 Implementation phases of construction projects
M. Ghazimoradi et al. / Decision Science Letters 5 (2016)
main components of the project. Basically, different phases of a project are completed in an orderly and consecutive manner, however they can be overlapping in some projects too.
Initial phase: this phase is an approval for the entire project. This phase includes whether a project should or should not start, estimates what has to be provided by the project, defines the overall goals of the project, defines customers’ and managers and other engaged parties’ overall expectations, defines the project’s scope, selects the primary members of the project team, etc.
Planning phase: this phase defines and corrects goals and implements the best alternatives for obtaining the goals which are expected from the project. This phase includes determination of required resources, refinement of project area, provides the list of activities, determines the best sequence, provides an efficient plan and budget for allocation of resources, obtains the required approvals, etc.
Execution phase: coordination of people and other resources for execution of the program. This phase includes leadership of the project team, holding meetings with team members, communicating other important parties, trouble shooting, supplication of the entire required resources, etc.
Control phase: ensuring that project’s goals are realized through continuous monitoring and measurements in order to spot violations and to be able to take necessary corrective actions. This phase includes monitoring of performance and reporting violations, making corrective decisions, performance of necessary reprogramming, limited reformations, etc.
Concluding phase: official acceptance of the project and advancing the project to a standard
conclusion. This phase includes documentation of results, reassessing the process of project performance, reviewing experiences, writing the final reports, etc.
2.3 Neural networks
Nowadays, new methods of anticipation have been developed under the title of artificial intelligence (AI). AI is referred to systems which are able to manifest reactions similar to genuine humane reactions including perception of complex situations, simulation of thinking processes and humane reasoning methods, ability of knowledge acquisition and reasoning for problem solving.
Among different AI methods, neural networks is the most applied method for forecasting events. Neural networks are computational models which are able to determine the relationships between a system’s input and output through a network of connected nodes. In these models, the level of activity of each of these connections is set according to chronological information (learning process) and ultimately, the model is able to explore the related laws between input and outputs whether being nonlinear and complex. Basically, a neural network includes the components of layers and different weights. Also the network behavior depends on the relation between participants, while there are three neuron layers in each neural network:
Input layer: raw information are received and fed into the network.
Hidden layers: performance of hidden layers is determined by the input and with respect to the weight of the relation between the input and hidden layers. The weight of the relation between input units and hidden layers determines the timing for a hidden layer to become active.
Output layer: the performance of the output layer depends on the performance of the hidden layer and the weight of the relation between hidden layers and the output layer.
In a neural network, every two layers are connected by weights or in fact, fittings. There are various types of fittings or connections in neural networks.
Forward Neural Networks; Recurrent Networks; Radial Basis Function Networks and Multilayer Perceptron Networks.
3. The proposed model
3.1 Data collection
With the aim of defining and collecting the entire required criteria for assessment of a totally successful project on one hand, and also recognition and collecting the required factors for obtaining complete success from the views of the entire stakeholders of a project on the other hand; exploratory studies were performed in three steps.
At the first step, with the aim of collecting the results of previous researches among different scientific references, library studies were performed and resultantly, a series of criteria and factors of success were collected. At the next step, by carrying out six semi-structured interviews with experts of research domain, and by the help of a number of pre-determined questions, 6 more criteria and 14 more factors were added to the research. At the final step, with the aim of purification of 23 criteria and 47 collected factors, through the application of Delphi method and by incorporating the suggestions of five experts holding a Ph. D. and with sufficient amounts of executive experiences, the number of criteria and factors were respectively reduced to 16 and 33 which were suitable for Iran’s Local situations. For this purpose, a primary questionnaire was developed and respectively, filled by the aforementioned five experts.
For the purpose of obtaining the main research goal, which was to provide an anticipator model, factors and criteria were prioritized according to Iran’s local situation. For this purpose, a questionnaire comprised of two main sections was developed and sent for experts of construction domain. In the first section, the importance of each of 16 criteria were questioned for full assessment of success of a project and in the second section, the importance level of each of the aforementioned 33 factors were questioned in terms of obtaining complete success at the initial phase. On this basis, respondents were asked to give their answers according to a scale of zero (non-important) to four (very important).
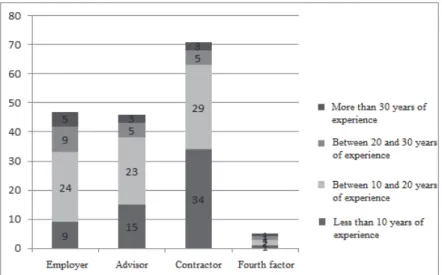
The population of the research included entire project managers and planning experts of construction companies in the city of Tehran, Iran. A number of 260 questionnaires were distributed among the population and among this number, 91 questionnaires were excluded as a result of not being collected back or not containing the required validity. Diagram number one manifests abundance according to executive organs as well as experience level of the population. In addition, the aforementioned 16 criteria and 33 factors are mentioned in tables 1 and 2.
M. Ghazimoradi et al. / Decision Science Letters 5 (2016)
3.2. Removing the outliers
For removal of possible errors, outliers were identified after complete data collection. For this purpose, box diagrams were used as indexes for identification of outliers. These diagrams are used for manifestation of location, distribution and skewness of data. Through determining the first quarter (Q1), third quarter (Q3) and average, the IQR index was calculated for each and every one of the 16 criteria and 33 factors. According to this, each criterion or factor whose value does not fit the range of Eq. (2) is considered as outlier.
IQR= Q3-Q1, (1)
Q1-1.5IQR<values of criteria and factors<Q3+1.5IQR. (2)
On this basis, the data were inserted into the SPSS software and resultantly, outliers were identified. Among the existing 169 questionnaires, 4 or more than four outliers were identified in 34 of the questionnaires and the aforementioned questionnaires were deleted for the purpose of reduction of errors and increasing the strength of the test.
3.3 Data analysis
The Kolmogorov-Smirnoff test was run for determining the normality of data distribution. The resulted significance for entire factors and criteria was less than 0.05 and this manifests the significance of the test or in other words, data are not normally distributed. Therefore, there is not any possibility of using parametric tests. On the other hand, since research variables are qualitative, non-parametric tests were used for analysis of data.
In addition, for the entire 16 criteria and 33 factors, the value of Chi-Square test was calculated with significance of 0.000. Since this significance level is smaller than error value of α=0.05, then we know that there exists a significant difference between ranks of each criteria. Table1 indicates the rankings of criteria according to Friedman tests’ average ranking.
Table 1
Acquired ranks by criteria
Standard deviation Score Percentage Average Freidman test Success Criteria 0.606 582 74.23 3.4438 11.3935 Completing the project within the stipulated time
C1 0.724 572 72.96 3.3846 11.1065 Completing the project with the approved budget
C2 0.709 560 71.43 3.3136 10.8876 Compliance with the quality standards
C3 0.798 552 70.41 3.2663 10.6183 Achieving the specific objectives of the project
C4 0.850 538 68.62 3.1834 10.2663 Maximum achievement of safety indices
C5 0.756 533 67.98 3.1538 9.8964 All stakeholders’ satisfaction and fulfilling their demands
(employer, consultants, contractors, employees, personnel, customers and suppliers, people)
C6 0.764 509 64.92 3.0118 9.0533 Achieving commercial interests / other interests
C7 0.950 487 62.12 2.8817 8.6213 Stability of management strategy
C8 0.998 479 61.10 2.8343 8.4379 Alignment with the environment
C9 0.809 478 60.97 2.8284 8.1953 In line with the goals and organizational strategies
C10 1.059 459 58.55 2.7160 7.9408 Motivation for future projects
C11 0.926 426 54.34 2.5207 6.8107 Increase the level of knowledge in the organization
C12 0.974 410 52.30 2.4260 6.3669 Minimal changes in project scope
C13 0.946 404 51.53 2.3905 6.0680 The least effectiveness of the project from environmental
factors (political, economic, cultural) C14 1.014 375 47.83 2.2189 5.5355 All participants’ consideration of project success
C15 0.878 358 45.66 2.1183 4.8018 Minimal changes in organizational culture due to the project
in the organization C16
In addition, a ranking similar to criteria is performed for required factors for obtaining success during the initial phase. The present ranking is based on the scores obtained from Friedman’s test which is a non-parametric test.
Table 2
Collected success factors
Percentage Average Score Std. dev. Freidman test Factors of success
Factor symbol 88.17 3.53 596 0.691 22.15
Awareness about the project F1 82.84 3.31 560 1.053 21.54
Clarity of specifications of project F2 82.84 3.31 560 0.977 21.46
Financial support reference F3 83.58 3.34 565 0.887 20.67
Familiarity with geographical conditions F4 81.07 3.24 548 0.997 20.65
Forming a suitable team (finding the right people, providing the necessary resources and providing a general perception of the project) F5 84.17 3.37 569 0.904 20.64
Creating specific and rational goals F6 81.95 3.28 554 1.102 20.43
Selecting suitable counselors F7 82.1 3.28 555 0.853 20.26
Emphasis on goals F8 78.55 3.14 531 0.972 19.07
Having a planning process throughout the project’s life cycle F9 78.99 3.16 534 1.048 18.95
Supplication and allocation of financial sources F10 79.59 3.18 538 0.93 18.82
Qualification of knowledge and related experiences in employer firm F11 77.66 3.11 525 1.047 18.72
Familiarity with legal rules and regulations F12 76.63 3.07 518 0.946 18.41
Professional and behavioral skills of managers and engineering teams F13 76.33 3.05 516 0.94 18.31
Having executive experience F14 76.33 3.05 516 0.971 17.56
Coordination with organization’s strategies F15 73.52 2.94 497 1.089 17.38
Teamwork (cooperation, confidence, trust, etc.) F16 67.9 2.72 459 1.461 17.37
Selecting suitable contractors F17 75.44 3.02 510 0.954 17.35
Suitable organizational structure at every step F18 74.56 2.98 504 1.026 16.91
Manager’s view according to views of public sector or private F19 68.05 2.72 460 1.234 16.9
Support by senior managers F20 68.05 2.72 460 1.295 15.96
Rate of inflation F21 69.82 2.79 472 1.052 15.29
Suitable and timely flow of communications and information F22 68.79 2.75 465 1.028 15.25
Continuous, clear and precise communications F23 65.53 2.62 443 1.096 14.48
Having a control system throughout the entire lifecycle of the project F24 64.35 2.57 435 1.257 14.05
Having an experience of execution of new and functional h l i
F25 65.98 2.64 446 1.072 13.94
Providing privileges for senior managers F26 61.98 2.48 419 1.186 13.52
Having suitable instruction structures during the project’s lifecycle F27 57.69 2.31 390 1.46 13.51
Supplying high quality material and suitable machineries F28 62.72 2.51 424 1.216 13.36
Transformation management and preparedness for new
f i i
F29 58.43 2.34 395 1.243 12.37
Suitable reward systems F30 57.1 2.28 386 1.206 12.32
Having an experience of application of quality control services F31 60.06 2.4 406 1.087 11.8
Clarity and speed in providing technical solutions F32 53.55 2.14 362 1.373 11.62
Attraction of labor force F33
Primary analysis of factors indicates the priority of three factors including awareness about the project, clarity of project specifications and financial support reference over other factors in the first or initial phase of the project. On the other hand, factors of attraction of labor force, clarity and speed in providing technical solutions and having an experience of application of quality control services have acquired the lowest of all ranks among other factors. The noteworthy point here is that the performed ranking indicates the priority of criteria and factors according to Iran’s local conditions and situations during the initial phase of projects.
3.4 Model presentation
M. Ghazimoradi et al. / Decision Science Letters 5 (2016)
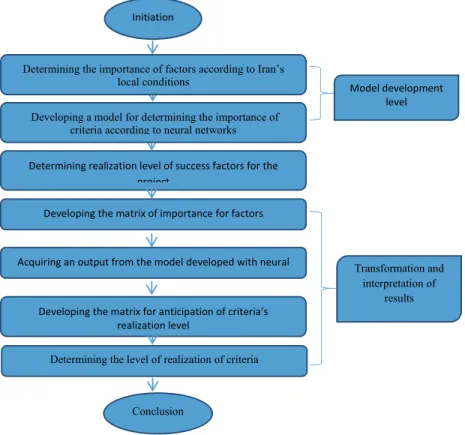
the level of realization of success factors. Fig. 2 indicates the main levels of model in addition to subdivisions of each level.
Fig. 2. Flowchart of levels of the proposed model
3.5. Development of the Model
As it was mentioned earlier, the collected data on one hand determine the importance of each factor for obtaining a hundred percent success during the initial phase of projects and on the other hand, determine the level of importance of each criterion from the perspective of every expert. On this basis, through application of neural networks, we can present a model for determining the relationships of the factors for the success and criteria of success. This model is the sum of views of experts regarding the relation between these elements. By using the neural Network toolbox in the software of MATLAB, a multilayer perceptron network was developed for the aforementioned model. For this purpose, the software was tested fifty times and the most optimized and precise model was selected. The selected model is a network with two hidden layers and respectively 50 and 16 neurons in each layer. The whole 33 inputs of this network indicate the importance of factors and its 16 outputs also indicate the importance of each criterion. The importance level of factors and criterions are reflected on a scale of 1 (non-important) to 5 (very important). Fig. 3 provides a view of the components of model.
Fig. 3. A view of the model developed with neuron networks Initiation
Determining realization level of success factors for the project
Developing the matrix of importance for factors
Acquiring an output from the model developed with neural
Developing the matrix for anticipation of criteria’s realization level
Conclusion
Determining the level of realization of criteria Developing a model for determining the importance of
criteria according to neural networks
Model development level
Transformation and interpretation of
results Determining the importance of factors according to Iran’s
local conditions
50
16
Output
16
Output Input
33
Hidden
w
b
w
b
The number of inputs for the purpose of network testing and training was equal to the number of effective questionnaires as 134 series. Of this value, 70% is used for training, 10% is used for testing and 10% is used for validation of the model. Also the Bayesian Regularization algorithm was employed for development of this model.
Once the network was developed, the error level was calculated through Eq. (3).
Errors= targets-outputs (3)
Highest error distribution is between the values of -0.11 and 0.2. The error distribution diagram for the developed network is shown in figure 4.
Fig. 4. Error distribution diagram
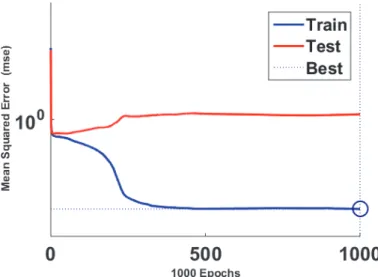
In addition, the model’s performance index is equal to 0.0180. This value was obtained in cycle 988 among 1000 training cycles. Fig. 5 indicates the changes of performance index during the network’s training period.
Fig. 5. The changes of performance index during the network’s training period
M. Ghazimoradi et al. / Decision Science Letters 5 (2016)
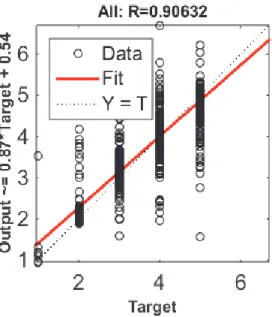
Fig. 6. network’s regression diagram
The values of aforementioned indexes indicate the suitability and desirability of the precision of the proposed model. This means that this network is ready to be employed as a model for determining the importance of success factors according to the importance of success factors.
3.6. Transformation and interpretation of results
Since the purpose of this paper was to anticipate the level of realization of success criteria according to the level of realization of success factors, the next step is concerned with providing a method for implementation of the proposed model for obtaining this goal.
For realization of the aforementioned goal, this level includes four steps. The first step is concerned with reviewing and analyzing the existing conditions. For this purpose, 33 factors required for obtaining success should be analyzed and the level of realization of each of these factors should be determined according to Table 3.
Table 3
Guide to determination of factors’ realization level
No. Level of realization Score
1 Not realized at all 0
2 Almost not realized 0 – 0.25
3 Semi-realized 0.25 – 0.5
4 Almost completely realized 0.5 – 0.75
5 Completely realized 0.75 - 1
The next step is concerned with putting the level of realization of each factor into effect. Eq. (4) indicates the effect of level of realization of each factor on their consequent importance.
⋱ … . ⋱
(4)
The third step is concerned with employing the matrix on the extracted model as the input. The model’s output in this step is a 16×134 matrix.
The final step of this level is to recover the outputs of the model to the forecasting value of criteria fulfilling. For this purpose, at the first it is required to divide each entry of the output matrix of neural networks by its corresponding entry on the matrix of importance of criteria. Eq. (5) indicates the manner of calculation of level of realization of criteria.
⋱ ⋱ / ⋱
(5)
In this relation, the p matrix is the matrix of anticipation of criteria’s realization, the c matrix is the network’s output matrix and the C matrix is the matrix of importance of criteria.
At the end, prediction values of each success criteria are evaluated. For this, average elements of each line of p matrix that is obtained from relation 6, is as results of proposed model that is presented in this research.
∑
1
,
(6)
where Piis the element of ith line that is forecasted and Pj; which is the jth criteria that is evaluated.
As is described before, P is the amount for each criterion, which shows how many of them are realized. A 0 value for P means no absolute amount and one for P means complete amount. So, when the amount of P for a criterion is equal to zero, forecasted result is weakness for the realization of that criterion.
Based on sensitivity analysis, on one hand, the first three criteria (C1, C2, and C3) cover 34% of the
variance of project success, but in the other hand, first five factors (F1 until F5) cover 47% of the
variance of essential factors to success, that these reflect the importance of these three criteria and five factors in projects.
Interpretation of P amount on the one hand, and satisfaction level for each criteria on the other hand are related to kind of users and Stakeholders of model. Accordingly, different Stakeholders with various strategies and with different kinds of priorities for all criteria can reach different results.
With P values that are calculated and importance of each criteria, judging of project success can be predicted. This subject can be as suggestion for future research,
3.7. Model validation
Model validation was conducted to ensure that the constructed model in this research is generalizable to the population and not specific to the sample used in training.
First, R, R2 and Mean Square Error (MSE) for the network are calculated, While 10% of the initial data were used to assess neural network of model. Results are shows in Table 4. These results confirm high reliability of model.
Table 4
Performance Evaluation of model’s neural network
MSE 2
R R
0.0412 0.996
0.910 Neural Network of Model
M. Ghazimoradi et al. / Decision Science Letters 5 (2016)
3.8 Practical application
This research proposed, developed and diagnosed the model that firms and stockholders can use to predict how successful their projects in Iran are likely to be based on different PM practices adopted. The project management practices revealed in the model could serve as a guide for them to adopt when operating in Iran’s construction industry. The model is also useful to foreign firms that are assessing if they would like to take part or manage a project in Iran, because the likely outcome may be forecasted before they embark on the project.
4. Conclusions
In this research, a model based on neural networks was developed for anticipation of the success of construction projects depending on the level of realization of success factors during the initial phase of a project. The following could be pointed out as advantages of this model:
1- The basis of judgment for the proposed model is the inputs of the model, or in other words the level of realization of success factors during the initial phase of a project. This realization is based on abilities and potentials. On this basis this model can illustrate different situations in the future which may result in declination or approval of the project
2- The output of the anticipator model is the estimated value of each of 16 criteria. On this basis, different stakeholders can have their final judgment of success of the project with respect to realization level of prioritized criteria. This advantage is important since existence of difference in organizational strategies of various stakeholders of a single project lead to emergence of different views regarding prioritization of success criteria.
3- Application of neural networks in the proposed model has led to emergence of certain advantages and abilities such as high precision, ease of use and the ability of deduction for the model.
4- Ranking of aforementioned factors and criteria are according to Iran’s local conditions. Therefore, ease of imposing changes on the model for implementing it in other regions is another advantage of the proposed model.
References
Atkinson, R. (1999). Project management: cost, time and quality, two best guesses and a phenomenon, its time to accept other success criteria.International journal of project management, 17(6), 337-342.
Bygballe, L. E., Jahre, M., & Swärd, A. (2010). Partnering relationships in construction: A literature review. Journal of purchasing and supply management, 16(4), 239-253.
Chang, A., Chih, Y. Y., Chew, E., & Pisarski, A. (2013). Reconceptualising mega project success in Australian Defence: Recognising the importance of value co-creation. International Journal of Project Management, 31(8), 1139-1153.
Cheung, S. O., Wong, P. S. P., Fung, A. S., & Coffey, W. V. (2006). Predicting project performance through neural networks. International Journal of Project Management, 24(3), 207-215.
Cheung, S. O., Yiu, T. W., & Chan, H. W. (2009). Exploring the potential for predicting project dispute resolution satisfaction using logistic regression.Journal of Construction Engineering and Management, 136(5), 508-517.
Chua, D. K. H., Loh, P. K., Kog, Y. C., & Jaselskis, E. J. (1997). Neural networks for construction project success. Expert Systems with Applications,13(4), 317-328.
Davis, K. (2014). Different stakeholder groups and their perceptions of project success. International Journal of Project Management, 32(2), 189-201.
Eigbe, A. P., Sauser, B. J., & Felder, W. (2015). Systemic analysis of the critical dimensions of project management that impact test and evaluation program outcomes. International Journal of Project Management, 33(4), 747-759.
Han, S. H., Kim, D. Y., & Kim, H. (2007). Predicting profit performance for selecting candidate international construction projects. Journal of Construction Engineering and Management, 133(6), 425-436.
Hwang, S. (2009). Dynamic regression models for prediction of construction costs. Journal of Construction Engineering and Management, 135(5), 360-367.
Hwang, S. (2011). Time series models for forecasting construction costs using time series indexes. Journal of Construction Engineering and Management,137(9), 656-662.
Kim, B. C., & Reinschmidt, K. F. (2010). Probabilistic forecasting of project duration using Kalman filter and the earned value method. Journal of Construction Engineering and Management, 136(8), 834-843.
Ko, C. H., & Cheng, M. Y. (2007). Dynamic prediction of project success using artificial intelligence. Journal of construction engineering and management,133(4), 316-324.
Lam, E. W., Chan, A. P., & Chan, D. W. (2008). Determinants of successful design-build projects. Journal of Construction Engineering and management,134(5), 333-341.
Ika, L. A. (2009). Project success as a topic in project management journals.Project Management Journal, 40(4), 6-19.
Li, J., Moselhi, O., & Alkass, S. (2006). Forecasting project status by using fuzzy logic. Journal of construction engineering and management, 132(11), 1193-1202.
Lipke, W., Zwikael, O., Henderson, K., & Anbari, F. (2009). Prediction of project outcome: The application of statistical methods to earned value management and earned schedule performance indexes. International journal of project management, 27(4), 400-407.
Petro, Y., & Gardiner, P. (2015). An investigation of the influence of organizational design on project portfolio success, effectiveness and business efficiency for project-based organizations. International Journal of Project Management, 33(8), 1717-1729.
Wang, Y. R., & Gibson, G. E. (2010). A study of preproject planning and project success using ANNs and regression models. Automation in Construction, 19(3), 341-346.
De Wit, A. (1988). Measurement of project success. International journal of project management, 6(3), 164-170.
Wong, P. S., On Cheung, S., & Hardcastle, C. (2007). Embodying learning effect in performance prediction. Journal of construction engineering and management, 133(6), 474-482.