MIRADOR II – A MANAGEMENT TOOL FOR WORKSTATION
CLUSTERS
Maxweel Silva Carmo Augusto José Venâncio Neto
[email protected] [email protected]
Departamento de Computação, Fundação de Ensino Superior de Rio Verde – FESURV Fazenda Fontes do Saber, Campus Universitário, CEP: 75901-970 - Rio Verde-GO
ABSTRACT
The application of workstation clusters as a parallel machine has been of widespread use. Although highly cost-effective, the ease of use of such systems can be improved with the utilization of monitoring and management tools. The Mirador II was developed to make easy the user interaction with the spp3, a parallel architecture that provides high computational power at low cost using commonly available hardware components. User account management, cluster resources monitoring, management and monitoring of running processes, Myrinet network monitoring and parallel machine autonomous management are among its main features. The Mirador II can be also employed as a monitoring and management tool for workstation clusters.
Key-words: Parallel computing, high speed network monito
1 INTRODUCTION
The use of computers for problem solving was based, during a long time, in strictly sequential solutions imposed by the Von Neumann architecture. In spite of the exponential growth of performance of Von Neumann computers in the last years, physical limitations have imposed restrictions on the maximum processing speed that can be obtained.
It is known that the need of processing power has being increasing systematically. The solution to some problems demand high computacional power that cannot be supplied by a sequential machine. New computational models have been proposed to solve this class of problems. MIMD parallel architectures with distributed memory have considerable importance for offering, among other benefits, high performance at low cost.
Frequently, it is necessary to analyze the dynamic behavior of a running parallel application or even interact directly with it. This is not a trivial task without the appropriate tool. Several factors, such as the multiplicity of resources and the concurrent execution of the programs, contribute to make this task not easy. The tools for the management and monitoring of parallel machines make available for the user different information regarding the state of the parallel system and the state of the running applications. These tools allow for, as a management task, the user's direct intervention in the system.
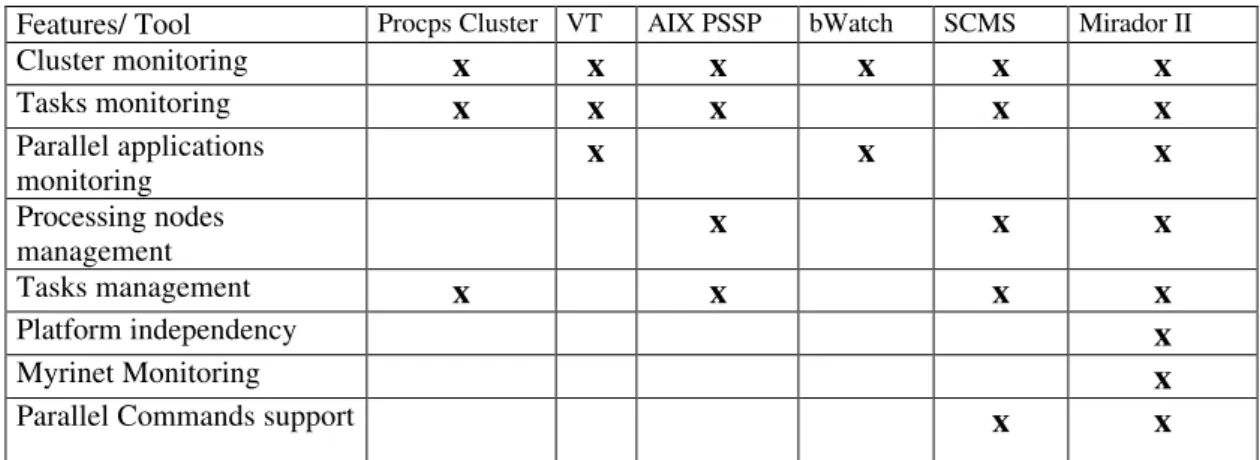
The Mirador II tool was initially developed for the SPP3 parallel machine, (ARAÚJO 1998) (TRINDADE, et al, 1995). The Mirador II stands out as an almost complete tool for the management/monitoring of parallel architectures, having all the features to accomplish the necessary tasks. Its development was carried out to fill functional gaps present in other tools of its class. The table I presents a comparison among available tools. This table presents features that are important for the monitoring/management of parallel systems.
The Procps Cluster is an extension of the Top tool. Procps does not have a graphical interface and it accomplishes only tasks and CPU/memory monitoring. The VT allows the monitoring of several devices of the parallel machine, such as the hard disk and the communication network. The VT was developed for use on the IBM RS/6000 (SETHU, et al, 1998) and does not allow management operations. The AIX PSSP was also developed for the IBM RS/600. It provides several management and monitoring operations. The SCMS was developed for Beowulf machines (STERLING, et al, 1995) (SALMON , 1998). It allows task management and CPU/memory monitoring, among other features.
Features/ Tool Procps Cluster VT AIX PSSP bWatch SCMS Mirador II
Cluster monitoring x x x x x x
Tasks monitoring x x x x x
Parallel applications
monitoring x x x
Processing nodes
management x x x
Tasks management x x x x
Platform independency x
Myrinet Monitoring x
Parallel Commands support
x x
According to the Table 1, the Mirador II includes the main features of other tools. Furthermore, new features were proposed and implemented.
2. THE SPP3 PARALLEL MACHINE
The SPP3 is the result of a six-year research activity on high performance computing at the LCAD (High- Performance Computing Laboratory), University of São Paulo.
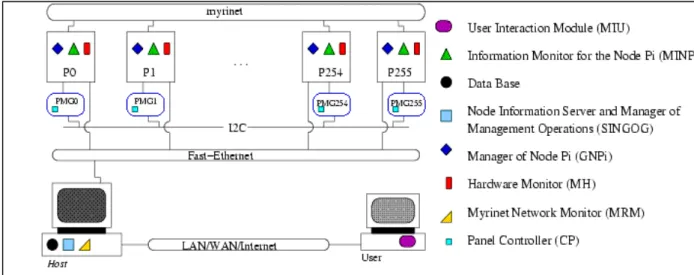
The SPP3 parallel machine is a MIMD architecture with distributed memory. One of its main goals is the use of low cost hardware, following a tendency in the development of distributed memory MIMD machines (STALLINGS , 1999). The SPP3 can be scaled up to 256 processors nodes. Figure 1 shows a block diagram of the SPP3.
Figure 1: SPP3 block diagram
and hardware control functions. This network is implemented using a PIC microcontroller and provides bar graph view of the memory and CPU usage for the processing nodes. Some specific tasks, such as the removal from operation of the nodes presenting abnormal behavior, are also available.
3 THE MIRADOR II TOOL
The development of the Mirador II was carried out to provide management and monitoring facilities to the SPP3. It is possible, with minor configuration, to use the Mirador II as a management/monitoring tool for a network of workstations acting as parallel machine. The development of the Mirador II was strongly based on the concept of remote use though the Internet. This tool allows the user to have the general control of the machine, making possible:
• To obtain information from the processing nodes such as CPU load, main memory and swap memory (size, utilization), current running tasks, processor specification, and time.
• To abort processes running in the nodes.
• To obtain information about the user's tasks to keep track of the execution of parallel applications.
• To manage the user' accounts in a simple and efficient way. • To monitor the Myrinet communication network.
• To perform management tasks autonomously. The Mirador II can effect some management operations by itself, without user interference.
• To perform monitoring and management tasks remotely through the Internet using a standard Web Browser.
• To monitor the hardware devices of the system namely, motherboard temperature, fan speed (CPU and power supply) and power supply voltage levels.
Figure 2: The Mirador II tool architecture
3.1 THE MIRADOR II TOOL ARCHITECTURE
The Mirador II tool is based on a client/server model. Client and server modules run on different parts of the parallel machine: processing nodes, user's desktop, the host machine and the PMG (Management and Monitoring Panel) board. The architecture of the Mirador II tool is presented in the Figure 2.
The Mirador II tool consists of the following modules:
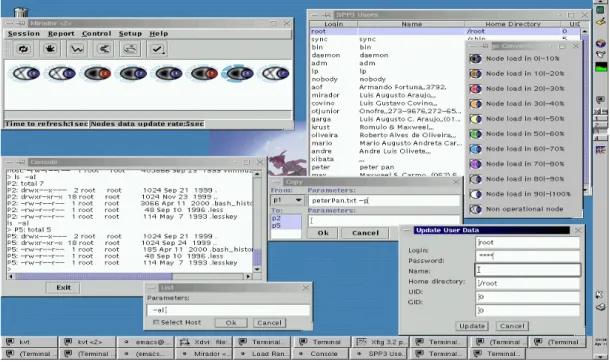
3.1.1 MIU - USER INTERACTION MODULE
This module is in charge of the interaction between the user and the SPP3, being executed locally (in the user's desktop). A graphics interface presents the information under monitoring in
Figure 3: The Mirador II tool graphics interface
The Mirador II main window is quite uncluttered and is presented in the Figure 4. Each icon represents a processing node of the parallel machine.
According to the Figure 4, eight nodes are under monitoring. The colors of the ellipses change to show CPU loads, allowing for an easy identification of the computational activity on each node. The black color, for instance, represents the absence of computational activity, while the white color represents a high activity level. The ellipses labeled with an ``X'' indicate inoperative nodes. The colors of the small circles on the right side of each ellipse indicate whether the node is selected for management or not. The nodes selected for management allow user interaction. For instance, to turn off a group of nodes, each node must be selected for management before the Turn Node Off command be issued. The semicircles around the ellipses stand for memory utilization.
The selection of the node(s) under monitoring can be made using parameters (or filters): • Selecting a certain number of nodes. A range of nodes can be selected for monitoring.
For example, the nodes numbered from 0 to 3 (0-3). Also, specific nodes can be selected. For example, the nodes 0, 2, 5 and 8 (0,2,5,8).
• Selecting nodes by specific tasks. The nodes that are executing a certain task(s) are selected. For example, can be selected the nodes that are executing the Netscape Navigator.
• Selecting nodes by specific user. Only the nodes that are executing at least one task owned by a specific user are selected for monitoring.
• Selecting nodes by specific user and specific task. In this case, only the nodes that are executing a specific task owned by a specific user are selected for monitoring.
• Selecting nodes under computational activity. In this case, nodes out of order or turned off are not monitored.
3.1.2 SINGOG - NODE INFORMATION SERVER AND MANAGER OF MANAGEMENT OPERATIONS
The SINGOG module, running in the host, manages all the communication between the user and the processing nodes. It gathers and stores all the management information of each node. Periodically, all the modules that run in the nodes contact the SINGOG module and send monitoring information (CPU load, memory utilization, date, tasks in execution, etc.). This information is filtered by the SINGOG module and sent on request to the user. This implementation optimizes the use of the communication network, avoiding excessive traffic of data.
The SINGOG module also triggers management operations, such as Kill Tasks. It gets the management requisition, contacts the node(s) where the management operation will be executed, waits for a response of the node(s) and returns the response (success or error) to the user. The SINGOG module also has specific functions:
• Parallel Command Execution: to facilitate the interaction between the user and the nodes, basic Unix commands (ls, mv, find, cp) can be executed in parallel.
3.1.3 GNPI- MANAGER OF NODE PI
The functions of this module are related to the node tasks management. For each of the nodes in activity there is a GNPi module in execution. To restart a node, the GNPi server at the node must be contacted to execute this command. Besides the restart command, the GNPi module allows the synchronization of the date and time with the host date and time. It is also possible to halt the node and to change the priority of execution of the tasks.
The GNPi interacts directly with the PMG board to turn off, turn on and to restart the nodes through hardware signals.
3.1.4 MINPI- INFORMATION MONITOR FOR THE NODE PI
This module gathers and process information about main and swap memory usage, tasks under execution and CPU load. At the time ticks specified by the user, such information is sent to the host (SINGOG). The MINPi, like the GNPi, runs in each processing node.
3.1.5 MRM - MYRINET NETWORK MONITOR
This module monitors the Myrinet high-speed network. The SNMP agent of the Myrinet switch maintains the monitoring data. The data is obtained through a Ethernet connection. At the power up, the host supplies an IP address (DHCP) to the switch.
3.1.6 MH - HARDWARE MONITOR
The MH module was implemented using the LMSensor package (NATIONAL , 2001). Such application interacts directly with the sensing hardware of the ATX motherboards performing temperature measurement (motherboard), voltage measurement (power supply and CPU core) and fan speed.
The MH deals with the management of hardware malfunctions. It checks the measured data against user-established minimum and maximum values. If these values are out of the established limits, a message is sent to the administrator by e-mail, informing which device/value is out of range. The user can configure the system to turn off the malfunctioning node if no action is done to correct the offending data (data type specified) after a specified amount of time. This is a protective procedure to avoid permanent hardware failure to the system.
3.1.7 CP - PANEL CONTROLLER
This module runs on the PMG and comprehends the low level functions that coordinate all of its activities, accomplishing monitoring and management tasks.
3.1.8 PMG - MANAGEMENT AND MONITORING PANEL
The PMG board was designed to accomplish two basic functions:
• Monitor CPU load and memory utilization. • Turn off or restart nodes.
The board is also connected to the reset and to the on/off control inputs in the processing nodes. The CPU load and memory usage values are sent by the processing nodes to the PMG thought the serial port. The bar graph display present these values.
3.2 EXPANSIBILITY
One of the main features of the Mirador II is its expansibility, presenting mechanisms for the inclusion of new functionalities in agreement with the user's specific needs. Such feature is supported by the design of the Mirador II communication interface, making available a well-defined and consistent API for easy utilization.
3.3 RESOURCE UTILIZATION
The Mirador II was designed to be as non-intrusive as possible to the monitored processing nodes. It has very low needs of computational power and memory.
3.4 FLEXIBILITY
The Mirador II tool was developed for the SPP3 parallel machine. It can be also used, with minor configuration and some loss of functionality, in a network of up to 256 Linux workstations. (Beowulf-like machines).
The Myrinet module can be excluded at compile time when the Myrinet network is not available. The user can also excludes other modules at compile time, as a sort of customization mechanism, to make the Mirador II appropriate for his/her needs.
4 CONCLUSION
The Mirador II was designed mainly to be used in the SPP3, although it can be employed in similar machines. The Mirador II is quite a complete system, providing tools ranging from users' account management to hardware monitoring. Internet access is an important characteristic, allowing for remote monitoring/management of the parallel machine.
The use of the Mirador II in the SPP3 at the LCAD has demonstrated its usability, effectiveness and flexibility.
Further work were proposed to extend the functionality of the Mirador II including the private use of reserved processing nodes by the users, batch processing of user's jobs and the development of a specific version to better comply with the requirements for the management and monitoring of workstation clusters.
5 BIBLIOGRAPHY
ARAÚJO, L. Mirador - Uma ferramenta para monitoramento e gerenciamento do SPP2.
Master's thesis, São Carlos: University of S. Paulo, 1998.
BODEN, N. et al. Myrinet: a gigabit-per-second local-area network. IEEE Micro, Los Alamitos,
v.15, n.1, p.29-36, Feb. 1995.
FUJISAKI, S. Avaliação de tecnologia e rede de alto desempenho para utilização no SPP2.
Master's thesis, São Carlos: University of S. Paulo, 1999.
HIPPER, G. Advanced workstation cluster architectures for parallel computing. Journal of Systems Architecture, Amsterdam, v.44, n.3/4, p.207-226, Dec. 1997.
IEE INSTITUTE OF ELECTRICAL AND ELECTRONIC ENGINEERS. Local and metropolitan area networks-supplement--media access control (MAC) parameters, physical layer, medium
attachment units and repeater for 100Mb/s operation, type 100BASE-T (clauses 21-30), IEEE 802.3u-1995. New York, NY, 1995.
NATIONAL LM78 Microprocessor System Hardware Monitor. http://www.national.com/pf/ LM/LM78.html, 2001.
SETHU, H.; STUNKEL, C.; STUCKE, R. IBM RS/6000 SP Interconnection Network Topologies for Large Systems. In: Proceedings of the 1998 International Conference on Parallel Processing
(ICPP '98), pp. 620-628, IEEE USA, Aug. 1998.
STALLINGS, W. Computer Organization and Architecture: Designing for Performance.
Prentice Hall, fifth edition, 1999.
STERLING, T.; SAVARESE, D.; BECKER, D.; DORBAND, J.; PACKER, V. BEOWULF: A Parallel Workstation for Scientific Computation. In: Proceedings of the 24th International Conference on Parallel Processing, p. I:11-14, Aug. 1995.
TRINDADE, O.; MARQUES, E.; JEUKENS, I. A parallel Architecture based on personal computers – requirements and definitions - an overview. In: XV INTERNATIONAL CONFERENCE OF THE CHILEAN COMPUTER SOCIETY, p. 479-490, Nov. 1995.