Detecting phase transitions in community structures using big data
analysis of the engineering education research landscape: a
European perspective
K Madhavan1
Associate Professor Purdue University West Lafayette, USA E-mail: [email protected]
B. Williams
Senior Lecturer
Instituto Politécnico de Setúbal and CEG-IST, Universidade de Lisboa Portugal
E-mail: [email protected]
Conference Key Areas: Engineering Education Research
Keywords: Evolution of engineering education research; big data; European perspective; scientometrics; graph theory
INTRODUCTION AND PROBLEM STATEMENT
A fundamental problem facing the field of engineering education is to understand how educational research and pedagogical innovations may propagate. It is an even greater challenge to understand if any of the educational results transform into innovations – thus leading to better products and services. Recent studies have demonstrated that an effective approach to understanding the origin and flow of research innovations through complex systems is by the use of bibliometric and scientometric analyses – both of which can involve using tremendous volumes of data. Such a big data study has not been undertaken from a European perspective up to now nor has there been a clear definition of the topographic characteristics of the corresponding European and more
1
global collaboration networks. Secondly, there has been no attempt to use a sequence of time segmentations to understand if there has been a notable phase transition in the European literature. As a first step to applying big data analysis to the European engineering education research landscape, our paper examines the topographic characteristics of the collaboration network found in the literature generated within the European space.
One of the most powerful mathematical tools available to engineers to study the propagation of knowledge and potentially disruptive artefacts is through the use of graphs. The network of engineering education researchers in our study is composed of researchers (represented as nodes on a graph) and the products they co-produce (represented as edges). Additionally, we represent key concepts as nodes and show how they connect to other ideas using edges. The central idea behind the use of topics as nodes is to highlight the importance of key topical areas that emerge in the body of literature. Papers represented as links just highlight connections among topics. In totality all researchers and their scientific products (papers, conference proceedings, citations, and secondary citations) are a large network exhibiting a certain level of randomness. According to Achlioptas [1], “Networks in which the formation of connections is governed by a random process often undergo a percolation transition, wherein around a critical point, the addition of a small number of connections causes a sizeable fraction of the network to suddenly become linked together” (p. 1453). This phenomenon is known as “explosive percolation” [2] of random networks. An example of such an explosive percolating event was seen in the papers published by the Journal of Engineering Education from a big-data analysis carried out by Xian and Madhavan [3]. These investigators suggested that the formation of the first 2 departments of engineering education in the US or the colloquies which eventually yielded the research agenda for engineering education in 2006 may have triggered this process.
While the general methods for conducting such studies have been well established in the engineering education literature, the goal of understanding major phase transitions begins with characterizing the topography of the knowledge space itself. In this study, using an aggregated sample of 3,331 papers published in two European-published journals, the International Journal of Engineering Education (IJEE) and the European Journal of Engineering Education (EJEE), from years 1993 to 2015 we attempt to develop some basic understanding of the topology of the engineering education literature from a European perspective. The mechanisms we use in this study are significantly different from previous studies because we rely heavily on cloud-based services that allow a larger community of engineering education to gain access to methods demonstrated in this paper. Using a variety of mathematical techniques, the goal of this research, in the long term, is to identify potentially disruptive ideas that could fundamentally transform the scientific space.
1 REVIEW OF RELEVANT LITERATURE
research [5] to point out that while engineering education has been seen as an area of interest for educators since the end of the 19th century, over the last two decades there have been significant indicators of a transition to an interdisciplinary, more scholarly field of scientific inquiry into engineering education. Borrego and Bernhard [6] have compared Northern and Central European approaches to EER with those of the U.S. using a framework from the European didaktik tradition, which focuses on answering the w-questions of education. Borrego and Olds [7] employed an analysis of National Science Foundation funded projects as a way of characterizing development in EER in the US while van Hattum-Janssen et al. [8] followed the Froyd & Lohman [4] approach and used the Fensham criteria to track the emergence of EER in Portugal.
The approaches described in the preceding paragraph could be broadly classified as scientometric in that they measure and analyse the development of a scientific field of inquiry. In parallel with these approaches there have been a number of studies which apply forms of bibliometric analysis, a study of scientific publications, as a way of tracking the evolution of EER in different parts of the world. Wankat [9][10] analysed 10 years of JEE papers (1993-2002, 597 papers) and reported that “although a reasonable number of papers cite an educational theory or learning style, such as Kolb or the Myers-Briggs Type Indicator (MBTI), less than 20 percent of the papers actually used a theory to design or analyse the curriculum, learning or teaching.” Osorio and Osorio [11] performed content analysis on publications in JEE and EJEE over the years 1998 to 2000 and observed that the first authors of JEE articles are mostly from the USA whereas authors of EJEE articles are primarily from several European countries. An analysis of empirical research in leading EER journals up to 2008 by Jesiek et al. [12] showed that the majority of published authors in the analysed articles came from the US (36%) with the EU and Australia providing 29% and 23% respectively and the level of international co-authorship was relatively low at 8%. Although we might assume that in the intervening years this trend might have diminished due to increased globalization, we note that a recently published list of the most collaborative co-authors in EER [13] contains only US scholars.
It is important to note that all of the bibliometric studies described in the previous paragraphs were human curated which being quite manpower-intensive does limit the sample size that is normally studied. However, the dramatic increases in computer processing power in recent years have permitted the development of increasingly sophisticated big-data analysis procedures which have led to the emergence of machine-curated bibliometric analysis that by its nature has the potential to allow investigators to view a rather broader picture given that very large data-sets can be analysed.
The Froyd-Lohman [4] study mentioned earlier, for example, includes network diagrams produced by machine-curated analysis of extremely large data sets prepared by Madhavan et al. [19] [20]. The original studies [19] [20] describe the application of data mining techniques to study 35,591 documents from 21 different publications including Journal of Engineering Education, International Journal of Engineering Education, Frontiers in Education, ASEE conference proceedings, and IEEE Transactions on Education. This allowed the researchers to build up sophisticated researcher network profiles and characterize the interactions between scholars and groups of scholars. In a more recent example, analysis of 24,172 papers in engineering education research journals and conference proceedings over the period 2000-2011. Xian and Madhavan [3], for example, found that in-state collaboration within the US is significantly more frequent than between-state collaboration which suggests that geographical location can strongly influence how scholars form collaborations.
Big data analysis brings a further potential benefit in that not only can we identify general evolutionary trends in a field of inquiry but it can also allow us to see how educational research and pedagogical innovation propagate within and between communities of educational scholars and practitioners. Thus it can provide a means of addressing one of the fundamental problems facing the field of engineering education: understanding innovation propagation. In other words, if we are able to monitor how educational results transform into innovation, this can in turn lead to better products and services. Advances in computing power now provide us with the wherewithal to understand the origin and flow of research innovations through complex systems by applying bibliometric and scientometric analyses to very large volumes of data.
Apart from the complex data-processing procedures required for such studies there are two other challenges which arise. Firstly, given the comparative newness of the techniques and the large volumes of data to be analysed it can be difficult to initially identify emerging patterns. Secondly, once such patterns have been identified there is the question of choosing the medium in which they are best presented. It can be problematic to represent complex changing data patterns within the constraints of traditional papers such as this one and this is why some researchers have opted to complement their publications with video presentations as this medium permits more dynamic visual presentation of data. See for example the video representation that describes changes in the IEEE Frontiers in Education conference publications produced by the Interactive Knowledge Networks for Engineering Education Research [21].
2 KEY TERMS USED IN THE STUDY
Before we present the methods and analyses for this paper, we discuss a few key social network analyses terms used in this paper. The measures we use in this paper are associated with graph theory. They are known as centrality measures and allow us to answer questions about the importance and value of each node and edge (line that connects two nodes) in a network graph [22] [23]. More importantly, they provide us a means to describe the topography of the resulting graphs. The fundamental mathematical derivations and formulae are not discussed and are outside the scope of this paper. Please note that the descriptions provided below are deemed sufficient for the purposes of this paper (not necessarily exhaustive or complete).
Nodes: Authors and co-authors are represented as nodes in the first set of network graphs presented in the paper (Figs 2 – 5) while keyphrases are presented as nodes in subsequent ones (Figs 6 and 7).
Edges: The relationship between two nodes is shown as an edge i.e. a line connecting nodes. All of our graphs are directed but are unweighted (meaning thickness of the edges are not computed based on any set of factors).
Graph Density: Measures the completeness of the graph. If all authors (or co-authors) are connected with no connection gaps, then the graph density is 1. In terms of propagation of information, graphs with high density are presumed to have more pathways for information flow to occur.
Largest Connected Components/Clusters: Largest number of nodes connected together by at least one edge. This is an important topological property of graphs. Essentially, connected components show how certain groups could pick up specific types of innovations (due to an existent pathway or edge), whereas other groups (or disconnected components) may not know about these innovations.
Average Path Length: The average of all the path lengths needed to connect any two authors/concepts in a graph. When two authors are directly connected, the path length between them is 1. As the average path length of a graph increases, this essentially means that information has to flow more steps to travel from one person to any other random person (if a pathway exists).
Average Closeness: The average of all the shortest distances between one author and all other authors in the network is called closeness. In other words, this value characterizes the average of the so-called reach or potential to influence of one person in the network.
Average Betweenness: The average betweenness value indicates how many times on an average a single author/concept acts as a bridge or is on the shortest pathway between two authors or concepts.
Average Eigencentrality: The average index of how influential a single author/keyphrase is within the entire network. As this index increases, it is indicative that individual researchers have more power within the network to propagate their ideas as they have higher average influence. Connecting to an author or researcher with high eigencentrality would be another way for propagating newer ideas.
Average Eccentricity: The average longest geodesic distance between any two authors in the network is given the eccentricity centrality. As this value increases significantly, it is indicative that information has to travel a larger number of steps in order to reach the farthest author.
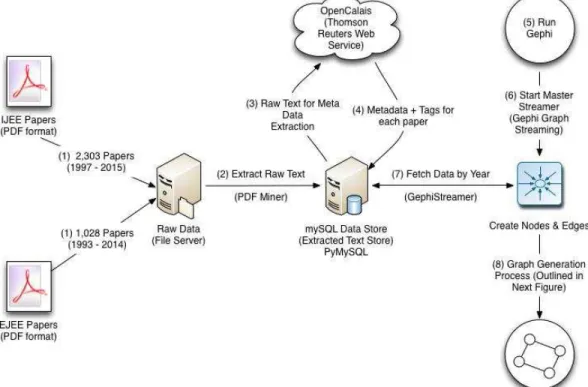
Figure 1 Overall big data work-flow showing data analyses and graph generation processes used in this study.
3 METHODOLOGY
Figure 1 shows the overall methodology and work-flow used in this study. Our approach is significantly different from previous big data studies of network topologies in engineering education research because of our reliance on cloud-based services for much of our data processing needs. The methodological innovation here is the creation of a work-flow that is accessible to non-experts in data mining.
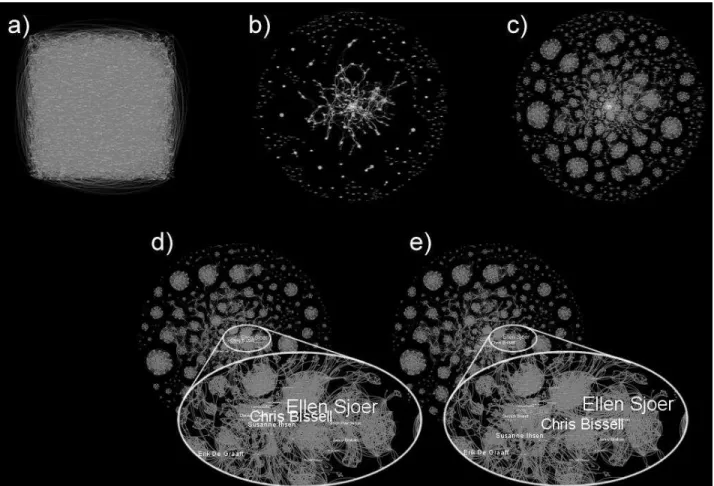
Step a in figure 2 shows the graph initially being output in some random layout that lacks any form or understandability. In step 8.b we apply a force-directed layout (ForceAtlas2) as outlined in Jacomy et al. [24]. Step 8.c applies the Lin-Log forces (ForceAtlas2) that was elaborated by Noack [25]. While step 8.d adjusts the node sizes to be proportional to the computed degree centrality, the final step 8.e is used simply for adjusting the labels to their appropriate positions. Please note that the point of figure 2 is not to be readable, but rather to show decreasing clutter and increasing clarity of the resultant graphs.
4 RESULTS & DISCUSSION
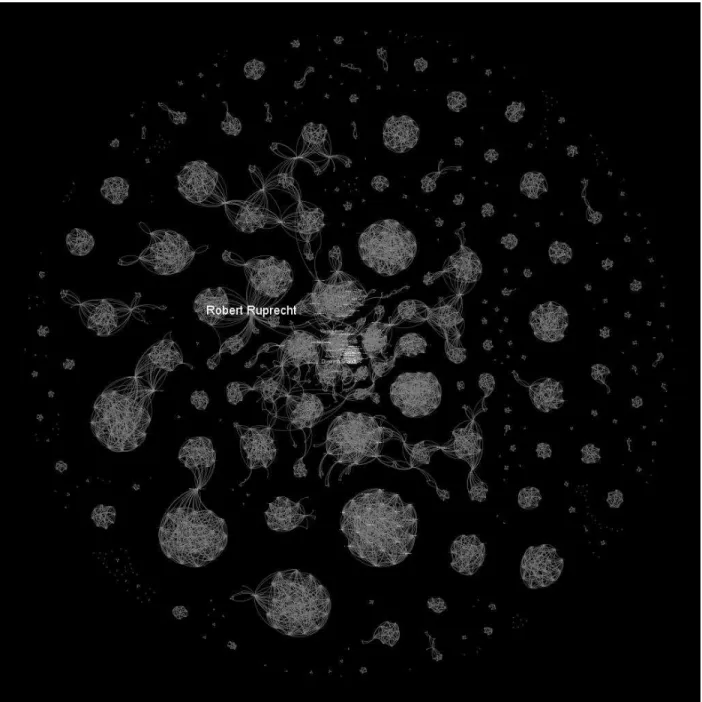
Fig 3. State of the engineering education research network from a European
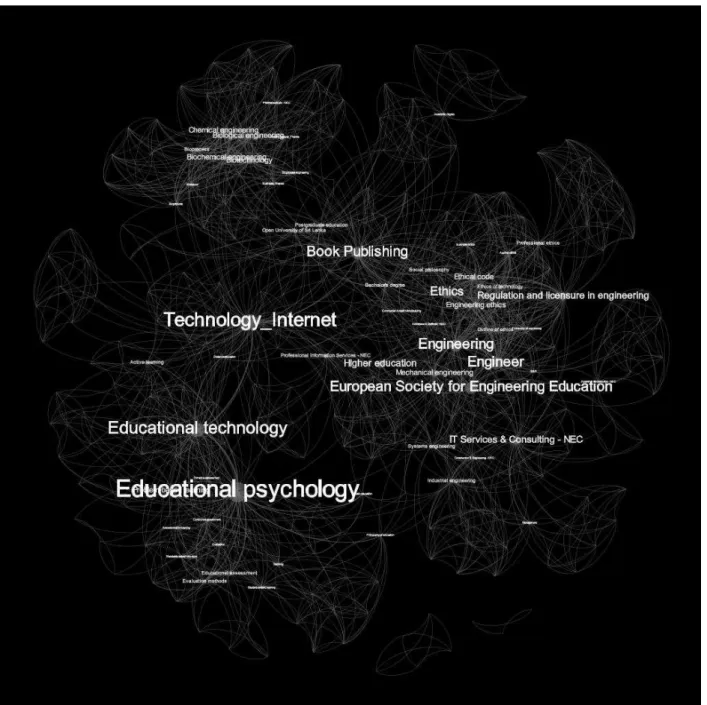
Fig 4. The intermediary year 2000 shown here is significantly different with regard to connections between nodes as compared with the first year few of our analyses as evidenced in table 1.
Please note graphs are shown purely for topological descriptions. They are not designed for reading each node label or graph entity.
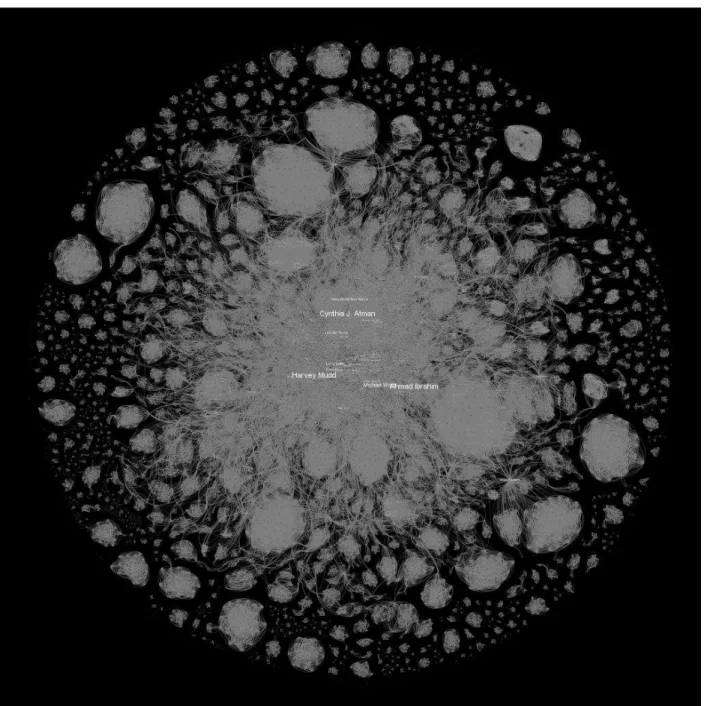
figure 4 shows an intermediary state of evolution in year 2000. We selected this year for the interesting properties that the topology of the graph displays for that year. We will discuss these characteristics next. Figure 5 shows the evolution of the field at the end of 2014.
Fig 5. Topology of the graph in year 2014 - the final year that we included in our
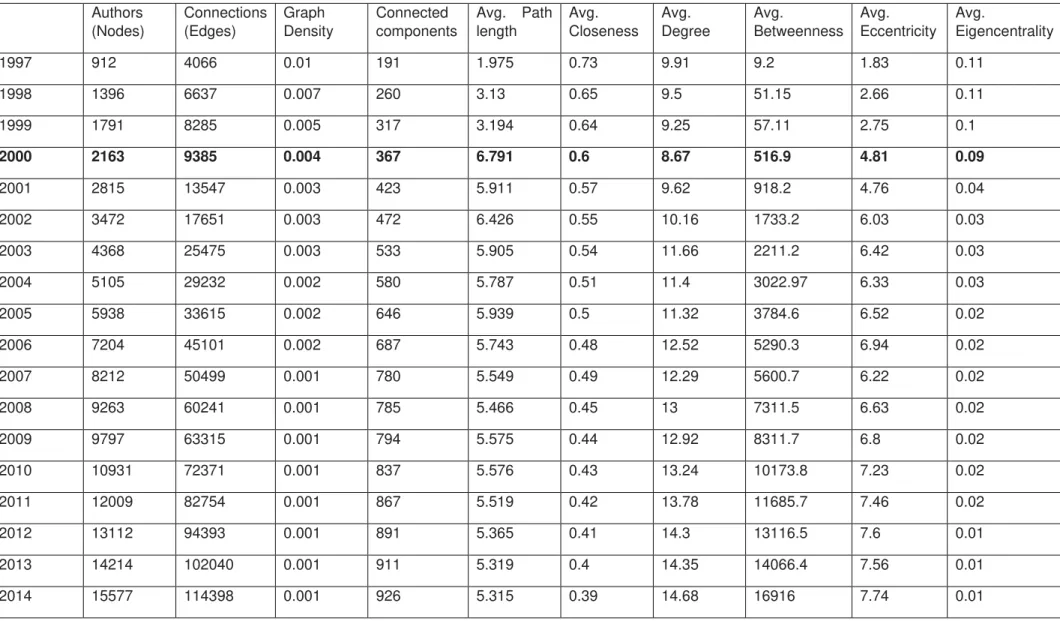
It is very clear from the data presented in Table 1, as well as the figure 3 -5 that the engineering education community publishing in these two journals has grown significantly. Starting with just 912 authors in 1997 with 4.066 connections, the community has grown to 15,577 authors with a staggering 114,398 connections. This growth has essentially increased the average eccentricity from 1.83 in 1997 to 7.74 in 2014 – meaning, the longest geodesic distance between any two random authors on the network has increased significantly over the past years. This in combination with a phenomenal increase in average path length (1.97 in 1997 to 5.315 in 2014) suggests that there are likely to be significant bottlenecks affecting information propagation across the network.
Table 1. Centrality indices computed for all the EJEE+IJEE papers from 1997 - 2014 Authors (Nodes) Connections (Edges) Graph Density Connected components
Avg. Path length Avg. Closeness Avg. Degree Avg. Betweenness Avg. Eccentricity Avg. Eigencentrality
1997 912 4066 0.01 191 1.975 0.73 9.91 9.2 1.83 0.11
1998 1396 6637 0.007 260 3.13 0.65 9.5 51.15 2.66 0.11
1999 1791 8285 0.005 317 3.194 0.64 9.25 57.11 2.75 0.1
2000 2163 9385 0.004 367 6.791 0.6 8.67 516.9 4.81 0.09
2001 2815 13547 0.003 423 5.911 0.57 9.62 918.2 4.76 0.04
2002 3472 17651 0.003 472 6.426 0.55 10.16 1733.2 6.03 0.03
2003 4368 25475 0.003 533 5.905 0.54 11.66 2211.2 6.42 0.03
2004 5105 29232 0.002 580 5.787 0.51 11.4 3022.97 6.33 0.03
2005 5938 33615 0.002 646 5.939 0.5 11.32 3784.6 6.52 0.02
2006 7204 45101 0.002 687 5.743 0.48 12.52 5290.3 6.94 0.02
2007 8212 50499 0.001 780 5.549 0.49 12.29 5600.7 6.22 0.02
2008 9263 60241 0.001 785 5.466 0.45 13 7311.5 6.63 0.02
2009 9797 63315 0.001 794 5.575 0.44 12.92 8311.7 6.8 0.02
2010 10931 72371 0.001 837 5.576 0.43 13.24 10173.8 7.23 0.02
2011 12009 82754 0.001 867 5.519 0.42 13.78 11685.7 7.46 0.02
2012 13112 94393 0.001 891 5.365 0.41 14.3 13116.5 7.6 0.01
2013 14214 102040 0.001 911 5.319 0.4 14.35 14066.4 7.56 0.01
4.1 Potential for Phase Transitions
In Table 1, we highlighted 2000 as a year of particular interest. Table 1 provides some key insights that may indicate the need for further analyses that include more data from the European perspective. The average path length jumped from 3.194 in 1999 to a remarkably high 6.791 for the year 2000 while at the same time, the number of nodes and the edges connecting them did not have a particularly large jump that might explain this change. Also of almost equal importance is the fact that the average betweenness index changed from 57.11 in 1997 to 516.9 in 2000 – this is an order of magnitude jump in network terms. Furthermore, what is curious about these values is that after 2000 the average path length has been extremely steady (decreasing trend) and betweenness has been fairly steady positive trend. This would indicate that the larger community experienced some significant topological bump or disturbance in the year 2000. Our goal in this paper has been to examine the data for evidence of such interesting phenomena (perhaps analogous to the explosive percolation noted by Xian and Madhavan [3] as was mentioned in the Introduction section of this paper).However, we readily acknowledge that we need to investigate community events, literature, and knowledge products further in order to qualitatively define and confirm the significance of the year 2000 to the European and international engineering education community.
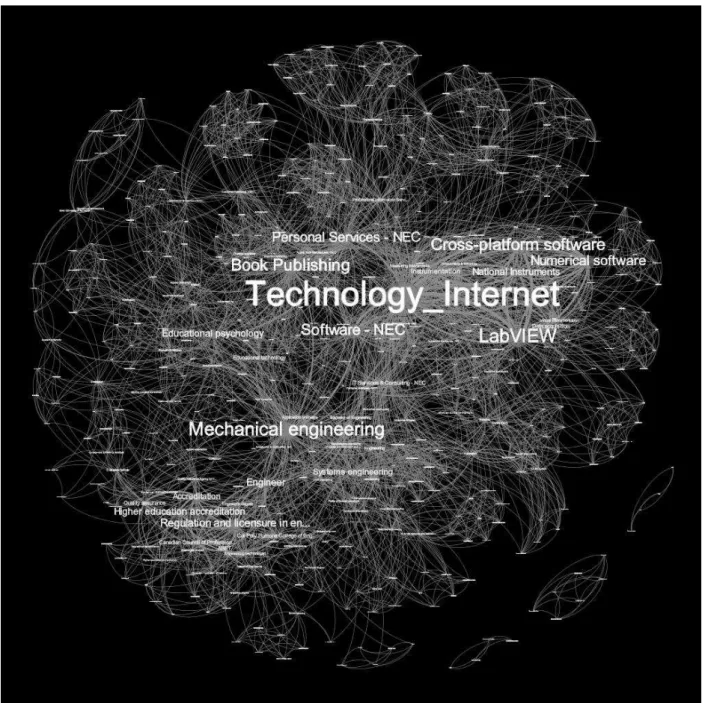
4.2 Connecting Topics
Fig 7. IJEE – Topical connections in the year 2000
5 CONCLUSIONS AND LIMITATIONS
This study is perhaps the first of its kind study within the European and international engineering education domains. We have demonstrated using innovative big data mining and network visualization techniques that the engineering education space in the European context has grown significantly from 1997 to 2014. Our topological analyses suggest an increasing likelihood of information bottlenecks that would hinder information flow and the propagation of innovation. Furthermore, we have also identified the year 2000 as being of particular interest for future analyses. The topical maps show that the European community is broad and diverse – but may lack a particular focus or may need to focus on some key big ideas to promote propagation. In terms of limitations, we understand that our findings are based on only two major data sources. While we believe that our work has tremendous analytic power, we also would like to add more data to our analyses. In the big data regime, the work-flow we present based on 3,331 papers was extremely computer and time intensive to converge. Future research aims to conduct analyses that we anticipate will provide a more detailed and nuanced picture of the evolution of engineering education research in the European context.
6 ACKNOWLEDGMENTS
This study was partially supported by a US National Science Foundation award NSF-DUE 1123108. Bill Williams was partially supported by a grant from the Fundação para a Ciência e a Tecnologia (FCT) of the Portuguese Ministry for Education and Science PTDC/CPE-PEC/112042/2009.
REFERENCES
[1] Achlioptas, Dimitris, D'Souza, Raissa M., & Spencer, Joel. (2009). Explosive Percolation in Random Networks. Science, 323(5920), 1453-1455. doi: 10.1126/science.1167782
Bohman, T. (2009). Emergence of Connectivity in Networks. Science, 323(5920), 1438-1439. doi: 10.1126/science.1171297.
[2] Bohman, T. (2009). Emergence of Connectivity in Networks. Science, 323(5920), 1438-1439. doi: 10.1126/science.1171297.
[3] Xian, H., and K. Madhavan. (2014). Anatomy of Scholarly Communication in Engineering Education: A Big-data Bibliometric Analysis. Journal of Engineering Education 103 (3): 486 – 514.
[4] Froyd, Jeffrey E.; and Lohmann, Jack R.. Chronological and Ontological Development of Engineering Education as a Field of Scientific Inquiry. Cambridge University Press, 2014. http://dx.doi.org/10.1017/CBO9781139013451.003
[5] Fensham P. J. (2004) Defining and identity: The evolution of science education as a field of research, New York, NY, Springer
[6] Borrego, M., and J. Bernhard, (2011), “The Emergence of Engineering Education
Research as an Internationally Connected Field of Inquiry.” Journal of Engineering
Education 100: 14 – 47.
[7] Borrego, M., and B. Olds. (2011). Analysis of Trends in United States National Science Foundation Funding for Engineering Education: 1990 – 2010.” Research in Engineering Education Symposium, 175 – 183.
[8] van Hattum-Janssen, N., B. Williams, and J. M., de Oliveira. 2015. “Engineering Education Research in Portugal, an Emerging Field, International Journal of Engineering Education 31 (2): 674 – 684.
[10] Wankat, P. (2004). Analysis of the first ten years of the Journal of Engineering Education, Journal of Engineering Education, Vol. 93, No. 1, pp. 13–21.
[11] Osorio, N., Osorio. M. (2002). Engineering education in Europe and the USA: A analysis of two journals, Science and Technology Libraries, Vol. 23, No. 1, pp. 49–70. [12] Jesiek, B.K., Borrego, M., Beddoes, K., Hurtado, M., Rajendran, P., & Sangam, D. (2011). Mapping Global Trends in Engineering Education Research, 2005–2008. International Journal of Engineering Education, 27(1), 77–90.
[13] Strobel J., Radcliffe D. F., Yu J.H., Nawaz S., Luo Y.D. and Choi J.H., (2012) Is the Engineering Education Community Becoming More Interdisciplinary? Proceedings of the 2012 ASEE Annual Conference
[14] Williams, B., Neto, P. (2012). Tracking engineering education research and development: Contributions from bibliometric analysis. International Journal of Engineering Pedagogy (IJEP) 2 (2), pp. 37-44.
[15] Malmi, L. Adawi, T., Curmi, R., Graaff, E. de, Duffy, G., Kautz, C., Kinnunen, P., Williams, B. (2013). Methodological Analysis of SEFI EER papers. In: Proceedings of SEFI 2013 conference, paper 87.
[16] Wankat, P. C., Williams, B. and Neto. P., (2014) Engineering Education Research in European Journal of Engineering Education and Journal of Engineering Education: Citation and Reference Discipline Analysis. European Journal of Engineering Education 39 (1): 7 – 17.
[17] Williams, B., Neto, P., Wankat, P. C. (2014). Taking a Snapshot: Four Bibliometric Indicators to Track Engineering Education Research Evolution. International Journal of Engineering Pedagogy (iJEP), 4 (4); 16-22.
[18] Williams, B., Wankat, P. C., Neto, P., (2016), Not so global: a bibliometric look at engineering education research, European Journal of Engineering Education, DOI: 10.1080/03043797.2016.1153043
[19] Madhavan, K., Xian, H., Johri, A., Vorvoreanu, M., Jesiek, B. K., & Wankat, P. C. (2011). Understanding the Engineering Education Research Problem Space Using Interactive Knowledge Networks. In American Society for Engineering Education. American Society for Engineering Education.
[1] Achlioptas, Dimitris, D'Souza, Raissa M., & Spencer, Joel. (2009). Explosive Percolation in Random Networks. Science, 323(5920), 1453-1455. doi: 10.1126/science.1167782
[20] Madhavan, K., Xian, H., Vorvoreanu, M., Jesiek, B., Johri, A., Wang, A., & Wankat, P. (2010). Interactive Knowledge Networks for Engineering Education Research (iKNEER).
[21] iKNEER, see http://ci4ene07.ecn.purdue.edu/ikneer/about.php
[22] Bonacich, P. (1987). "Power and Centrality: A Family of Measures". American Journal of Sociology (University of Chicago Press) 92: 1170–1182. doi:10.1086/228631.
[23] Borgatti, S. P. (2005). "Centrality and Network Flow". Social Networks (Elsevier) 27: 55–71. doi:10.1016/j.socnet.2004.11.008