© European Geosciences Union 2003
and Earth
System Sciences
Regional seismic hazard for Revithoussa, Greece: an earthquake
early warning Shield and selection of alert signals
Y. Xu1, P. W. Burton1, and G.-A. Tselentis2
1School of Environmental Sciences, University of East Anglia, Norwich NR4 7TJ, UK 2Seismology Laboratory, University of Patras, Rio 261 10, Greece
Received: 16 June 2003 – Revised: 19 August 2003 – Accepted: 22 August 2003
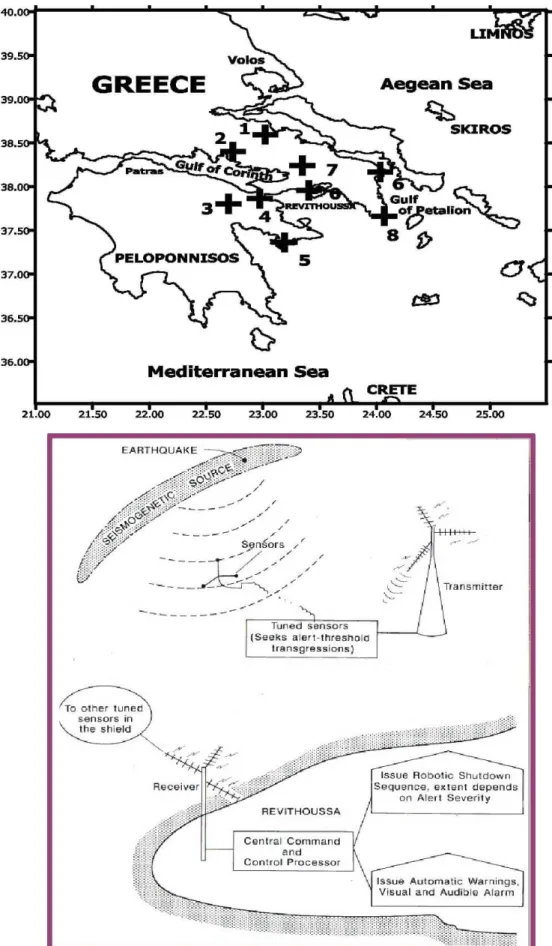
Abstract. The feasibility of an earthquake early warning Shield in Greece is being explored as a European demon-stration project. This will be the first early warning system in Europe. The island of Revithoussa is a liquid natural gas storage facility near Athens from which a pipeline runs to a gas distribution centre in Athens. The Shield is being centred on these facilities. The purpose here is to analyze seismicity and seismic hazard in relation to the Shield centre and the remote sensor sites in the Shield network, eventually to help characterize the hazard levels, seismic signals and ground vi-bration levels that might be observed or create an alert situa-tion at a stasitua-tion. Thus this paper mainly gives estimasitua-tion of local seismic hazard in the regional working area of Revit-houssa by studying extreme peak ground acceleration (PGA) and magnitudes.
Within the Shield region, the most important zone to be detected is WNW from the Shield centre and is at a rela-tively short distance (50 km or less), the Gulf of Corinth (ac-tive normal faults) region. This is the critical zone for early warning of strong ground shaking. A second key region of seismicity is at an intermediate distance (100 km or more) from the centre, the Hellenic seismic zone south or southeast from Peloponnisos. A third region to be detected would be the northeastern region from the centre and is at a relatively long distance (about 150 km), Lemnos Island and neighbor-ing region. Several parameters are estimated to character-ize the seismicity and hazard. These include: the 50-year PGA with 90% probability of not being exceeded (pnbe) us-ing Theodulidis & Papazachos strong motion attenuation for Greece, PGANTP; the 50-year magnitude and also at the 90% pnbe, M50and MP50, respectively. There are also estimates of the earthquake that is most likely to be felt at a damaging intensity level, these are the most perceptible earthquakes at intensities VI, VII and VIII with magnitudes MVI, MVIIand MVIII. Example results (from many) include the correspond-ing parameters describcorrespond-ing the hazard for Revithoussa as fol-lows: PGANTP: 203 cm s−2, M50: 6.5, Mp50: 6.9, MVI: 5.8, Correspondence to:Y. Xu ([email protected])
MVII: 6.1 and MVIII: 6.4. These data are also useful in se-lecting expected alert-signals i.e. examples of strong ground vibration histories that might be expected at a Shield station in the alert situation.
1 Introduction
Earthquake early warning or earthquake real-time warning systems use modern technology to attempt to estimate earth-quake parameters during the actual faulting process. It calcu-lates earthquake strong motion (usually ground acceleration) by detecting the first elastic wave of the sequence that arrives from an earthquake. It can issue a warning prior to the ar-rival of the damaging secondary wave for the facilities far enough from the seismic source if a dangerous threshold is exceeded. The leading time is from a few seconds up to 1– 2 min. The early warning system for Mexico City was suc-cessfully tested by a large earthquake (7.3 MS, 14 September 1995) by giving warning information 72 sec before the arrival of strong ground motion (Espinosa et al., 1995).
relation to the Shield centre and the remote sensor sites in the Shield network, eventually to help characterize the haz-ard levels, seismic signals and ground vibration levels that might be observed or create an alert situation at a station. Thus this paper mainly gives estimation of local seismic haz-ard in the regional working area of Revithoussa by studying extreme PGA and magnitudes. In other words, this estima-tion contains two major parts of the study. The first is the hazard analysis based on the extreme magnitude by the third Gumbel model and earthquake perceptibility around the gas storage site (Revithoussa). The second is the study of lo-cal ground acceleration hazard of the working area, based on free-zonation, using the first Gumbel model.
2 Shield regional working area of Revithoussa and data
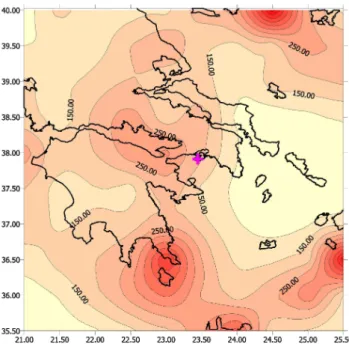
Generally, the engineering seismic influence from the region beyond 200 km away from a site can be ignored. Based on this principle, the region (35.50◦–40.00◦N, 21.00◦– 25.50◦E) is selected for this study for the Revithoussa hydro-carbon site (37.961◦N, 23.404◦E) (Fig. 1). Extreme strong ground motion and magnitude occurring in the region 200 km around the site will be studied.
First we update the MB earthquake catalogue for Greece 1900–1978 (Makropoulos and Burton 1981; Makropoulos et al., 1989) to include 1979–1999 (Burton et al., 2003c). The basic references for this updated work are ISC, NEIC and CMT Harvard catalogues. NOA (National Observatory of Athens) catalogue was consulted for the most recent events. Engdahl et al. (1998), Pr´eez (1999), and some Greek seis-mologists (Papazachos and Papazachou, 1997; Margaris and Papazachos, 1999; Baba et al., 2000) were also consulted to improve basic qualities such as accuracy, completeness and homogeneity. This updated catalogue is used to com-pute peak ground acceleration at a point of interest associ-ated with each event. Generally speaking, the earthquake records (1900–1999, MS ≥ 5.5) for Greece can be regarded as complete samples of data (e.g. Makropoulos and Burton 1981; Makropoulos et al., 1989; Papazachos and Papaza-chou, 1997; Papaioannou and Papazachos, 2000). We use these records for analysis in this paper.
3 Hazard analysis of extreme magnitude and earth-quake perceptibility
3.1 Methods
– Extreme magnitude from Gumbel III model
Gumbel’s third asymptotic distribution of the extreme values (Gumbel, 1966) has long proven to be suitable to describe seismic activity, one reason being the existence of an upper limit to the extreme value for magnitude:
GI I I =exp "
−
ω−m ω−µ
1λ#
(1)
whereωis this upper limit to magnitude occurrence,m
the extreme magnitude in a unit interval (typically one year interval),µis the characteristic extreme magnitude value,λdescribes the curvature of the distribution and
GI I Istands for probability in the Gumbel’s third model. As mentioned above, if the sample interval is set to beT
years, rather than annual, and the samples are indepen-dent of each other, then the relation (1) can be written as:
GI I IT →(GI I I)T =exp "
−T
ω−m ω−µ
1λ#
(2)
The probability densityρcan thus be obtained:
ρ= dG I I I T
dm =T (ω−µ)/λG
I I I T
ω−m ω−µ
1/λ−1 (3)
from which the most probable magnitude over the time interval T, by setting dmdρ = 0, is (Makropoulos and Burton, 1985a):
Mprob=ω−(ω−µ)
1−λ T
λ
. (4)
Then the extreme magnitudemin the T-year interval has a probability of(GI I I)T and can be calculated as:
m=ω−(ω−µ)h−lnGI I IT /Tiλ. (5)
– Perceptibility
Earthquake perceptibility is defined to be the probability that a site perceives ground shaking at least of intensity
Iarising from, i.e. conditional on, an earthquake occur-rence of magnitudeM(Burton, 1978, 1990), i.e.:
P (I /M)=Pc(I )Pe(M) (6)
The termPc(I )estimates the probability of perceiving intensity levelI from a magnitudeMearthquake, this will increase with magnitude, and can be considered as a ratio of the felt area at intensityI or greater to that of the given area investigated. The felt area at intensityI
can be obtained from the local macroseismic attenuation relationship. Papazachos and Papaioannou (1997), on the basis of macroseismic field investigation of the shal-low earthquakes in the Balkan area, using a large sample of macroseismic data, suggested that the macroseismic intensity at a site is a result of anisotropic radiation at the seismic source, geometrical spreading and anelas-tic attenuation along the wave path. They suggested the following attenuation relation for shallow earthquakes:
Fig. 2. The largest magnitude expected over the time period of 50 years for the Revithoussa working area.
where I is the intensity on the MM scale, M is the corresponding moment magnitude and R the epicen-tral distance in kilometer (Papaioannou and Papaza-chos, 2000). Although Eq. (7) was derived using MM intensities, it should be noted that the intensities de-fined by the recently introduced European Macroseis-mic Scale 1998 (EMS-98 Scale) are not significantly different. The EMS-98 is the most recent adaptation of the previous intensity scales. The termPe(M)is the derivative (probability density) of the third asymptotic law and estimates the probability of a magnitudeM oc-currence. The magnitude which is most probably felt at a site at intensity levelI or higher corresponds to the largest value of Eq. (6) i.e. where
d[P (I /M)]
dM =0 (8)
This is the condition that defines the “most perceptible earthquake”. In other words, this determines the earth-quake that is most likely to be perceived or felt at any level of ground motion at a site or in a region and is therefore a characteristic property of the region (Burton, 1990).
– The most probable magnitude
The most expected extreme magnitude of aT-year in-terval is the one where the corresponding probability density is largest, i.e. d2GI I IdmT(ω,µ,λ)2 =0 from which it follows that:
mT =ω−(ω−µ)[(1−λ)/T]λ (9)
Fig. 3.The magnitude with 90% probability of not being exceeded (pnbe, 1 in 10 chance of being exceeded) over the time period of 50 years for the Revithoussa working area.
and the earthquake with probabilityP of being a maxi-mum or not being exceeded in a T-year interval can be obtained from Eq. (5) as:
mT(P )=ω−(ω−µ)[(−lnP )/T]λ. (10) The magnitude error σm, however, can be estimated from the following equation:
σm2 =σω2 ∂M
∂ω 2
+σµ2 ∂M
∂µ 2
+
σλ2 ∂M
∂λ 2
+2σωµ2 ∂M
∂ω
+ ∂M
∂µ
+.... (11)
where ∂M∂ω, ∂M∂µ and ∂M∂λ are the partial derivatives of Eq. (1), andσω,σµandσλthe square root of the diag-onal elements of the covariance matrix (Burton, 1979; Burton and Makropoulos, 1985; Makropoulos and Bur-ton, 1985a).
3.2 Analysis
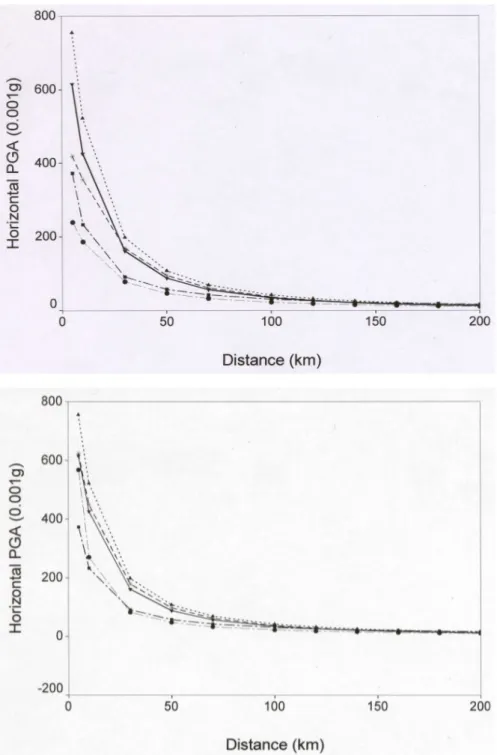
Table 1.Main parameters estimated to characterize the seismicity and hazard: the 50-year magnitude and at the 90% pnbe level, M50and MP50, and the most perceptible earthquakes at intensities VI, VII and VIII with magnitudes MVI, MVIIand MVIII, for all Shield seismic alert stations of Revithoussa
LAT LON M50 Mp50 MVI MVII MVIII Station 0 37.961 23.404 6.5 6.9 5.8 6.1 6.4 Station 1 38.598 23.019 6.9 7.3 6.1 6.3 6.6 Station 2 38.402 22.734 6.8 7.3 6.0 6.2 6.6 Station 3 37.805 22.694 6.8 7.3 5.9 6.2 6.6 Station 4 37.866 22.969 6.7 7.3 5.9 6.2 6.6 Station 5 37.366 23.188 6.7 7.2 6.2 6.4 6.7 Station 6 38.171 24.031 6.4 6.9 6.0 6.2 6.4 Station 7 38.244 23.344 6.6 7.1 5.8 6.1 6.5 Station 8 37.667 24.067 6.5 6.8 6.2 6.3 6.5
Firstly, the distribution of the largest magnitude M50 (Eq. 9, Fig. 2) expected over the time period of 50 years for the working area is roughly in the range 6.6–6.8 M50for the Revithoussa site is about 6.5 and the values for Peloponnisos-Hellenic zone are around 6.6. This should be the key place to be monitored by the Shield system. The zone of M50 ≈7.0 is at the northeastern part of the working area, which is to the east of Volos. This zone is far from the Revithoussa site although the value is high. However it should still be of note for the Shield system. The zone with low value M50 ≈6.4 is close to the Gulf of Petalion which is to the east of the Revithoussa site.
Secondly, the values of the magnitude Mp50 (Eq. 10, Fig. 3) expected with a non-exceedance probability of 90% over the time period of 50 years for the Gulf of Corinth are in the range∼ 7.2−7.4. This zone is again close to Re-vithoussa site and therefore it should be the main zone to be monitored. Mp50 for the site is about 6.8. The zones with Mp50 ≥ 7.4 are: (a) the region to the west of Patras and (b) that to the northeast of Volos. The first of these is not far from the site and it is of great importance for the Shield. The low value Mp50≤6.8 is for the Gulf of Petalion in the east.
Results for earthquake perceptibility are shown as Figs. 4a–c. These also provide reference hazard parame-ters for the Shield early warning monitoring system; the most perceptible earthquake indicating the magnitude of the earth-quake that is most likely to be felt at a specific level of inten-sity. The main results are as follows.
Firstly, the values of most perceptible earthquake mag-nitude MVI (Eq. 8, Fig. 4a) for intensity VI in the Gulf of Corinth are approximately 5.8–6.0. This zone is close to the Revithoussa site. There is MVI≈5.8 for the site. MVI≥6.8 is for the locality to the northeast of Skiros. The values for most other localities are in the range 6.2–6.6. Secondly, the value MVII(Fig. 4b) for intensity VII at the site is 6.1. The values for the Gulf of Corinth and the neighboring region near Revithoussa are approximately 6.2–6.4. The high value MVII ≥ 7.0 is for the locality near Limnos in the north-eastern part of the working area. The values for most other
localities are 6.4–6.8. Thirdly, the value MVIII(Fig. 4c) for intensity VIII at the site is about 6.4. The values of MVIIIfor the Gulf of Corinth and the neighboring region near Revit-houssa are approximately 6.4–6.6. The place with high value MVIII ≥ 7.1 is near Limnos. The values for other localities in the working area are in the range 6.6–6.8.
The main parameters estimated to characterize the seis-micity and hazard are: the 50-year magnitude and the same with 90% pnbe (one in 10 chance of being exceeded), M50 and Mp50, and the most perceptible earthquakes at intensi-ties VI, VII and VIII with magnitudes MVI, MVIIand MVIII. These parameters for all Shield seismic alert stations of Re-vithoussa (Fig. 1) are shown in Table 1. These are the impor-tant references characterizing seismicity for the stations.
4 Regional strong ground acceleration hazard for Re-vithoussa based on free-zonation
4.1 Method
4.1.1 Gumbel’s 1st distribution for annual maximum accel-eration
Similar to the discussion in Sect. 3.1, we also use the extreme value distribution of Gumbel (1966) for this study. Here the first Gumbel asymptotic distribution (Gumbel I) is given by
GI(a)=exp{−exp[−α(a−u)]} (12) whereαand the characteristic modal extremeuare two pa-rameters of this distribution, andGIis the probability thata
is an annual extreme of peak ground acceleration at a point. The peak ground acceleration expected to be the annual maximum with probabilityP is given by
aP =u− [ln(−lnP )]/α (13) or the peak ground acceleration which has probabilityP of not being exceeded inT year is
(a)
(b) (c)
Fig. 4.The most perceptible earthquake magnitude for intensities(a)VI,(b)VII and(c)VIII, respectively for the Revithoussa working area.
This paper does not use Gumbel’s 3rd distribution for the an-nual maximum acceleration as this will result in poor conver-gence with value of curvatureλclose to zero (Makropoulos and Burton, 1985b), because maximum accelerations are not physically analogous to maximum magnitudes.
4.1.2 Peak ground acceleration attenuation model – MB Peak Ground Acceleration Model
Makropoulos and Burton (1985b) derived a peak accel-eration attenuation model from eight well known for-mulae which resulted from worldwide studies because
the limited numbers of strong motion records did not permit regional study of attenuation of ground vibration in Greece at that time. This model or formula is given by
(Ahorner and Rosenhaur, 1975; Bath, 1975; Donovan, 1973; Katayama, 1974; Orphal and Lahoud, 1974; Shah and Movassate, 1975; Trifunac, 1976). This average law was demonstrably compatible with the few obser-vations of strong ground motion then available. – TP Peak Ground Acceleration Model
This TP model (Theodulidis and Papazachos, 1992) was obtained directly using 105 horizontal records from 36 shallow earthquakes in Greece, with magni-tudes 4.5–7.0, (plus a further 16 horizontal components from four shallow subduction earthquakes in Japan and Alaska, 7.2–7.5 M):
ln(ah)=3.88+1.12MS−
1.65 ln(R+15)+0.41S+0.7P (16) whereahis the peak horizontal acceleration in cm s−2,
Ris epicentral distance in km,Sis equal to zero at “al-luvium” sites and equal to one at a “rock” site, andP
is zero for mean or 50-percentile values and one for 84-percentile values.
– NTP Peak Ground Acceleration Model
Theodulidis (2001) pointed out that there are some problems about Eq. (16) when selecting S = 1 at a “rock” site. This is because the majority of strong mo-tion data, which they had at that time recorded on “rock” and used in their regression analysis, came from a sta-tion whose surface geology was characterized as “rock”. In fact, the later geotechnical investigation on site found a thin layer (∼ 10 m) of weathered material that am-plified strong motion around 5–7 Hz. Therefore PGA was observed in this frequency range. The soil category “rock” is slightly biased by this site and this attenuation relation for “rock” may be absolutely valid only for sim-ilar soil/depth properties. However, peak ground veloc-ity and displacement were not affected by this thin layer because these anomalies usually appear at the lower fre-quencies. Theodulidis suggests thatS = 0.5 should be used for “stiff soil” condition instead ofS = 1 for “rock”. This corrected TP model is referred to as the NTP model.
– Ambraseys Peak Ground Acceleration Model
Ambraseys (1997) in a European Commission SRD document supplies the equation for horizontal accelera-tions:
log(ah)= −1.242+0.238MS−
0.00005r−0.907 log(r)+0.240P (17a) log(ah)= −0.895+0.215MS−
0.00011r−1.070 log(r)+0.247P . (17b)
Equation (17a) is calculated with no depth control in MS magnitude range 5.0–7.3.hois 4.04 inr2=d2+h2oin Eq. (17a). Equation (17b) is calculated with depth con-trol usingr2=d2+h2(ris slant distance to the source using focal depthh; there is noho) and in MSmagnitude range 5.0–7.3. Equations (17a) and (17b) may be appro-priate to analyze horizontal PGA seismic hazard by our extreme value approach, since magnitudes<5 MS are unlikely to cause damage and be of engineering concern (Burton et al., 2003b).
– Comparisons for the Suite of Attenuation Relationships with Distance
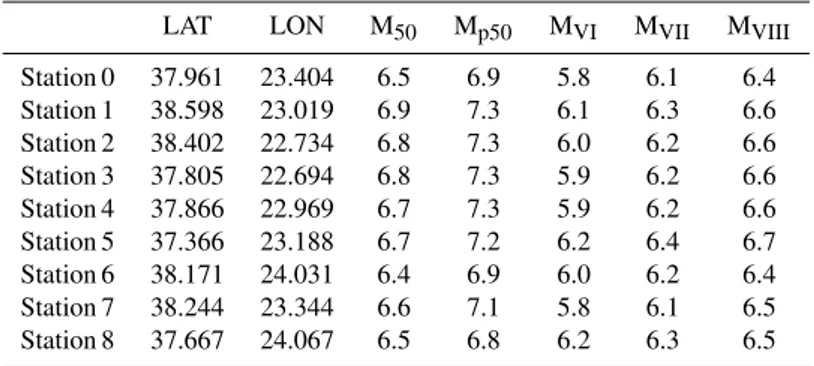
We adopt 50-percentile curves for attenuation relations because it would preclude comparison of ensuing re-sults with values in the NEAK (New Greek Seismic Resistant Code, 1992) map if 84-percentile high values were used. Figures 5a and b show the peak ground ac-celeration as a function of distance for a nominal earth-quake of magnitude 6.5 MS at focal depthsh =10 km andh = 0 km respectively. In other words, we use ah tp, ah ntp, ah am1, ah am2 and ah mb respectively from Eqs. (16), NTP model, (17a) and (17b) for 50 per-centile values and for “rock” sites, and 15 for this study. These five curves are shown in Figs. 5a–b under the dif-ferent depth conditions.
The curves ah tp and ah ntp obtained directly from Greek data are quite similar to the curve ah mb de-rived from other areas outside Greece, while the curve ah am1 derived from European data without depth con-trol is close to ah am2 derived from European data with-out depth control. The PGA values represented by the curves ah tp and ah mb are quite similar to the cor-responding values in the NEAK map, but those rep-resented by the curves ah am1 and ah am2 are much smaller than those in the NEAK map. It seems that the Eqs. (15), (16) and NTP model are most appropriate to analyze horizontal PGA seismic hazard by our extreme value approach and further equations are being devel-oped by others (Margaris et al., 2002).
4.2 Estimations of regional ground acceleration hazard of Revithoussa
4.2.1 MB model
The Greek region is divided into a grid of mesh 0.5◦intervals of latitude and longitude. All earthquakes above the magni-tude threshold are selected within two degrees of each grid point to calculate PGA at the grid point based on the MB model and the Gumbel I distribution fitted to the ranked an-nual extreme PGA values. This paper uses 0.5◦ meshes as the base for all attenuation models.
Figure 6 shows the result based on the MB model with 90% probability of not being exceeded during the time period
Fig. 5. (a)The attenuation relations used in the seismic hazard evaluation in Greece for a nominal earthquake of magnitude 6.5 MSat focal depthh= 10 km. The key for the curves is as follows: Ah tp (N) and ah ntp (H) are respectively for Eq. (16) and NTP model (stiff soil sites) for 50-percentile values. ah am1 (), ah am2 (•) and ah mb (*) are respectively for the Eqs. (17a) and (17b) for 50-percentile values and for “rock” sites, and for Eq. (15);(b)as same as (a) except at focal depthh=0.0 km.
Gulf of Corinth, and Limnos Island and neighboring regions northeast from Revithoussa. The region east and southeast from Revithoussa has low PGA values. The distribution for data 1964–1999 (MS ≥ 4.0) has similar results. The PGA value based on the MB model with 90% probability of not being exceeded during the time periodT =50 years for data 1900–1999 (MS ≥5.5) is about 186 cm s−2for Revithoussa (Table 2). NTP, AM1 and AM2 models at Revithoussa.
4.2.2 TP model
Figure 7 shows the results based on TP model with 90% probability of not being exceeded during the time period
of the Helenic arc seismic zone) and Limnos Island and the neighboring region northeast from Revithoussa. However the region east from Revithoussa has low PGA values. From the distribution for data 1964–1999 (MS ≥ 4.0) there are two main regions with high PGA values≥ 300 cm s−2: the Gulf of Corinth and the northeastern part of this working area. However, in this case the Peloponnisos is not a re-gion with high values because the time period for this set of data does not include the strong earthquakes before 1964. The PGA value based on the TP model with 90% probability of not being exceeded during the time periodT =50 years (50-percentile, rock sites) for data 1900–1999 (MS ≥ 5.5) is about 249 cm s−2for Revithoussa (Table 2).
4.2.3 NTP model
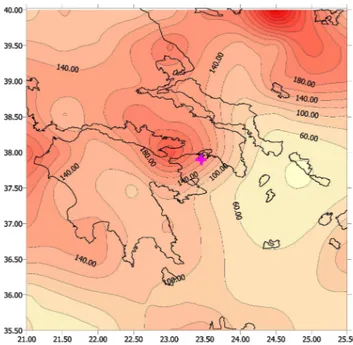
From Fig. 8 based on the NTP model with 90% probability of not being exceeded during the time periodT =50 years (50-percentile, rock sites) for data 1900–1999 (MS ≥ 5.5), there are three regions with high PGA values (≥250 cm s−2). These are the Gulf of Corinth, the region south from the Pelo-ponnisos (that is the Hellenic seismic zone from the southern and southwestern coast of Peloponnisos to Crete along the Hellenic trench or arc), and the Limnos Island region north-east from Revithoussa. The region north-east from Revithoussa still shows low PGA values. The PGA values based on the NTP model are smaller than those for the TP model and these seem to be more reasonable. This distribution based on NTP model is quite similar to that from the TP model (Fig. 9). As discussed in Sect. 4.1.2, NTP model is derived from the TP model with some corrections. Therefore the PGA distribu-tions based on the NTP model should be more reasonable. The results based on the TP model show larger values which are very different from the results based on either the MB model or NEAK. The NTP model is derived directly from Greek data. It should correctly reflect the distribution of the expected strong motion for the Revithoussa working area in Greece. The distribution for data 1964–1999 (MS ≥ 4.0) is similar to that in Fig. 8. The reason it does not reflect the dis-tribution with high value in the Peloponnisos is as described in Sect. 4.2.2. The PGA value based on the NTP model with 90% probability of not being exceeded during the time pe-riodT = 50 years (50-percentile, stiff soil sites) for data 1900–1999 (MS≥ 5.5) is about 203 cm s−2for Revithoussa (Table 2).
4.2.4 Ambraseys models
In the distribution of PGA values based on Ambraseys model (no depth control) with 90% probability of not being ex-ceeded during the time periodT =50 years (50-percentile, rock sites, Eq. (17a) for data 1900–1999 (MS ≥ 5.5)) (Fig. 9), we can still find three regions with PGA values ≥ 150 cm s−2. These are the Gulf of Corinth, Limnos Is-land and the neighboring region and the region southeast from Peloponnisos. However the values based on Ambraseys model are small compared with the corresponding values
Fig. 6. Contour map of expected maximum peak ground acceler-ation (cm s−2) with 90% pnbe during 50 years for the Shield re-gional working area of Revithoussa: MB model (Data: 1900–1999, MS≥ 5.5; see Eq. (15)).
Fig. 7. Contour map of expected maximum peak ground acceler-ation (cm s−2) with 90% pnbe during 50 years for the Shield re-gional working area of Revithoussa: TP model (Data: 1900–1999, MS≥ 5.5; see Eq. (16), 50-percentile, rock sites).
Table 2.Acceleration (cm s−2) which have 90% probability of not being exceeded inT years based on the MB, TP, NTP, AM1 and AM2 models at Revithoussa
Revithoussa T =25 years T =50 years T =100 years T =200 years References 37.96◦N
23.40◦E
116.2 129.1 142.1 155.0 MB 1 163.3 185.8 208.3 230.8 MB 2 161.6 180.6 199.5 218.4 TP 1 218.4 248.7 278.9 309.1 TP 2 131.7 147.1 162.5 177.9 NTP 1 177.9 202.6 227.2 251.8 NTP 2 101.2 111.9 122.7 133.4 AM1 1 116.3 131.0 145.7 160.5 AM1 2
64.7 71.5 78.3 85.0 AM2 1
82.2 92.8 103.5 103.5 AM2 2
MB 1: Data (MS≥4.0, 1964–1999) 90%, MB Model. MB 2: Data (MS≥5.5, 1900–1999) 90%. MB Model.
TP 1: Data (MS≥4.0, 1964–1999) 90%, TP Model, 50-percentile, rock sites. TP 2: Data (MS≥5.5, 1900–1999) 90%. TP Model., 50-percentile, rock sites. NTP 1: Data (MS≥4.0, 1964–1999) 90%, NTP Model, 50-percentile, stiff soil sites. NTP 2: Data (MS≥5.5, 1900–1999) 90%. NTP Model., 50-percentile, stiff soil sites.
AM1 1: Data (MS≥4.0, 1964–1999) 90%, Ambraseys Model with no depth control, 50-percentile, rock sites. AM1 2: Data (MS≥5.5, 1900–1999) 90%. Ambraseys Model with no depth control, 50-percentile, rock sites. AM2 1: Data (MS≥4.0, 1964–1999) 90%, Ambraseys Model with depth control, 50-percentile, rock sites. AM1 2: Data (MS≥5.5, 1900-1999) 90%. Ambraseys Model with depth control, 50-percentile, rock sites.
Fig. 8. Contour map of expected maximum peak ground acceler-ation (cm s−2) with 90% pnbe during 50 years for the Shield re-gional working area of Revithoussa: NTP model (Data: 1900–1999, MS≥ 5.5; see modifications to Eq. (16), 50-percentile, rock sites).
The results based on Ambraseys model (depth control) with 90% probability of not being exceeded during the time
periodT =50 years (50-percentile, rock sites, Eq. 17b) for data 1900–1999 (MS ≥ 5.5) are shown in Fig. 10. We still can see two regions with values≥ 100 cm s−2. These are the Gulf of Corinth and Limnos Island and neighboring re-gion. However the values are even smaller than those without depth control. The results for data 1964–1999 (MS ≥ 4.0) are similar to those in Fig. 10. The PGA value based on this model with 90% probability of not being exceeded during the time periodT =50 years (50-percentile, rock sites) for data 1900–1999 (MS≥ 5.5) is about 93 cm s−2for Revithoussa.
4.3 Summary
Table 3.Acceleration (cm s−2) which have 90% probability of not being exceeded in 50 years based on the MB, TP, NTP, AM1 and AM2 models for all Shield seismic alert stations of Revithoussa (Data 1900–1999, MS≥5.5)
LAT LON NTP TP MB AM1 AM2
Station 0 37.961 23.404 202.6 248.6 185.8 131.0 92.8 Station 1 38.598 23.019 138.7 192.7 166.8 114.2 88.0 Station 2 38.401 22.734 220.6 307.6 217.4 150.1 109.2 Station 3 37.805 22.694 196.7 274.4 131.6 97.1 66.4 Station 4 37.866 22.969 264.9 371.1 184.9 174.1 91.1 Station 5 37.366 23.188 196.9 277.2 102.8 143.6 55.3 Station 6 38.171 24.031 87.2 121.4 88.3 75.6 48.2 Station 7 38.244 23.344 274.2 336.6 268.6 232.2 153.3 Station 8 37.667 24.067 71.1 99.0 57.5 56.1 33.8
Fig. 9.Contour map of expected maximum peak ground accelera-tion (cm s−2) with 90% pnbe during 50 years for the Shield regional working area of Revithoussa: Ambraseys model without depth con-trol (Data: 1900–1999, MS ≥ 5.5; See Eq. (17a) , 50-percentile, rock sites).
model (Theodulidis, 2001) corrects the TP model (Theodu-lidis and Papazachos, 1992) and therefore it reflects the real-ity of seismicreal-ity in Greece. According to NTP model, NEAK values may need to increase slightly to be in complete har-mony. This result is supported by other results such as as-sessments of earthquake hazard in Turkey and its neighbor-ing region by Erdik et al. (1999).
In spite of the above small differences, all analyses show in common that, within the Shield region, the most impor-tant zone to be monitored is WNW from Revithoussa, the Shield centre and is at a relatively short distance (50 km or less), the Gulf of Corinth (active normal faults) region. This is the critical zone for early warning. A second key region of seismicity is at an intermediate distance (100 km or more)
Fig. 10.Contour map of expected maximum peak ground accelera-tion (cm s−2) with 90% pnbe during 50 years for the Shield regional working area of Revithoussa: Ambraseys model with depth control (Data: 1900–1999, MS ≥ 5.5; See Eq. (17b), 50-percentile, rock sites).
Fig. 11.continued ...
This value should be accepted as a typical estimation of local ground acceleration hazard of this earthquake early warning Shield. Here accelerations (cm s−2) which have 90% prob-ability of not being exceeded in 50 years based on the MB, TP, NTP, AM1 and AM2 models for all Shield seismic alert stations (Fig. 1a) of the early warning network are also listed in Table 3. These provide key references for expected levels of strong ground shaking at these stations and can be consid-ered as alert-level strength.
In short, the above results provide the background to de-sign earthquake monitoring stations for this system to supply an effective early warning Shield for Revithoussa hydrocar-bon centre. These data enable the selection of expected alert-signals i.e. examples of strong ground vibration histories that might be expected at these Shield stations.
It must be stressed that average attenuation models have been used here because the aim of this paper is to provide the general estimation of local seismic hazard in the regional working area of Revithoussa by studying extremes of PGA.
It is well known that individual source-site azimuths may de-viate from such averages. Uncertainties introduced by the influence of the local ground condition at the sites may also need to be taken specifically into account. PGA alone may not be a sufficient basis for developing critical alarm param-eters and the frequency content and the duration of signals may also prove important in the decision making process, never-the-less PGA quantifies the regional seismic hazard through a well understood parameter.
5 Selection of strong motion signals for alert
motion signals for which stations in the early warning Shield network should be on the alert.
As discussed in Sects. 3–4, accelerations which have 90% probability of not being exceeded in 50 years based on dif-ferent attenuation models for all Shield seismic alert stations are listed in Table 3. Also the main parameters estimated to characterize the seismicity and hazard: the 50-year mag-nitude and at the 90% pnbe, M50 and MP50, and the most perceptible earthquakes at intensities VI, VII and VIII with magnitudes MVI, MVII and MVIIIfor all stations are shown in Table 1. These can be used in the selection of earthquake strong motion data, which might rarely be monitored – per-ceived – at each station. These are termed “alert signals”.
The extreme magnitude values such as M50and MP50 (Ta-ble 1) are the criteria used to select the characteristic events. The CD-ROM of the European strong-motion databank (Am-braseys et al., 2000) supplies a database for the selections. Here we have two principles. The first is idealism. This means that the maximum values in Table 1 should be used as criteria for selection for the station if possible. The sec-ond is practical. This means that the database should be used fully for the selections if reasonable. In practice, a balance between both principles is maintained to ascertain likely re-peatable average peak acceleration in a future event.
As shown in Table 1, the range for MP50is 6.8−7.3 MS. Variation of ±0.5 is accepted on magnitude when consid-ering the errors and other factors. Then the range be-comes 6.8±0.5−7.3±0.5 MS. If MP50 is accepted as the criterion, then a small number of historical strong mo-tion records or signals are selected because the maximum record for Greece in the databank of European accelero-grams is 7.02 MS. However the range for M50is 6.4–6.9 M50. With variation of ±0.5 on magnitude, the range becomes 6.4±0.5−6.9±0.5 MSusing M50 as the criterion. There are two advantages. First, there is a considerable number of historical strong motion records or signals now available for selection. In this way the database can be used effectively. Secondly, this selection will contain some of those from the previous selection, which used MP50as the criterion. M50is used herein as a principal criterion with variation of±0.5 on magnitude.
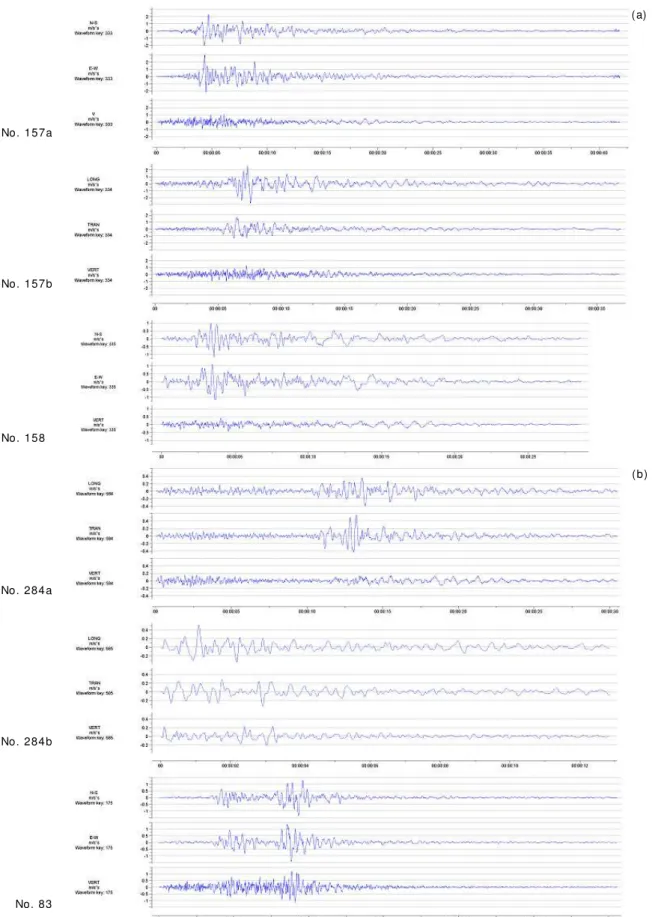
For example, M50(6.5 MS) for Revithoussa (Shield cen-tre or Station 0, Table 1) is used as the criterion. Then the range 6.5±0.5 or 6.07.0 MS should be the search param-eter for the scenario. Therefore the results of strong mo-tion records selected as scenario or “alert signals” for Revit-houssa are as listed in Tables 4a–b. The Tables contain: time, depth, Mb, ML and MS, epicentral intensity, station for the record, station intensity or site intensity, PGA X, PGA Y and PGA Z. Table 4a is from the strong-motion database of the National Observatory of Athens (NOA, Greece) and Table 4b is from the database of the Institute of Engineering Seis-mology & Earthquake Engineering (ITSAK, Greece). The strong motion accelerograms (N–S, E–W and V) for the char-acteristic event (24 February 1981, 20:53:37 LT, 38.100◦N, 22.840◦E, 6.5 MS. No. 157a in Table 4a) are shown in Fig. 11a (No. 157a). Those for the rest of the
characteris-tic events (Nos: 157b, 158, 284a, 284b, 83, 165a, 165b, 169a and 169b in Tables 4a–b) are also shown in Fig. 11a–d. The strong motion records selected for Station 8 are the same as those for Station 0. Similarly, those selected for Stations 1–5, 6 and 7 are listed respectively in Tables 5a–b, 6a–b and 7. And the strong motion accelerograms (N–S, E–W and V) for the characteristic events for the above stations are also illus-trated in Figs. 11a–d.
6 Conclusions
These studies of local ground acceleration hazard based on MB, AM, TP and NTP models supply a common frame for estimation within the regional working area centred at Revit-houssa, although different models provide different results. Among these, the NTP model is judged to be most reason-able because it is designed explicitly for Greek seismicity and its results are quite similar to the NEAK seismic estima-tion (Burton et al., 2003b). Our common estimaestima-tion suggests that there are three main zones likely to be detected within the Shield regional working area. The results for extreme earthquake magnitudes also support the above estimation al-though some are not as detailed as the acceleration study. The main results are discussed as follows (Figs. 2–4, Figs. 6–11): The most important zone to be monitored is the region NWW or W from this site at a relatively short distance (50 km or less) for the expected high PGA value distribu-tions. This is the Gulf of Corinth (active normal faults) region. The PGA value based on NTP model with 90% probability of not being exceeded during the time period
T =50 years (50-percentile, stiff soil sites) for data 1900– 1999 (MS ≥ 5.5), PGANTP, is in the range≥ 250 cm s−2. The largest magnitude M50 expected over the time period of 50 years for the working area is in the range 6.7–6.8 and the values of the magnitude Mp50expected with a non-exceedance probability of 90% over the time period of 50 years are in the range 7.2–7.4. In addition, the correspond-ing parameters for the most perceptible earthquake magni-tudes MVI, MVIIand MVIII, corresponding to intensity VI, VII and VIII are in the respective ranges of 5.8–6.0, 6.2–6.4 and 6.4–6.6. This is the critical zone for early warning.
The second key region of seismicity likely to be detected is at an intermediate distance (100 km or more) from the Shield centre, the Hellenic seismic zone south or southeast from Peloponnisos. The corresponding parameters for estima-tions of local hazard are as follows: PGANTP =250 cm s−2, M50 :6.6, Mp50:7.0−7.2, MVI:6.2−6.8, MVII:6.4 and MVIII:6.8−7.0.
Xu
et
al.:
Re
g
ional
seism
ic
hazard
for
Re
vit
houssa,
G
reece
771
Table 4. (a)Strong motion records selected as scenario or “alert signals” for Revithoussa (Station 0) and Station 8 in the earthquake early warning Shield [Strong-motion database of the National Observatory Of Athens (NOA, Greece)]. EINT: epicentral intensity; WINT: site intensity (above)
(b)Strong motion records selected as scenario or “alert signals” for Revithoussa ( Station 0) and Station 8 in the earthquake early-warning Shield [Strong-motion database of the the Institute of Engineering Seismology & Earthquake Engineering (ITSAK, Greece)] (below)
DAY, MONTH,
YEAR
HOUR, MIN,
SEC [UTC]
LAT [deg]
LON [deg]
DEP [km]
MB ML MS EINT STATION EPIC [km]
WINT PGA_X [m/s²]
PGA_Y [m/s²]]
PGA_Z [m/s²]
No
20/06/78 20:03:21 40.730 23.250 8 6.1 6.0 6.40 VIII+ Thessaloniki City Hotel
29 VII -1.365 -1.431 1.200 83
24/02/81 20:53:37 38.100 22.840 10 6.1 6.8 6.69 IX Korinthos OTE Building
20 VII 2.257 3.037 1.139 157a
24/02/81 20:53:37 38.100 22.840 10 6.1 6.8 6.69 IX Xilokastro OTE Building
19 -2.839 1.671 1.242 157b
25/02/81 02:35:51 38.130 23.050 8 5.7 6.1 6.41 VIII Korinthos OTE Building
25 VI -1.144 -1.176 -0.439 158
23/05/94 06:46:16 35.570 24.720 80 6.0 -9.9 6.10 VI Chania OTE Building
64 -0.387 0.565 -0.176 284a
23/05/94 06:46:16 35.570 24.720 80 6.0 -9.9 6.10 VI Rethimno OTE Building
32 0.513 -0.340 0.225 284b
DAY, MONTH,
YEAR
HOUR, MIN,
SEC [UTC]
LAT [deg]
LON [deg]
DEP [km]
MB ML MS EINT STATION EPIC [km]
WINT PGA_X [m/s²]
PGA_Y [m/s²]
PGA_Z [m/s²]
No
17/01/83 12:41:30 38.070 20.250 14 6.2 6.0 7.02 Agrinio Town Hall
118 V -0.312 -0.508 -0.127 165a
17/01/83 12:41:30 38.070 20.250 14 6.2 6.0 7.02 Agrinio Town Hall
Lefkada-Hospital
93 V+ 0.641 -0.618 -0.160 165b
23/03/83 23:51:05 38.230 20.290 3 5.6 5.5 6.16 Lefkada Hospital
75 IV -0.215 0.250 0.068 169a
23/03/83 23:51:05 38.230 20.290 3 5.6 5.5 6.16 Argostoli OTE Building
Y
.
Xu
et
al.:
Re
gional
seismic
ha
zard
for
R
evithouss
a,
Greece
Table 5. (a)Strong motion records selected as scenario or “alert signals” for Stations 1–5 in the earthquake early warning Shield [Strong-motion database of the National Observatory of Athens (NOA, Greece)] (above)
(b)Strong motion records selected as scenario or “alert signals” for Stations 1–5 in the earthquake early warning Shield [Strong-motion database of the the Institute of Engineering Seismology & Earthquake Engineering (ITSAK, Greece)] (below)
DAY, MONTH,
YEAR
HOUR, MIN,
SEC [UTC]
LAT [deg]
LON [deg]
DEP [km]
MB ML MS EINT STATION EPIC
[km]
WINT PGA_X [m/s²]
PGA_Y [m/s²]
PGA_Z [m/s²]
No
20/06/78 20:03:21 40.730 23.250 8 6.1 6.0 6.40 VIII+ Thessaloniki City Hotel
29 VII -1.365 -1.431 1.200 83
24/02/81 20:53:37 38.100 22.840 10 6.1 6.8 6.69 IX Korinthos OTE Building
20 VII 2.257 3.037 1.139 157a
24/02/81 20:53:37 38.100 22.840 10 6.1 6.8 6.69 IX Xilokastro OTE Building
19 -2.839 1.671 1.242 157b
25/02/81 02:35:51 38.130 23.050 8 5.7 6.1 6.41 VIII Korinthos OTE Building
25 VI -1.144 -1.176 -0.439 158
DAY, MONTH,
YEAR
HOUR, MIN,
SEC [UTC]
LAT [deg]
LON [deg]
DEP [km]
MB ML MS EINT STATION EPIC
[km]
WINT PGA_X [m/s²]
PGA_Y [m/s²]
PGA_Z [m/s²]
No
17/01/83 12:41:30 38.070 20.250 14 6.2 6.0 7.02 Agrinio Town Hall
118 V -0.312 -0.508 -0.127 165a
17/01/83 12:41:30 38.070 20.250 14 6.2 6.0 7.02 Agrinio Town Hall
Lefkada-Hospital
Xu
et
al.:
Re
g
ional
seism
ic
hazard
for
Re
vit
houssa,
G
reece
773
Table 6. (a)Strong motion records selected as scenario or “alert signals” for Station 6 in the earthquake early warning Shield [Strong-motion database of the National Observatory of Athens (NOA, Greece)] (above)
(b)Strong motion records selected as scenario or “alert signals” for Station 6 in the earthquake early warning Shield [Strong-motion database of the Institute of Engineering Seismology & Earthquake Engineering (ITSAK, Greece) (below)]
DAY, MONTH, YEAR
HOUR, MIN,
SEC [UTC]
LAT [deg]
LON [deg]
DEP [km]
MB ML MS EINT STATION EPIC
[km]
WINT PGA_X [m/s²]
PGA_Y [m/s²]
PGA_Z [m/s²]
No
20/06/78 20:03:21 40.730 23.250 8 6.1 6.0 6.40 VIII+ Thessaloniki City Hotel
29 VII -1.365 -1.431 1.200 83
24/02/81 20:53:37 38.100 22.840 10 6.1 6.8 6.69 IX Korinthos
OTE Building
20 VII 2.257 3.037 1.139 157a
24/02/81 20:53:37 38.100 22.840 10 6.1 6.8 6.69 IX Xilokastro
OTE Building
19 -2.839 1.671 1.242 157b
25/02/81 02:35:51 38.130 23.050 8 5.7 6.1 6.41 VIII Korinthos
OTE Building
25 VI -1.144 -1.176 -0.439 158
23/05/94 06:46:16 35.570 24.720 80 6.0 -9.9 6.10 VI Chania
OTE Building
64 -0.387 0.565 -0.176 284a
23/05/94 06:46:16 35.570 24.720 80 6.0 -9.9 6.10 VI Rethimno
OTE Buildin
32 0.513 -0.340 0.225 284b
DAY, MONTH,
YEAR
HOUR, MIN,
SEC [UTC]
LAT [deg]
LON [deg]
DEP [km]
MB ML MS EINT STATION EPIC
[km]
WINT PGA_X [m/s²]
PGA_Y [m/s²]
PGA_Z [m/s²]
No
23/03/83 23:51:05 38.230 20.290 3 5.6 5.5 6.16 Lefkada
Hospital
75 IV -0.215 0.250 0.068 169a
23/03/83 23:51:05 38.230 20.290 3 5.6 5.5 6.16 Argostoli
OTE Building
Y
.
Xu
et
al.:
Re
gional
seismic
ha
zard
for
R
evithouss
a,
Greece
Table 7. (a)Strong motion records selected as scenario or “alert signals” for Station 7 in the earthquake early warning Shield [Strong-motion database of the National Observatory of Athens (NOA, Greece)] (above)
(b)Strong motion records selected as scenario or “alert signals” for Station 7 in the earthquake early warning Shield [Strong-motion database of the Institute of Engineering Seismology & Earthquake Engineering (ITSAK, Greece)] (below)
DAY, MONTH,
YEAR
HOUR, MIN,
SEC [UTC]
LAT [deg]
LON [deg]
DEP [km]
MB ML MS EINT STATION EPIC
[km]
WINT PGA_X [m/s²]
PGA_Y [m/s²]
PGA_Z [m/s²]
No
20/06/78 20:03:21 40.730 23.250 8 6.1 6.0 6.40 VIII+ Thessaloniki
City Hotel
29 VII -1.365 -1.431 1.200 83
24/02/81 20:53:37 38.100 22.840 10 6.1 6.8 6.69 IX Korinthos
OTE Building
20 VII 2.257 3.037 1.139 157a
24/02/81 20:53:37 38.100 22.840 10 6.1 6.8 6.69 IX Xilokastro
OTE Building
19 -2.839 1.671 1.242 157b
25/02/81 02:35:51 38.130 23.050 8 5.7 6.1 6.41 VIII Korinthos
OTE Building
25 VI -1.144 -1.176 -0.439 158
23/05/94 06:46:16 35.570 24.720 80 6.0 -9.9 6.10 VI Chania
OTE Building
64 -0.387 0.565 -0.176 284a
23/05/94 06:46:16 35.570 24.720 80 6.0 -9.9 6.10 VI Rethimno
OTE Building
32 0.513 -0.340 0.225 284b
DAY, MONTH,
YEAR
HOUR, MIN,
SEC [UTC]
LAT [deg]
LON [deg]
DEP [km]
MB ML MS EINT STATION EPIC
[km]
WINT PGA_X [m/s²]
PGA_Y [m/s²]
PGA_Z [m/s²]
No
17/01/83 12:41:30 38.070 20.250 14 6.2 6.0 7.02 Agrinio
Town Hall
118 V -0.312 -0.508 -0.127 165a
17/01/83 12:41:30 38.070 20.250 14 6.2 6.0 7.02 Agrinio
Town Hall Lefkada-Hospital
93 V+ 0.641 -0.618 -0.160 165b
23/03/83 23:51:05 38.230 20.290 3 5.6 5.5 6.16 Lefkada
Hospital
75 IV -0.215 0.250 0.068 169a
23/03/83 23:51:05 38.230 20.290 3 5.6 5.5 6.16 Argostoli
OTE Building
The corresponding parameters for estimations of local hazard for the Revithoussa centre itself are as follows: PGANTP : 203 cm s−2, M50 : 6.5, Mp50 : 6.9, MVI : 5.8, MVII:6.1 and MVIII:6.4.
The acceleration that has 90% probability of not being ex-ceeded in 50 years based on the MB, TP, NTP, AM1 and AM2 models for all Shield seismic alert stations (Fig. 1a) of Revithoussa is listed in Table 3. Among these data, PGANTP for Stations 1–8 is respectively 139, 221, 197, 265, 197, 87, 274 and 71 cm s−2. The main parameters estimated to char-acterize the seismicity and hazard: the 50-year magnitude and at the 90% pnbe, M50 and MP50, and the most percep-tible earthquakes at intensities VI, VII and VIII with magni-tudes MVI, MVII and MVIIIfor all Shield seismic alert sta-tions (Fig. 1) are also shown in Table 1.
The above results and parameters supply a full base char-acterizing the local seismic hazard for the regional working area centered at Revithoussa and earthquake monitoring sta-tions in this system providing an early warning Shield for the Revithoussa hydrocarbon site and gas distribution centre.
The parameters for the scenario such as M50 listed in Table 1 are used as the criteria to select the characteristic events from the CD-ROM of the European strong-motion databank. The results for strong motion records selected as potential “alert signals” for Revithoussa and the Shield sta-tions have been identified and are listed in Tables 4–7. The strong motion accelerograms (N–S, E–W and V) for these characteristic events for Revithoussa and the Shield stations are also illustrated in Fig. 11. These analyses of seismicity and seismic hazard in relation to the Shield centre and the remote sensor sites in the Shield network help characterize the hazard levels, seismic signals and ground vibration levels that might be observed during the creation of an alert situa-tion at a stasitua-tion.
Acknowledgements. We are grateful to Christos Papaioannou (IT-SAK), John Kalogeras (NOA) and Nick Ambraseys, who have pro-vided access to earthquake strong motion data.
The SHIELDS project is supported by CEC Contract No. NNE5/1999/381.
References
Ahorner, L. and Rosenhaur, W.: Probability distribution of earth-quake accelerations for the sites in Western Germany, in: Proc. 5th Europ. Conf. Earth. Eng., Istanbul, 1975.
Ambraseys, N. N.: The prediction of earthquake peak ground ac-celeration in Europe, Earthquake Eng. and Struct. Dynamics, 24, 467–490, 1995.
Ambraseys, N. N.: Measurement of strong ground motion in Eu-rope (MASGE), in: Seismic Risk in the EuEu-ropean Union (Vol. I), Proc. review meetings in Brussels 2–3 and 23–24 May 1996, ECSC-EC-EAEC Brussels, Luxembourg 1997, 195–217, edited by Ghazi, A. and Yeroyanni, M., 1997.
Ambraseys, N., Smit, P., Beradi, R., Rinalds, D., Cotton, F. and Berge-Thierry, C.: European strong-motion database documen-tation, European Council, Environment and Climate Research Programme, (CD-ROM), 2000.
Baba, A. B., Papadimitriou, E. E., Papazachos, B. C., Papaioannou, C. A., and Karakostas, B. G.: Unified local magnitude scale for earthquakes of south Balkan area, Pure appl. Geophys, 157, 765– 783, 2000.
Bath, M.: Seismicity of the Tanzania region. Tectonophysics, 27, 353–379, 1975.
Burton, P. W.: Perceptible earthquake in the United Kingdom, Geo-phys. J. R. Astro. Soc., 54, 475–479, 1978.
Burton, P. W.: Seismic risk in southern Europe through to India examined using Gumbel’s third distribution of extreme values, Geophys. J. R. Astro. Soc., 59, 249–280, 1979.
Burton, P. W.: Variation in seismic risk parameters in Britain, Pro-ceeding of the 2nd international symposium on the analysis of seismicity and on seismic hazard, Liblice, Czechoslovakia, May 18–23, 495–530, 1981.
Burton, P. W.: Pathways to seismic hazard evaluation: extreme and characteristic earthquakes in areas of low and high seismicity, Nat. Hazards 3, 275–291, 1990.
Burton, P. W. and Makropoulos, K. C.: Seismic risk of the Circum-pacific earthquakes: II. Extreme values using Gumbel’s third distribution and the relationship with strain energy release, Pure Appl. Geophys., 123, 849–869, 1985.
Burton, P. W., Qin, C., Tselentis, G.-A., and Sokos, E. A.: Extreme earthquake and earthquake perceptibility study in Greece and its surrounding area, Nat. Hazards, in press, 2003a.
Burton, P. W., Xu, Y., Tselentis, G.-A., Sokos, E. A. and Aspinall, W.: Strong ground acceleration seismic hazard in Greece and neighboring regions, Soil Dyn. EA, 23, 159–181, 2003b. Burton, P. W., Xu, Y., Qin, C, Tselentis, G.-A., and Sokos, E. A.:
Catalogue of seismicity in Greece, and the adjacent area for the twentieth century, Tectonophysics, in press, 2003c.
Donovan, N. C.: A statistical evaluation of strong motion data in-cluding the February 9, 1971, San Fernando earthquake, in: Proc. 5th World Conf. Earth. Eng., Rome, 1973.
Engdahl, E. R., Hilst, R. V. D., and Buland, R: Global teleseis-mic earthquake relocation with improved travel time and proce-dure for depth determination, Bull. seism. Soc. Am. 88, 722–743, 1998.
Espinosa Aranda, J. M., Jim´enez, A., Ibarrola, G., Alcantar, F., Aguilar, A., Inostraza, M., and Maldonado, S.: Mexico city seis-mic alert system, Seismological Research Letters, 66, 42–53, 1995.
Erdik, M., Biro, Y. A., Onur, T., Sesatyan, K., and Birgoren, G.: Assessment of earthquake hazard in Turkey and neighbouring regions, Ann. Geofis. 42, 1125–1138, 1999.
Erdik, M., Fahjan, Y., Ozel, O., Alick, H., Mert, A., and Gul, M: Istanbul earthquake rapid response and the early warning system, Bull. European Earthq. Eng., in press, 2003.
Gumbel, E. J.: Statistics of extremes, Columbia Univ. Press, New York, 375 pp, 1966.
Katayama, T.: Statistical analysis of peak acelerations of recorded earthquake ground motions. Seisan-Kenkyu 26(1), 18–20, 1974. Makropoulos, K. C. and Burton, P. W.: A catalogue of seismicity in Greece and adjacent areas, Geophys. J. R. astr. Soc. 65, 741–762, 1981.
Makropoulos, K. C. and Burton, P. W.: Seismic hazard in Greece, I. Magnitude recurrence, Tectonophysics, 117, 205–257, 1985a. Makropoulos, K. C. and Burton, P. W.: Seismic hazard in Greece,
II. Ground acceleration, Tectonophysics 117, 259–294, 1985b. Makropoulos, K. C., Drakopoulos, J. K., and Latousakis, J. B.:
Margaris, B. N. and Papazachos, C. B.: Moment-magnitude re-lations based on strong-motion records in Greece, Bull. Seism. Soc. Am. 89, 442–455, 1999.
Margaris, B., Papazachos, C., Papaioannou, Ch., Theodulidis, N., Kalogeras, I., and Skarlatoudis, A.: Ground motion attenuation relations for shallow earthquakes in Greece, 12th European Con-ference on earthquake engineering, Paper reCon-ference 385, Elsevier Science Ltd., 2002.
NEAK: New Greek Seismic Resistant Code, Government Bull, No 613B/12-10-1992, 1992.
Orphal, D. L. and Lahoud, J. A.: Prediction of peak ground motion from earthquakes, Bull. seism. Soc. Am. 64, 1563–1574, 1974. Papaioannou, Ch. A. and Papazachos, B. C.: Time-independent and
time-dependent seismic hazard in Greece based on seismogenic source, Bull. seism. Soc. Am. 90, 22–33, 2000.
Papazachos, B. C. and Papaioannou, Ch. A.: The macroseismic field in the Balkan area, J. Seismology, 1, 181–201, 1997. Papazachos, B. and Papazachou, C.: The earthquakes of Greece,
Ziti, P. & Co., Thessaloniki, 1997.
Pr´erez, O.: Revised world seismicity catalog (1950–1997) for strong (MS≥6) shallow (h≥70 km) earthquakes, Bull. seism. Soc. Am. 89, 335–341, 1999.
Shah, H. C. and Movassate, M.: Seismic risk analysis – Califor-nia state water project, in: Proc. 5th Europ. Conf. Earth. Eng., Istanbul, 1975.
Theodulidis, N. P. and Papazachos, B. C.: Dependence of strong ground motion on magnitude-distance, site geology and macro-seismic intensity for shallow earthquakes in Greece: I, Peak horizontal acceleration, velocity and displacement, Soil Dyn. & Earthquake Eng. 11, 387–402, 1992.
Theodulidis, N. P.: Personal Communication, 2001.