ENERGY AND ENVIRONMENT
Volume 4, Issue 3, 2013 pp.441-448
Journal homepage: www.IJEE.IEEFoundation.org
Alternative solvents for post combustion carbon capture
Udara S. P. R. Arachchige
1, Morten C. Melaaen
1,21 Telemark University College, Porsgrunn, Norway.
2 Tel-Tek, Porsgrunn, Norway.
Abstract
The process model of post combustion chemical absorption is developed in Aspen Plus for both coal and gas fired power plant flue gas treating. The re-boiler energy requirement is considered as the most important factor to be optimized. Two types of solvents, mono-ethylamine (MEA) and di-ethylamine (DEA), are used to implement the model for three different efficiencies. The re-boiler energy requirement for regeneration process is calculated. Temperature and concentration profiles in absorption column are analyzed to understand the model behavior. Re-boiler energy requirement is considerably lower for DEA than MEA as well as impact of corrosion also less in DEA. Therefore, DEA can be recommended as a better solvent for post combustion process for carbon capture plants in fossil fuel fired power industries.
Copyright © 2013 International Energy and Environment Foundation - All rights reserved.
Keywords: Carbon dioxide capture; Flue gas; MEA; DEA; Re-boiler duty.
1. Introduction
Global climate change has rapidly become the most prominent environmental issue in the present day. It is a well-known fact that the main contributor for the issue is the fossil fuel based energy generation. It can be solved either by shifting to renewable energy sources (clean energy sources) or eliminating the emission of available plants with emission reduction technologies. However, green house gas emission free technologies will not be practical solution in near future. Therefore, most possible alternative is carbon capture and sequestration as it can be applied in existing power plants and industries without
major modifications. The most well-established method for carbon dioxide (CO2) capture is post
combustion chemical absorption method with alkanolamine solvents. Weak base amines are reacted with
CO2 and other acid gases to form weak chemical bonds. Alkanolamine can be mainly categorized as,
primary (monoethanolamine-MEA, diglycolamine-DGA), secondary (diethanolamine-DEA) and tertiary (methyldiethanolamine-MDEA, triethanolamine-TEA) amines. However, the most applicable amine
among them is MEA, due to the low partial pressure of CO2 in the flue gas of fossil fuel fired power
plant [1]. The most important parameter when designing a carbon capture plant is operating cost, which is related to the energy requirement in regeneration process. Even though MEA is widely use amine for
CO2 capture, regeneration energy requirement is high for that process. Therefore, alternative solvents
should be analyzed to perform the post combustion capture process with fewer energy requirements. Both MEA and DEA are considered as highly reactive amines for gas absorption process [2]. However, secondary amines are less corrosive as well as required less heat of regeneration, due to an additional ethanol group [3]. The objective of this research was to compare the possible solvents that can be used
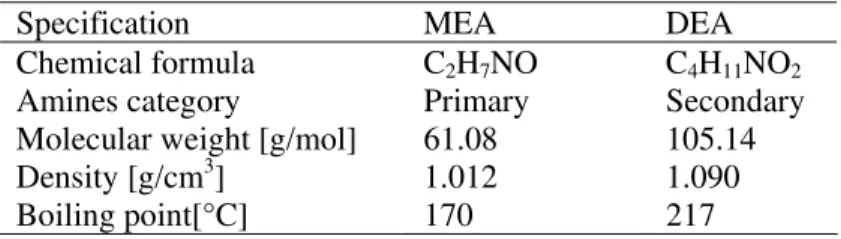
are selected to optimize the CO2 capture process. Operating conditions are selected to avoid the main drawback of alkanolamine, which is large energy requirement. The physical properties of both amines are summarized in Table 1 [4].
Table 1. Basic information about MEA and DEA
Specification MEA DEA
Chemical formula C2H7NO C4H11NO2
Amines category Primary Secondary
Molecular weight [g/mol] 61.08 105.14
Density [g/cm3] 1.012 1.090
Boiling point[°C] 170 217
2. Model development
For the analysis of the solvent for carbon capture process, the Aspen Plus flow sheet modeling tool is
used. The CO2 removal model for both coal and gas fired flue gases is developed. According to the
solvent type, parameters and operating conditions have to be selected. The most versatile property method in Aspen Plus, that is Electrolyte Non Random Two Liquid (NRTL) method, is used to implement the process optimization. The model is developed for 85%, 90% and 95% removal efficiencies. The flue gas compositions for both coal and gas fired systems are given in Table 2.
Table 2. Inlet flue gas composition and parameters used for the simulations [5, 6]
Parameter Coal Fired Gas Fired
Flow rate [kg/s] 673.4 793.9
Temperature [K] 313 313
Pressure [bar] 1.1 1.1
Major Composition Mol% Mol%
H2O 8.18 8.00
N2 72.86 76.00
CO2 13.58 4.00
O2 3.54 12.00
H2S 0.05 0.00
The reactions used for the CO2 capture model with MEA and DEA are tabulated in Table 3 [7]. The
equilibrium and kinetic data are taken from the literatures and the Aspen Plus databanks for the calculations and given in the same table [8, 9]. The reactions 4 and 5 are only valid for coal fired flue gas reacting system.
The required operating conditions for MEA and DEA in Electrolyte NRTL property method are present in Table 4 [10]. Aspen Plus simulation tool has certain limitations and indicate below. The limitations of MEA and DEA mass fractions are 50 and 30 [w/w%] respectively.
The optimal specifications for the coal and gas processes such as amine concentration, lean loading, and solvent flow rate are summarized in Table 5 for different efficiency values. Optimum specifications are selected after the number of simulations which has been performed in previous studies [11].
The concentration of DEA has to be maintained less compared to MEA concentration. Even though in previous studies, it has shown that higher concentration will lead to lower re-boiler energy requirement, it is not accurate to perform simulation for higher concentrations due to limitations in Aspen Plus simulation tool (Table 4).
The basic process flow scheme for post combustion process is shown in Figure 1. The description of the process is given in the previous publications [12].
Table 3. Chemical reactions of MEA and DEA process
Thermodynamic behavior
Reactions Reaction
number Aj Bj Cj Dj
MEA+CO2+H2O system
+ −+
↔OH H O O
H2 3
2 (1) 132.89 -13445.9 -22.47 0
+ −+
↔
+ H O HCO H O
CO2 2 2 3 3 (2) 231.46 -12092.1 -36.78 0
− +
−+ ↔ + 2
3 3
2
3 H O H O CO
HCO (3) 216.05 -12431.7 -35.48 0
+ −+
↔
+H S HS H O O
H2 2 3 (4) 214.58 -12995.4 -33.55 0
+ −
− ↔ +
+HS S H O O
H 3
2
2 (5) -9.74 -8585.47 0 0
+ ++ ↔ + O H MEA O H
MEAH 2 3 (6) -3.038 -7008.3 0 -0.00313
−
− + ↔ +
3
2O MEA HCO
H
MEACOO (7) -0.52 -2545.53 0 0
DEA+CO2+H2O system (In addition to reactions 1-5)
+ + + ↔ + O H DEA O H
DEAH 2 3 (8) -13.3373 -4218.70 0 0.00987
−
− + ↔ +
3
2O DEA HCO
H
DEACOO (9) 16.5026 -4068.76 -1.502 0
T
D
T
ln
C
T
B
A
K
ln
j=
j+
j+
j+
j(10) Equation for equilibrium constants
Kinetic behavior
kj nj Ej To
MEA+CO2+H2O system
(11) 4.32e+13 0 13249 298
−
−→ +
OH CO
HCO3 2 (12) 2.38e+17 0 29451 298
+ −+
→ +
+CO H O MEACOO H O
MEA 2 2 3 (13) 9.77e+10 0 9855 298
O H CO MEA O H
MEACOO + 3 → + 2+ 2
+
− (14) 2.7963e+20 0 17229 298
DEA+CO2+H2O system (In addition to reactions 11-12)
+
− +
→ +
+CO H O DEACOO H O
DEA 2 2 3 (15) 6480000 0 5072 298
O H CO DEA O H
DEACOO + 3 → + 2 + 2
+
− (16) 1.34e+17 0 11497 298
⎥ ⎥ ⎦ ⎤ ⎢ ⎢ ⎣ ⎡ ⎟⎟ ⎠ ⎞ ⎜⎜ ⎝ ⎛ − − ⎟⎟ ⎠ ⎞ ⎜⎜ ⎝ ⎛ = 0 j n 0 j j T 1 T 1 R E exp T T k r
j (17) Equation for rate constants
Table 4. Range of applicability of amine models [10]
Range of applicability MEA DEA
Temperature [K] <393.15 <413.15
Concentration [w/w%] <50 <30
−
− →
+ 3
2 OH HCO
Table 5. Optimum solvent conditions for both coal and gas fired power plant flue gas capture process
Specification 85% Removal
Efficiency
90% Removal Efficiency
95% Removal Efficiency Coal fired power plant CO2 capture
MEA DEA MEA DEA MEA DEA
Amine concentration [w/w%] 40 30 40 30 40 30
CO2 lean loading [mole CO2/mole amine] 0.27 0.05 0.27 0.05 0.25 0.05
Solvent flow rate [tonne/hr] 7845 8698 8480 9620 8400 10825 Gas fired power plant CO2 capture
Amine concentration [w/w%] 40 30 35 30 30 30
CO2 lean loading [mole CO2/mole amine] 0.30 0.10 0.25 0.10 0.25 0.10
Solvent flow rate [tonne/hr] 3624 4053 3168 4421 3890 6000
Figure 1. Process flow diagram of post combustion chemical absorption
3. Simulations
The CO2 capture model is developed for three different efficiencies as 85%, 90% and 95% for both coal
and gas fired power plant flue gases. The selected solvent conditions are used for the model
implementation with recommended column parameters. Temperature profiles and CO2 loading profiles
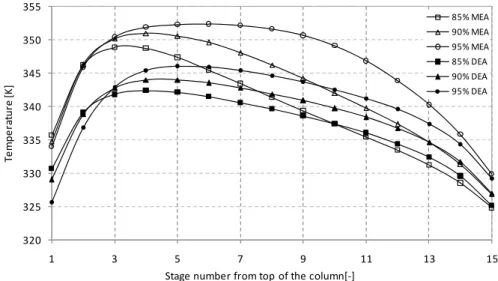
are analyzed for both cases. Figures 2-5 represent the liquid and vapour phase temperature profiles in absorber column for coal and gas fired capture model.
According to Figures 2 and 3, maximum temperature for coal fired flue gas capture process with MEA as solvent is in the range of 347 - 352 K. However, for DEA solvent process the maximum temperature reach slightly lower values, and it is around 342 - 346 K. When efficiency is higher, temperature profiles also show higher values for both MEA and DEA. Liquid and vapor phases have almost similar patterns for both solvent cases. The absorber tends to exhibit a temperature bulge at the top of the column for both liquid and vapor phase. Temperature bulge is due to highly exothermic reactions at the top of the column.
Gas fired process show lower temperature profiles compared to coal fired system. Maximum temperature is around 330-331 K and 326-330 K for MEA and DEA solvent systems, respectively. However, maximum temperature is varying with removal efficiencies. Higher removal efficiencies have higher temperature profiles along the absorption tower. The shape of the temperature profiles has the similar patterns mentioned in the literatures even though the maximum temperature value is different [14].
Figure 6 is representing the CO2 loading profiles in absorption column for coal fired flue gas treating
system for both MEA and DEA solvents. The CO2 loading profiles for MEA are having higher values
compared to DEA. Lower efficiency process models are showing higher CO2 loading profiles. However,
rich loading values are closer for all efficiencies and slightly higher for 85% removal model. Figure 7,
which is showing CO2 loading profiles for gas fired flue gas systems, have similar patterns.
320 325 330 335 340 345 350 355
1 3 5 7 9 11 13 15
Te
mp
e
rat
u
re
[K
]
Stage number from top of the column[‐]
85% MEA 90% MEA 95% MEA 85% DEA 90% DEA 95% DEA
Figure 2. Liquid phase temperature profiles in absorption column for coal fired flue gas
320 325 330 335 340 345 350 355
1 3 5 7 9 11 13 15
Te
mp
e
ra
tu
re
[K
]
Stage number from top of the column [‐]
85% MEA
90% MEA
95% MEA
85% DEA
90% DEA
95% DEA
Figure 3. Vapor phase temperature profiles in absorption column for coal fired flue gas
314 316 318 320 322 324 326 328 330 332 334
1 3 5 7 9 11 13 15
Te
m
p
e
rat
u
re
[K
]
Stage number from top of the column [‐]
85% MEA
90% MEA
95% MEA
85% DEA
90% DEA
95% DEA
314 316 318 320 322 324 326 328 330 332 334
1 3 5 7 9 11 13 15
Te mp e ra tu re [K ]
Stage number from top of the column [‐]
85% MEA
90% MEA
95% MEA
85% DEA
90% DEA
95% DEA
Figure 5. Vapor phase temperature profile in absorption column for gas fired flue gas
0 0.05 0.1 0.15 0.2 0.25 0.3 0.35 0.4 0.45 0.5
1 3 5 7 9 11 13 15
CO 2 lo a d in g [m o le CO 2 /m o le am in e ]
Stage number from top of the column [‐]
85% MEA
90% MEA
95% MEA
85% DEA
90% DEA
95% DEA
Figure 6. CO2 loading profiles in absorption column for coal fired flue gas
0 0.05 0.1 0.15 0.2 0.25 0.3 0.35 0.4 0.45 0.5
1 3 5 7 9 11 13 15
CO 2 lo a d in g [m o le CO 2 /m o le am in e ]
Stage number from top of the column [‐]
85% MEA
90% MEA
95% MEA
85% DEA
90% DEA
95% DEA
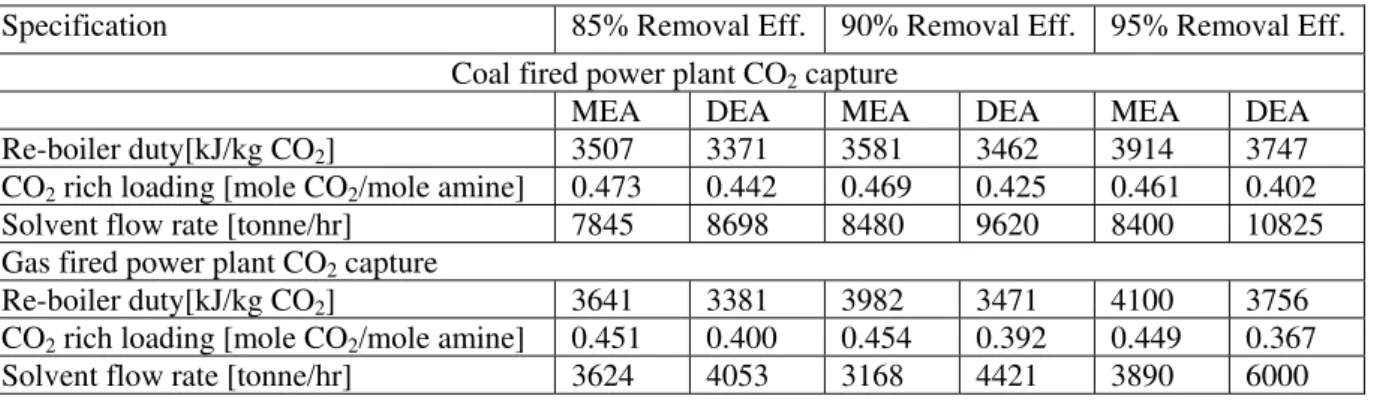
Table 6. Re-boiler energy requirement, rich loading and solvent circulation flow rate for coal and gas fired processes
Specification 85% Removal Eff. 90% Removal Eff. 95% Removal Eff.
Coal fired power plant CO2 capture
MEA DEA MEA DEA MEA DEA Re-boiler duty[kJ/kg CO2] 3507 3371 3581 3462 3914 3747
CO2 rich loading [mole CO2/mole amine] 0.473 0.442 0.469 0.425 0.461 0.402
Solvent flow rate [tonne/hr] 7845 8698 8480 9620 8400 10825 Gas fired power plant CO2 capture
Re-boiler duty[kJ/kg CO2] 3641 3381 3982 3471 4100 3756
CO2 rich loading [mole CO2/mole amine] 0.451 0.400 0.454 0.392 0.449 0.367
Solvent flow rate [tonne/hr] 3624 4053 3168 4421 3890 6000
As it can be seen from the Table 6, DEA processes have lower re-boiler energy demand for all the cases. Gas fired processes have a slightly higher re-boiler energy requirement than coal fired system. Reason
for that is, gas fired flue gas consist of less amount of CO2. Therefore, a large amount of liquid flow has
to be purified in the stripper. Therefore, energy requirement to heat the solvent is high for gas fired process. When removal efficiency is increasing, re-boiler energy requirement also increases. Reason for
that is, to capture a higher amount of CO2, it has to process higher solvent in the stripper. DEA process
shows lower re-boiler duties for all the models. The 85% removal model of DEA process has 3371 kJ/kg
CO2 for coal fired system and 3381 kJ/kg CO2 for gas fired system. This is lower value compared to
3507 kJ/kg CO2 and 3641 kJ/kg CO2 for coal and gas fired MEA solvent systems, respectively. Similar
to that, all the efficiency models show lower re-boiler duties for DEA processes. This is an agreement with the literatures, that Veawab et al. [15] reported that solvent regeneration energy is decreasing in the order MEA>DEA>MDEA. Reason behind that is, DEA has lower heat of reaction compared to MEA process. The overall re-boiler energy requirement mainly consists of three major parts. The energy
needed to liberate the CO2 from amines, heat required to increase the solvent temperature and energy
uses for water evaporation process. DEA has lower CO2 loading efficiency than MEA solvent, and that
will cause for a higher amount of solvent circulation rate. Even though DEA solvent circulation rate is higher compared to MEA process, DEA has less heat of reaction. Therefore, heat of reaction or heat
required to liberate the attached CO2 will dominate to have less re-boiler duty for all these cases.
When we consider about corrosions, Veawab [16] noted that corrosion takes place in almost every
section of the capture plant. The impact of corrosion depends mainly on few factors, including CO2
loading, amine type and concentration, temperature and degradation products [17]. The corrosivity of amines decrease in the order of MEA>AMP>DEA>MDEA [18]. Therefore, DEA is better compared to the MEA in the sense of that.
4. Conclusion
Using DEA will reduce the corrosive effect and required less amount of energy in the regeneration
process. The 85% removal model of DEA process has 3371 kJ/kg CO2 for coal fired system and 3381
kJ/kg CO2 for gas fired system. This is lower value compared to 3507 kJ/kg CO2 and 3641 kJ CO2 for
coal and gas fired MEA solvent systems, respectively. Similar to that, all the efficiency models show lower re-boiler duties for DEA processes. However, circulation rate is high in DEA model compared to MEA process because of low reactivity. That will cause for increasing operational cost. Typical
temperature profiles for liquid and vapour phase in the absorber model is analyzed together with CO2
loading profiles. Temperature profiles are important to understand since it shows the reaction behavior. The shape, value and the point of maximum temperature bulge depend upon where in the column the bulk of the acid gas is absorbed into lean solvent as well as heat of reactions, evaporation and amount of vapour and liquid flow rate. Finally, DEA can be recommended for coal and gas fired flue gas capture for removal efficiencies.
Nomenclature
K equilibrium constant for thermodynamic model R gas constant [J/mol K]
A, B, C, D constants k reaction rate coefficient
T temperature [K] j component name
References
[1] Gabrielsen J., Svendsen H.F., Michelsen M.L., Stenby E.H., Kontogeorgis G.M.
Experimental
validation of a rate-based model for CO2 capture using an AMP solution
. Chemical Engineering Science, 2007, Vol. 62, 2397-2413.[2] Bae H.K., Kim S.Y., Lee B. Simulation of CO2 removal in a split-flow gas sweetening process.
Korean J.Chem.Eng, 2011, Vol. 28 (3), 643-648.
[3] Wang R., Li D.F., Liang D.T.
Modeling of CO
2capture by three typical amine solutions in
hollow fiber membrane contactors
. Chemical Engineering and Processing, 2004, 43, 849-856.[4] Arachchige U.S.P.R., Aryal N., Melaaen M.C. Various amines’ effect on CO2 removal efficiency.
Proc. APCRE’11 chemical engineering symposium, Beijing, China, 2011.
[5] Alie C.F. CO2 Capture with MEA: Intergrating the Absorption Process and Steam Cycle of an
Existing Coal-Fired Power Plant. Master Thesis, University of Waterloo, Canada, 2004.
[6] Fluor for IEA GHG Program, Improvement in Power Generation with Post-Combustion Capture
of CO2. Final Report, Report Number PH4/33, November 2004.
[7] Pellegrini G., Strube R., Manfrida G. Comparative study of chemical absorbents in
postcombustion CO2capture. Energy, Vol. 35 (2), 851-857.
[8] Freguia S. Modeling of CO2 removal from Flue Gas with Mono-ethanolamine. Master Thesis,
University of Texas, USA, 2002.
[9] Aspen Plus. Rate Based model of the CO2 capture process by MEA using Aspen Plus. Aspen
Technology Inc, Cambridge, MA, USA, 2008.
[10] Aspen Plus. Aspen Physical Property Methods. Aspen Technology Inc, Cambridge, MA, USA,
2006, 61-63.
[11] Arachchige U.S.P.R., Muhammad M., Melaaen M.C. Optimization of post combustion carbon
capture process-solvent selection, submitted to Int. Journal of Energy and Environment, 2012.
[12] Arachchige U.S.P.R., Aryal N., Melaaen M.C. Case study for flue gas separation of a coal fired
power plant and parameters’ effect on removal efficiency, Proc. APCRE’11 chemical engineering symposium, Beijing, China, 2011.
[13] Mohammad A, PhD Thesis, University of Delft, Netherland, 2009.
[14] Kothandaraman A, PhD Thesis, Massachusetts Institute of Technology, USA, 2010.
[15] Veawab A., Tontiwachwuthikul P., Aroonwilas A., Chakma A, Performance and cost analysis for
CO2 capture from flue gas streams: absorption and regeneration aspects. Proceedings of the sixth international conference on green house gas control technologies: GHGT -6, Kyoto, Japan, 2003.
[16] Veawab A, Corrosion in CO2 capture unit for coal/fired power plant flue gas, Proceedings of the
sixth int. conference on green house gas control technologies: GHGT -6, Kyoto, Japan, 2003.
[17] Davidson R.M, Post combustion carbon capture from coal fired plants-solvent scrubbing, IEA
clean coal centre, United Kingdom, 2007.
[18] Veawab A., Tontiwachwuthikul P., Chakma A, Industrial and Engineering Chemistry Research,
1999, 38 (10), 3917.
Udara S.P.R. Arachchige received his B.Sc Degree (2007) in Chemical and Process Engineering from
University of Moratuwa, Sri Lanka and M.Sc degree (2010) in Energy and Environmental Engineering from Telemark University College, Porsgrunn, Norway. He is presently pursuing his Ph.D in Carbon dioxide capture from power plants- modeling and simulation studies at Telemark University College. He has presented and published five papers in International Conferences and 5 papers in international journals. Mr. Udara is a member of American Chemical Society.
E-mail address: [email protected]
Morten Chr. Melaaen is Professor in process technology at Telemark University College, Porsgrunn,