E
NERGY AND
E
NVIRONMENT
Volume 4, Issue 1, 2013 pp.39-48
Journal homepage: www.IJEE.IEEFoundation.org
Optimized CO2-flue gas separation model for a coal fired
power plant
Udara S. P. R. Arachchige
1, Muhammad Mohsin
1, Morten C. Melaaen
1,21
Telemark University College, Porsgrunn, Norway
.2
Tel-Tek, Porsgrunn, Norway
.Abstract
The detailed description of the CO2 removal process using mono-ethylamine (MEA) as a solvent for
coal-fired power plant is present in this paper. The rate based Electrolyte NRTL activity coefficient model was used in the Aspen Plus. The complete removal process with re-circulating solvent back to the absorber was implemented with the sequential modular method in Aspen Plus. The most significant cost related to CO2 capture is the energy requirement for re-generating solvent, i.e. re-boiler duty. Parameters’
effects on re-boiler duty were studied, resulting decreased re-boiler duty with the packing height and absorber packing diameter, absorber pressure, solvent temperature, stripper packing height and diameter. On the other hand, with the flue gas temperature, re-boiler duty is increased. The temperature profiles and CO2 loading profiles were used to check the model behavior.
Copyright © 2013 International Energy and Environment Foundation - All rights reserved.
Keywords: Carbon dioxide capture; Coal fired power plant; Parameters effect; Re-boiler duty.
1. Introduction
Due to the large number of fossil fuel based power plants, the bulk amount of CO2 is releasing to the
atmosphere. In order to maintain the atmospheric green house gases, mitigation technologies have to be developed. Post combustion capture technologies are the best and widely used method for CO2 recovery
process. CO2 capture by absorption and stripping process is currently considered as the most feasible
option for CO2 removal from fossil fuel fired power plants. The main drawback of this technology is
energy consumption and the capital cost. Post combustion CO2 capture technology with amine solvent is
a reactive system. Hence, mass transfer of CO2 from the bulk vapor to the liquid solvent and chemical
reactions between amine and flue gas are the main two phenomena to be considered.
In the chemical absorption, flue gas enters the absorber at the bottom whilst the solvent enters at the top. The reactions start between MEA and CO2 while flowing through the column (packing bed). An
un-reacted gas leaves the column at the top, while the CO2 rich solvent discharges at the bottom. The rich
operating cost is the energy requirement to run the carbon capture process. Therefore, it is necessary to perform research on this topic to reduce the operating cost and to improve the existing technologies to capture the CO2. This paper primarily focuses on developing the model for gas treating plant of CO2
from the coal-fired power plant flue gas and simulates the adaptable model to reduce the re-boiler duty.
2. Model development
A simulation of a 500MW coal-fired power plant flue gas is considered. The flue gas composition and inlet conditions are extracted from the literatures [1]. The comprehensive flow sheet is developed in Aspen Plus for three different CO2 removal models with 85, 90 and 95% efficiency.
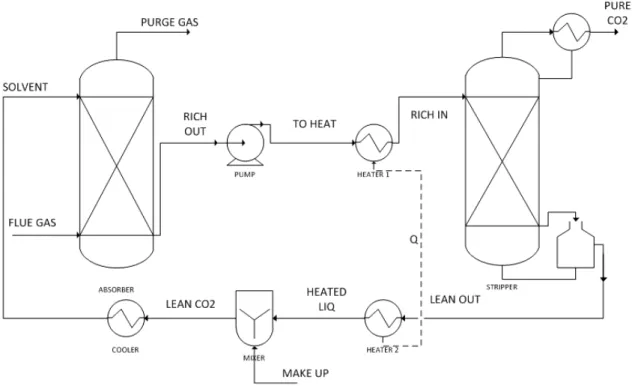
The suitable operating conditions are selected from previous studies, and sensitivity analysis is performed to check the validity of the parameters. A simplified flow sheet of the implemented model which employs CO2 capture by absorption/stripping with an aqueous amine solution is shown in Figure
1.
Figure 1. Process flow diagram
2.1 Operating conditions
The process flow diagram is developed to capture 85, 90 and 95% of CO2 from coal-fired power plant
flue gas. Absorber and stripper are the main two-unit operation blocks in the capture process. Inlet flue gas and solvent stream are supplied at 313K, and absorber is operating at 1bar absolute pressure. The rich solvent stream is heated up to 382K using a heat exchanger unit before sending it to stripper section for maximum performance. The stripper is operating at 2 bar absolute pressure and reflux ratio (fraction of the condensed is coming back to the stripper section) and distillate rate (flow rate of the PURE CO2 line) are used to implement the stripper unit. The inlet flue gas stream data are selected from Alie, 2004 [1] and tabulated in Table 1 and selected solvent conditions from simulation studies are given in Table 2. The main component in the pure gas stream of the stripper (PURE CO2 in Figure 1) is CO2, and the rest
of that is MEA and water. High temperature (393K) steam (produce in the re-boiler) is used to remove the CO2 from the solvent. Steam is produced in the re-boiler and main energy requirement in the process
is related to re-boiler duty. Therefore, the CO2 capture model is implemented to reduce the re-boiler duty
so that energy requirement can be minimized. The operating conditions of absorber and stripper section are tabulated in Table 3. Due to several reasons Aspen Plus Rad-Frac model is selected for absorber and stripper:
• It is the active unit operation model for vapour- liquid absorption and stripping section.
• The simulation time is faster for Rad-Frac column in comparison with other available options.
Table 1. Flue gas composition and parameters [1]
Parameter Coal Fired
Flow rate [kg/s] 673.4 Temperature [K] 313 Pressure [bar] 1.1 Major Composition Mol%
H2O 8.18
N2 72.86
CO2 13.58
O2 3.54
H2S 0.05
Table 2. Solvent stream parameters
Specification 85% Removal
Efficiency
90% Removal Efficiency
95% Removal Efficiency Coal fired power plant CO2 capture
MEA concentration [w/w%] 40 40 40
CO2 lean loading [mole CO2/mole MEA ] 0.27 0.27 0.25
Solvent flow rate [kg/s] 2212 2422 2483
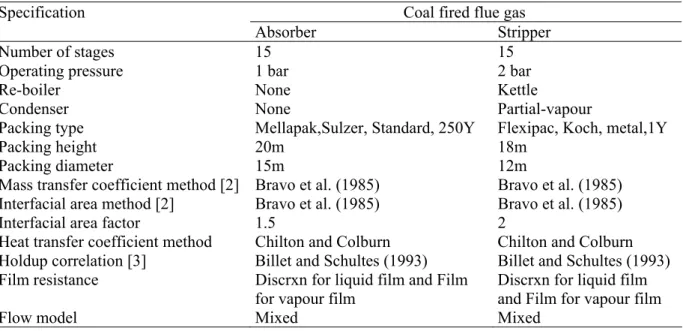
Table 3. Absorber and stripper column specifications
Coal fired flue gas Specification
Absorber Stripper
Number of stages 15 15
Operating pressure 1 bar 2 bar
Re-boiler None Kettle
Condenser None Partial-vapour
Packing type Mellapak,Sulzer, Standard, 250Y Flexipac, Koch, metal,1Y
Packing height 20m 18m
Packing diameter 15m 12m
Mass transfer coefficient method [2] Bravo et al. (1985) Bravo et al. (1985) Interfacial area method [2] Bravo et al. (1985) Bravo et al. (1985)
Interfacial area factor 1.5 2
Heat transfer coefficient method Chilton and Colburn Chilton and Colburn Holdup correlation [3] Billet and Schultes (1993) Billet and Schultes (1993) Film resistance Discrxn for liquid film and Film
for vapour film
Discrxn for liquid film and Film for vapour film
Flow model Mixed Mixed
Packed columns are used for the model development and the type of the packing is selected to get better operating conditions. The packing height, section diameter, packing factor and material are important factors and tabulated (Table 3). The number of stages is selected to obtain high accuracy. The input conditions and model specifications used for model development in the absorber, and stripper are shown in Table 3. The specifications are recommended for rate based model of the CO2 capture process by
Aspen Tech [4].
2.2 Property method selection
ELECNRTL - handle both very low and high concentrations of aqueous and mixed solvent systems. ENTRL-HF- similar to the ELECNRTL property method except that it uses the HF equation of state for vapor phase calculation model.
ENTRL-HG - similar to the ELECNRTL property method except it uses the Helgeson model for standard property calculations.
AMINES - this property method uses Kent-Eisenberg correlation for K-values and enthalpy calculation. Out of them, the ELECNRTL model is selected for the simulation of the CO2 capture process and
electrolyte wizard is used to develop the simulation kinetics and reactions. The ELECNRTL is the most versatile electrolyte property method as it can handle both very low and high concentrations of aqueous and mixed solvent systems. The solubility of gases can be modeled with Henry’s law and required coefficients are available in databanks. For the calculation of vapor phase properties, the Redlich-Kwong equation of state is used.
2.3 Thermodynamic behavior
The acid gases in the flue gas are weak acid electrolytes, and amines are weak organic base electrolytes. Combination of those two forms partially ionizes or partially dissociates aqueous solution in reacting system. The reacting system (1-7) can be expressed as dissociation of components as below [6].
Water:2H2O↔OH−+H3O+ (1)
Hydrogen-sulfide:H2O+H2S ↔HS−+H3O+ (2)
Hydrogen-bisulfide:H O+HS− ↔S −+H3O+
2
2 (3)
Carbon-dioxide:CO2+2H2O↔ HCO3−+H3O+ (4)
Bicarbonate:HCO3−+H2O↔ H3O++CO32− (5)
Protonated-alkanolamine:MEAH++H2O↔MEA+H3O+ (6)
Hydrolysis-reaction:MEACOO−+H2O↔MEA+HCO3− (7)
Equilibrium constants are required for each of the above equations to continue their vapour/liquid mole fraction calculations. It can be calculated by,
T
D
T
C
T
B
A
K
j=
j+
j+
jln
+
jln
(8)where Kj is representing equilibrium constant for thermodynamic model, T is temperature in (K), and
constants are given by Aj, Bj, Cj, and Dj. Equilibrium constant values are imported from the literature
sources [7] and tabulated in Table 4.
Table 4. Values of equilibrium constant equations [7]
Reaction number Aj Bj Cj Dj
Reaction 1 132.89 -13445.9 -22.47 0 Reaction 2 214.58 -12995.4 -33.55 0 Reaction 3 -9.74 -8585.47 0 0 Reaction 4 231.46 -12092.1 -36.78 0 Reaction 5 216.05 -12431.7 -35.48 0
It is important to understand the kinetics of the reactions. The reactions (4) and (7) are replaced by kinetic reactions (9), (10) and reverse reactions (11), (12) for rate model.
− − →
+ 3
2 OH HCO
CO (9)
+ −+
→ +
+CO H O MEACOO H O
MEA 2 2 3 (10)
− − → +
OH CO
HCO3 2 (11)
O H CO MEA O
H
MEACOO−+ 3 + → + 2+ 2 (12)
The kinetic expression is defined in Aspen Plus and given below in (13) with constant values. Parameters used in (13) are, rj rate of reaction, kj rate coefficient, T and T0 are operating and absolute temperatures
in (K), R is universal gas constant and E is activation energy.
⎥ ⎥ ⎦ ⎤ ⎢
⎢ ⎣ ⎡
⎟⎟ ⎠ ⎞ ⎜⎜
⎝ ⎛
− −
⎟⎟ ⎠ ⎞ ⎜⎜ ⎝ ⎛ =
0 j
n
0 j j
T 1 T
1 R E exp T
T k r
j
(8)
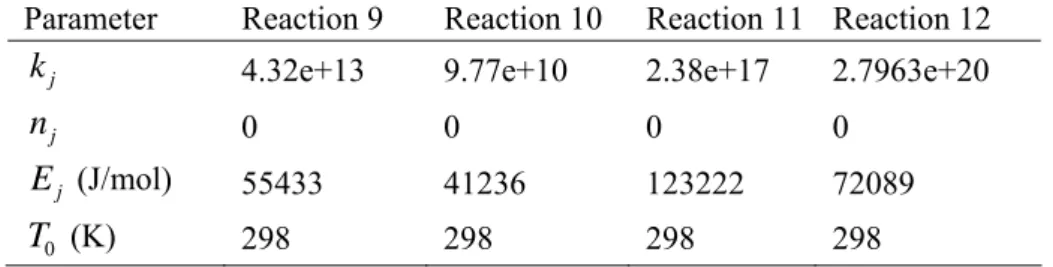
Table 5 presents the constant values taken for the simulation in Aspen Plus for kinetic calculation. The given values are extracted from the Aspen Plus available databanks and checked with literatures to confirm the accuracy.
Table 5. Rate constant values
Parameter Reaction 9 Reaction 10 Reaction 11 Reaction 12
j
k 4.32e+13 9.77e+10 2.38e+17 2.7963e+20
j
n 0 0 0 0
j
E (J/mol) 55433 41236 123222 72089
0
T
(K) 298 298 298 2982.4 Parameter selection
In the amine-H2S-CO2-H2O system, where the amine is MEA and eight ionic species
(OH−,H3O+,HS−,S2−,HCO3−,CO32−,
MEAH
+,MEACOO−) and four molecular species (H
2O
,
H
2S
,
CO
2,
MEA
) are present in the liquid phase. Therefore, pure component parameters, binary parameters as well as electrolyte parameters have to be introduced in order to implement the process model. If any of the parameters are missing, it can be estimated with molecular structure, or using regression with experimental data. The Aspen Plus physical property system contains built in parameters for the electrolyte NRTL model. The databank contains energy parameters and other electrolyte parameters for molecular-electrolyte and electrolyte-electrolyte systems.3. Results and discussion
3500 3520 3540 3560 3580 3600 3620
16 18 20 22 24 26 28
Re ‐ bo il e r du ty [k J/ k g CO 2 ]
Packing Height [m]
3400 3450 3500 3550 3600 3650 3700
12 14 16 18 20
Re ‐ b o ile r du ty [kJ /kg CO 2 ]
Packing Diameter [m]
(a) (b)
3550 3560 3570 3580
305 307 309 311 313 315 317
Re ‐ b o ile r dut y [k J/ k g CO 2 ]
Solvent Temperature [K]
3500 3520 3540 3560 3580 3600
0.9 1 1.1 1.2
Re ‐ b o ile r du ty [kJ /kg CO 2 ]
Absorber Pressure [bar]
(c) (d) 3500 3520 3540 3560 3580 3600
307 312 317
Re ‐ b o ile r dut y [kJ /k g CO 2 ]
Flue gas Temperature [K]
3550 3555 3560 3565
14 16 18 20 22
Re ‐ boi le r dut y [k J/ kg CO 2 ]
Packing Height [m]
(e) (f)
3556 3558 3560 3562
10 12 14 16 18
Re ‐ b o ile r dut y [k J/ k g CO 2 ]
Packing Diameter [m]
(g)
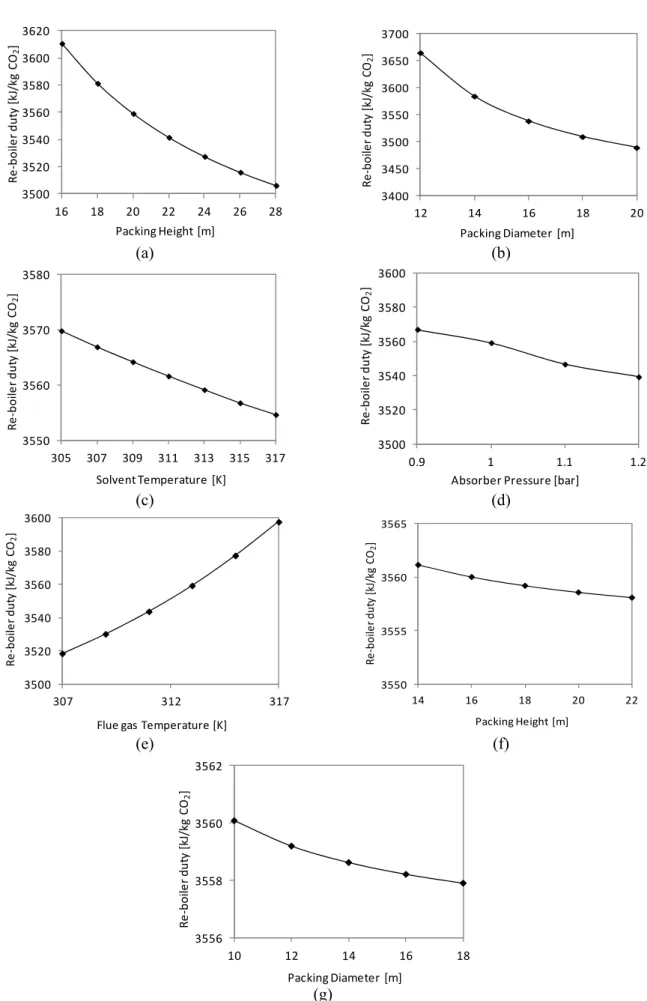
Figure 2. Re-boiler duty variation with model parameters; (a)absorber packing height, (b)absorber packing diameter, (c)solvent temperature, (d)absorber pressure, (e)flue gas temperature, (f)stripper
The re-boiler duty is decreasing with the increase of absorber packing height, packing diameter, absorber pressure, solvent temperature, stripper packing height, and packing diameter. The attained rich loading increased with the increase in the absorber packing height and packing diameter. Hence, required solvent flow rate is decreased and the amount of the liquid solvent process in the stripper is reduced. Therefore, the re-boiler duty to process unit mass of CO2 is reduced and the total energy requirement decreased.
Similarly, re-boiler duty decreased with the increase of absorber pressure due to higher CO2 removal
efficiency with high absorber operating pressure. Re-boiler duty decreased with the increase of solvent temperature. Reverse is applicable to flue gas temperature effect. The effect of stripper packing parameters on re-boiler duty is negligible.
The efficiency of the CO2 removal (85%, 90%, and 95%) is achieved with distillate rate (vapour stream
of the stripper outlet) variation in the stripper. However, before lean MEA stream recycled back to the absorber, rest of the CO2 (15%, 10%, and 5%) remained in the system has to be removed from the system
to get material balances. The CO2 removal amount in the purge gas stream is calculated. Exact amount of
remaining CO2 can be removed by adjusting the open-loop MEA inlet flow rate to the absorber. Amount
of MEA and H2O losses during the process are added to the make-up stream to balance the system and lean MEA stream is recycled back to the absorber (Table 6).
Table 6. Composition of make-up stream
Process Model Amount of make-up stream Removal Efficiency (mol %) Water (kg/s) MEA (kg/s)
85 42.41 0.41
90 37.85 0.38
95 29.52 0.36
Finally, the closed-loop CO2 removal process is considered for the re-boiler duty calculation and further
analyzing. Re-boiler duty is calculated as 3634.2, 3736.4, 4185.5 kJ/kg CO2 for the 85, 90 and 95% CO2
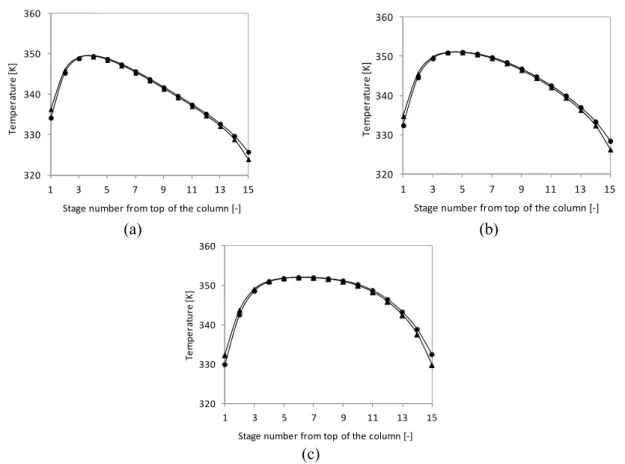
removal process for coal-fired power plant. Temperature profiles (Figure 3) as well as CO2 loading
profiles (Figure 4) are studied to understand the behavior of the absorber process.
320 330 340 350 360
1 3 5 7 9 11 13 15
Te
m
p
e
ratu
re
[K
]
Stage number from top of the column [‐]
320 330 340 350 360
1 3 5 7 9 11 13 15
Te
m
p
e
ra
tu
re
[K
]
Stage number from top of the column [‐]
(a) (b)
320 330 340 350 360
1 3 5 7 9 11 13 15
Te
mp
e
ra
tu
re
[K
]
Stage number from top of the column [‐] (c)
0.2 0.3 0.4 0.5
1 3 5 7 9 11 13 15
CO 2 loa d in g in th e liq u id ph a se [m o le CO 2 /m o le ME A ]
Stage number from top of the column [‐]
0.2 0.3 0.4 0.5
1 3 5 7 9 11 13 15
CO 2 lo a d in g in th e li qui d ph a se [m o le CO 2 /m o le ME A ]
Stage number from top of the column [‐]
(a) (b)
0.2 0.3 0.4 0.5
1 3 5 7 9 11 13 15
CO 2 loa d ing in th e liq u id ph a se [m ol e CO 2 /m o le ME A ]
Stage number from top of the column [‐] (c)
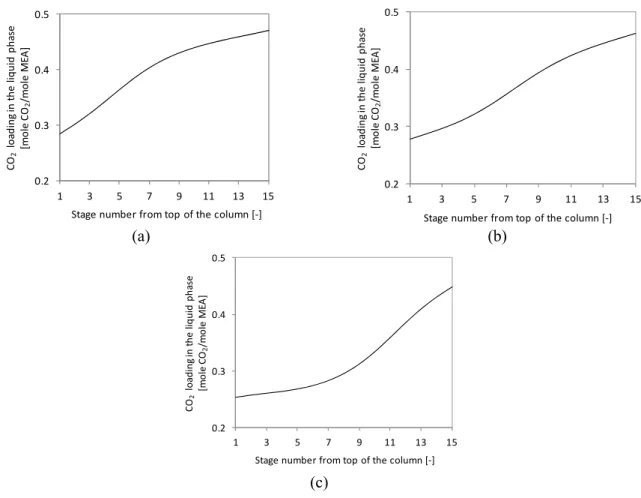
Figure 4.
CO
2loading profiles in absorber
for (a) 85%, (b) 90% and (c) 95% removal efficiencyThe absorber tends to exhibit a temperature bulge at the top of the column for both liquid and vapor phase. Temperature bulge is due to highly exothermic reactions at the top of the column. The maximum temperature is reached 350K for all three models. The CO2 loading is increasing alone the absorber and
rich loading is reached to 0.4-0.5 [mole CO2/mole MEA] for all three simulation models. The CO2 rich
loading is slightly decreasing with the increase of removal efficiency.
Highest
rich loading is obtained for 85% removal process.4. Conclusion
The implemented model is properly working and converging for coal fired flue gas system. Three different models were developed with 85-95% removal efficiency. The calculated re-boiler duties are 3634.2, 3736.4, 4185.5 kJ/kg CO2 for the 85, 90 and 95% CO2 removal process. Temperature profiles
and CO2 loading profiles are having similar patterns for all cases.
References
[1] Alie C.F. CO2 Capture with MEA: Intergrating the Absorption Process and Steam Cycle of an Existing Coal-Fired Power Plant. Master Thesis, University of Waterloo, Canada, 2004.
[2] Bravo J.L., Rocha J.A. and Fair J.R.. Mass Transfer in Gauze Packings. Hydrocarbon Processing, 1985 (January), 91–95.
[3] Billet R., Schultes M. Predicting Mass Transfer in Packed Columns. Chem. Eng. Technology, 1993,Vol. 16, 1-9.
[4] Aspen Plus. Aspen Physical Property Methods. Aspen Technology Inc, Cambridge, MA, USA, 2006, 61-63.
[5] Aspen Plus. Rate Based model of the CO2 capture process by MEA using Aspen Plus. Aspen Technology Inc, Cambridge, MA, USA, 2008.
[7] Freguia S. Modeling of CO2 removal from Flue Gas with Mono-ethanolamine. Master Thesis, University of Texas, USA, 2002.
Udara S.P.R. Arachchige received his B.Sc Degree (2007) in Chemical and Process Engineering from University of Moratuwa, Sri Lanka and M.Sc degree (2010) in Energy and Environmental Engineering from Telemark University College, Porsgrunn, Norway. He is presently pursuing his Ph.D in Carbon dioxide capture from power plants, modeling and simulation studies from Telemark University College, Porsgrunn, Norway. He has presented and published five paper in International Conferences. Mr. Udara is a member of American Chemical Society.
E-mail address: [email protected]
Muhammad Mohsin received his B.Sc Degree (2011) in Electrical Engineering and Automation from Shenyang University of Chemical Technology, Shenyang, China. He is presently pursuing his Master degree in System and Control Engineering in Telemark University College, Porsgrunn, Norway. He also working as a research Assistant in Technology department in same university college. Mr. Mohsin has research interest on carbon capture, modeling and simulation, control systems in process industries. E-mail address: [email protected]
Morten Chr. Melaaen is Professor in process technology at Telemark University College, Porsgrunn, Norway. He is also the Dean of Faculty of Technology, Telemark University College and has a part time position at the local research institute Tel-Tek. Earlier, he has worked as a research engineer in Division of Applied Thermodynamics, SINTEF, Norway and as an Associate professor at Norwegian University of Science and Technology (NTNU). He has worked on research projects as a Senior research scientist in Norsk Hydro Research Centre Porsgrunn, Norway. He started to work as a professor at Telemark University College in 1994 and became Head of Department, Department of Process, Energy and Environmental Technology in 2002. He received his MSc in Mechanical Engineer in 1986 and his Ph.D in 1990, both from the NTNU. His research interests are CO2 capture, Modeling
and simulation, Fluid mechanics and Heat and Mass Transfer. Professor Morten has more than 90 scientific papers published in the above mentioned related fields in international journals and conferences.
![Table 4. Values of equilibrium constant equations [7]](https://thumb-eu.123doks.com/thumbv2/123dok_br/18380336.356338/4.892.220.672.996.1164/table-values-of-equilibrium-constant-equations.webp)