www.hydrol-earth-syst-sci.net/15/3181/2011/ doi:10.5194/hess-15-3181-2011
© Author(s) 2011. CC Attribution 3.0 License.
Earth System
Sciences
From precipitation to groundwater baseflow in a native prairie
ecosystem: a regional study of the Konza LTER in the Flint Hills
of Kansas, USA
D. R. Steward1, X. Yang2, S. Y. Lauwo1,*, S. A. Staggenborg3, G. L. Macpherson4, and S. M. Welch3
1Kansas State University, Department of Civil Engineering, 2118 Fiedler Hall, Manhattan, Kansas, 66506-5000, USA 2Fudan University, Department of Environmental Science and Engineering, Shanghai, China
3Kansas State University, Department of Agronomy, 2004 Throckmorton Plant Sciences Center, Manhattan, Kansas, 66506-5506, USA
4University of Kansas, Department of Geology, 1475 Jayhawk Blvd, Room 120, Lawrence, Kansas, 66045-7594, USA Received: 17 March 2011 – Published in Hydrol. Earth Syst. Sci. Discuss.: 28 April 2011
Revised: 5 October 2011 – Accepted: 7 October 2011 – Published: 20 October 2011
Abstract. Methods are developed to study hydrologic
in-teractions across the surficial/groundwater interface in a na-tive prairie ecosystem. Surficial ecohydrologic processes are simulated with the USDA’s EPIC model using daily climate data from the Kansas Weather Data Library, vegetation and soil data from the USDA, and current land-use management practices. Results show that mean annual precipitation (from 1985–2005) is partitioned into 13 % runoff regionally and 14 % locally over the Konza LTER, lateral flow through soil is 1 % regionally and 2 % locally, groundwater recharge is 11 % regionally and 9 % locally, and evapotranspiration ac-counts for the remaining 75 %. The spatial distribution of recharge was used in a regional Modflow groundwater model that was calibrated to existing groundwater observations and field measurements gathered for this study, giving a hydraulic conductivity in the Flint Hills region of 1–2 m day−1 with a local zone (identified here) of 0.05–0.1 m day−1. The re-sistance was set to fixed representative values during model calibration of hydraulic conductivity, and simple log-log re-lations correlate the enhanced recharge beneath ephemeral upland streams and baseflow in perennial lowland streams to the unknown resistance of the streambeds. Enhanced recharge due to stream transmission loss (the difference be-tween terrestrial runoff and streamflow) represents a small fraction of streamflow in the ephemeral upland and the resis-tance of this streambed is 100 000 day. Long-term baseflow in the local Kings Creek watershed (2 % of the groundwater
Correspondence to:D. R. Steward ([email protected])
recharge over the watershed) is met when the resistance of the lowland streambed is 1000 day. The coupled framework developed here to study surficial ecohydrological processes using EPIC and groundwater hydrogeological processes us-ing Modflow provides a baseline hydrologic assessment and a computational platform for future investigations to exam-ine the impacts of climate change, vegetative cover, soils, and management practices on hydrologic forcings.
1 Introduction
Groundwater plays an important role in ecohydrological processes and interactions. Within terrestrial ecosystems, recharge to groundwater stores occurs from the portion of precipitation that does not either evapotranspire back to the atmosphere or runoff the land to surface water. Impor-tant hydrological interactions also occur across the surfi-cial/groundwater interface in stream channels. Transmission losses in ephemeral streams provide enhanced recharge to groundwater beneath the hyporheic zone. Groundwater pro-vides baseflow discharge to perennial streams, which is im-portant to aquatic ecosystems and riparian habitat (Hayashi and Rosenberry, 2002). This study addresses the need for theoretical frameworks to capture the complex interactions across hydrological processes and plant ecosystems (Porpo-rato and Rodrigues-Iturbe, 2002).
site in a proposed National Ecological Observatory Net-work (NEON). Konza is also NASA’s First ISLSCP (Inter-national Satellite Land Surface Climatology Project) Field Experiment (FIFE) to study land-atmosphere interactions. Positioned near the centroid of the continental USA, the study region may provide a bellweather for environmental change (Hayden, 1998, p.34) since changes in patterns of water availability from predicted climate change are likely to greatly impact tallgrass prairie ecosystems (Collins et al., 1998, p.311).
A number of previous investigations have studied hydro-logic processes at Konza. The data from remote sensing in FIFE and more recent studies have been used with field level weather measurements to study evapotranspiration at Konza (Famiglietti et al., 1992; Famiglietti and Wood, 1994, 1995; Gutowski Jr. et al., 2002; Brunsell et al., 2008). Famigli-etti et al. (1992) recommended for future models to incorpo-rate soil water storage and groundwater flow, and Gutowski Jr. et al. (2002) suggested that future models should take into account overland runoff. Dodds et al. (1996) studied the movement of surface runoff through stream channels and ob-served that one third of the hydrologic export flows directly through the stream while transmission losses account for the remaining which flows through shallow groundwater and the hyporheic zone and much of this eventually reimmerges from bank storage to groundwater. Macpherson (1996) showed that local groundwater mounds on the order of 1m or less form in stream banks in response to precipitation events dur-ing periods of low evapotranspiration. Paniconi and Wood (1993) modeled unsaturated flow in the upper 1m of the local Kings Creek watershed and Macpherson and Sophocleous (2004) concluded that there is little change in soil moisture below one meter depth with no apparent pulsed or wave-like water movement through the vadose zone and that flow through macropores is not significant at this site. York et al. (2002) developed a local groundwater model at the nearby Mill Creek and adopted this steady-state assumption.
This study provides a hydrologic assessment of the Konza LTER site that incorporates evapotranspiration, surficial runoff, recharge to groundwater through the vadose zone, and the interactions of groundwater and surface water. Surficial models are evaluated over 21 yr of weather data to quantify fluxes across the spatial characteristics of the landscape. The subsurface hydrology of Konza is studied within a regional model that incorporates the forcings and interactions of its setting. Estimates of mean annual recharge occurring across the region will be developed, as well as understanding of how the streams are influencing the water budget. The motivation of this study is to develop ecoforecasting tools capable of studying the impact of change with methods applicable to other biomes and geologic regions of the world.
2 Methods
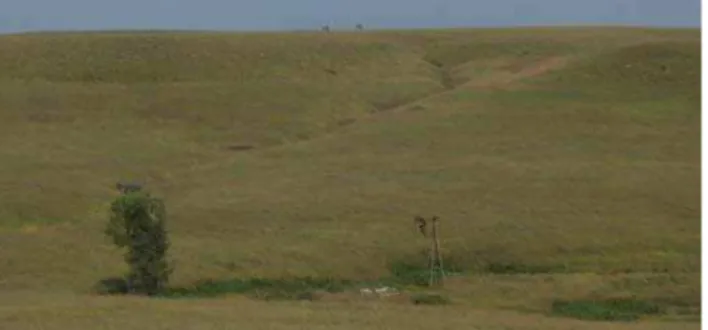
The landscape of the Konza region is illustrated in the pho-tographs in Fig. 1. Important variables and interactions used to describe the hydrology of this system are found in the conceptual overview in Fig. 1c. This section provides an overview of the study region and then presents the compu-tational methods.
2.1 Study region
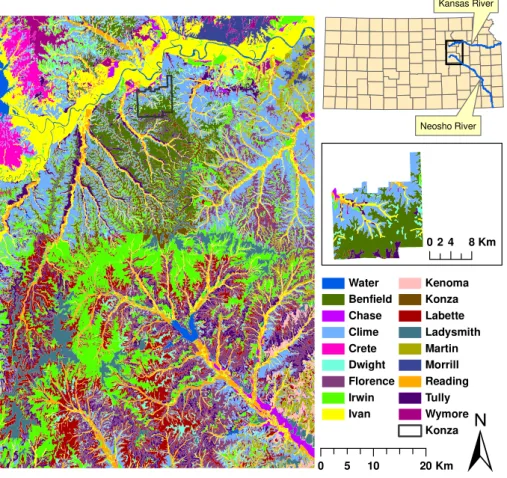
The study region encompasses the Konza Prairie LTER sta-tion with its mission to monitor and study the impacts of cli-mate, fire, and grazing on tallgrass prairies. Konza LTER contains 3487-ha of native tallgrass prairie located in the Flint Hills of northeastern Kansas (identified in Fig. 2). The landscape is a result of millions of years of exposure to weathering and stripping by the Kansas River’s tribu-taries (Oviatt, 1998) and the native prairie’s flora is dom-inated by the perennial warm-season grasses. Groundwa-ter recharge occurs through the Groundwa-terrestrial grasslands and en-hanced recharge occurs through ephemeral streambeds in the uplands (picture in Fig. 1b). This recharge reemerges to the surface through baseflow to perennial streams in the lowlands (picture in Fig. 1a).
Konza is located within a temperate climate with a mean annual precipitation of 0.789 m yr−1 over the period of study, with precipitation of 0.835 m yr−1 over all years of record with 75 % falling during the growing season and 0.052 m yr−1of liquid water falling as snow (Hayden, 1998). As is common to grassland ecosystems, precipitation varies considerably, and frequent droughts are characterized by persistent, hot, dry winds from the southwest. The soils in Fig. 2 are fine textured silt loams or silty clay loams. They are thin (formed in loess overlying Permian limestone and shale, in the uplands) to moderately deep and well-drained (formed in loess, re-worked loess, colluvium, or from bedrock residuum, in lowland depressions; Ransom et al., 1998). The 5166 km2 study region shown in Fig. 2 will be adopted to place the hydrology of the 34.9 km2Konza LTER into its regional setting.
(a)Perennial streams in the lowland prairie, with the Kansas River valley in the far distance to the left.
x
z
x
z
(b)Ephemeral streams in the upland prairie.
to the left.
x land surface
aquifer
vadose zone
groundwater precipitation (P)
head (h)
base (B) bedrock depth to water
x y z
streamflow (Q) runoff (Ro)
baseflow (qz)
ephemeral stream
perenial stream
enhanced recharge recharge (R)
evapotranspiration (ET)
lateral flow (L)
(c)Conceptual model and variables.
Fig. 1.Hydrologic processes and properties: precipitation either returns to the atmosphere through evapotranspiration, recharges groundwater in the aquifer, or contributes to streamflow through surface runoff. Groundwater recharge over the terrestrial prairie ecosystem and enhanced recharge beneath ephemeral streams in the uplands provides baseflow to perennial streams in the lowlands.
alluvium, colluvium and near channel fractured limestone and gradually release this storage to streamflow and hy-porheic flow through streambed gravels. Gauging stations on small ephemeral watersheds illustrate that the fraction of precipitation that flows within a stream channel varies con-siderably both spatially and temporally from less than 1 % to almost 40 % (Dodds et al., 1996).
A conceptual model of the hydrologic system and impor-tant surficial and groundwater properties are identified in Fig. 1c. A hydrologic water budget at the surface is pro-vided by precipitation equaling evapotransportation plus sur-face water runoff plus recharge to groundwater. A vegetation model is used to study these surficial processes and their vari-ability over climate and soil properties. The long-term hy-drogeological water budget is satisfied by recharge equaling baseflow from groundwater to streams and rivers. A ground-water model is used to study these subsurface processes and the occurrence of ephemeral and perennial streams.
The purpose of this study is not to quantify the sea-sonal and interannual forcings of bank storage and hyporheic flow, but to study long-term sustained fluxes through ground-water and baseflow to streams, and how the properties of streambeds control groundwater/surface water interactions. Long-term averages over 21 yr of simulation are used to sub-stantiate the role of groundwater in such surficial fluxes.
2.2 Ecohydrologic processes
Surficial hydrologic processes are studied using the USDA’s EPIC (Erosion Productivity Impact Calculator) model as documented by Sharpley and Williams (1990). Conservation of mass is expressed using the variables in Fig. 1 as
P = ET+Ro +R +L +1S (1)
where P is precipitation, ET is evapotranspiration, Ro is
runoff,R is the recharge rate, Lis lateral throughflow and interflow through soils, and1Sis short-term changes in stor-age in soil layers. While the EPIC model is executed on daily increments where the buffering of water in storage is impor-tant in properly partitioning fluxes, the changes in storage is negligible when computing long-term fluxes over the period of study, and
1S = 0. (2)
The evapotranspiration, runoff and recharge are all computed using the methods described below and lateral flow is com-puted to close the water balance in Eq. (1).
Water Benfield Chase Clime Crete Dwight Florence Irwin Ivan
Kenoma Konza Labette Ladysmith Martin Morrill Reading Tully Wymore Konza
Kansas River
Neosho River
0 5 10 20Km
±
024 8Km175
Fig. 2.Soils in the Konza study region.
to the underlying layer at soil water contents of field ca-pacity and higher and lateral flow is based upon percolation and field slope. Recharge to groundwater occurs from deep drainage below the root zone when the entire soil profile is at field capacity. Soil water content is estimated using the Ritchie method and is based on sand, silt, clay and organic matter percentages and bulk density (Sharpley and Williams, 1990).
EPIC has the options to use five different potential evap-otranspiration models and four different soil storage mech-anisms (Benson et al., 1992). The ET models include Har-greaves, Modified HarHar-greaves, Priestly-Taylor, Penman, and Penman Monteith. When compared with three other poten-tial soil storage and drainage methods, the Ritchie method resulted in the lowest soil water storage. However, despite the range of differences reported for potential evapotranspi-ration and soil water content methods, Benson et al. (1992) concluded that environmental inputs and weather data had a much greater influence on water use and drainage. The efficacy of the EPIC model to deal with water, drainage, weather and management practices is well documented by the 13 000 EPIC runs of 100 simulation years that were conducted across the entire USA for testing and application
to address the 1977 Resources Conservation Act (Williams, 1990).
The EPIC model was applied to each of the polygons in Fig. 2, which have uniform soil properties and soil slope. The surface area of these polygons are on the order of 1– 2 km2(or larger), a size that was considered by Famiglietti and Wood (1995) to be a REA (Representative Elementary Area) for the Kings Creek catchment basin on Konza. At spa-tial scales larger than the REA, models which use spaspa-tially averaged patterns of dominant processes (root zone moisture content, soil properties, vegetation, solar radiation) provide consistent results with fully spatially distributed simulations. This finding is consistent with Brunsell et al. (2008) who em-ployed remote sensing data at various scales and concluded that polygons on the order of 2 km are sufficient to character-ize the spatial characteristics of evapotranspiration observed in the Konza LTER region.
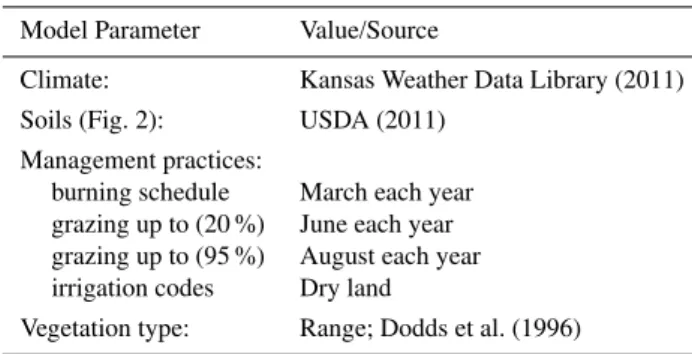
Table 1.Grassland prairie model parameters.
Model Parameter Value/Source
Climate: Kansas Weather Data Library (2011)
Soils (Fig. 2): USDA (2011)
Management practices:
burning schedule March each year
grazing up to (20 %) June each year grazing up to (95 %) August each year
irrigation codes Dry land
Vegetation type: Range; Dodds et al. (1996)
summarized annually and eventually averaged over the his-torical records to give long-term sustained rechargeRfor in-put to the groundwater model. While the daily time steps of EPIC may miss extreme runoff events for short duration precipitation events, the ability of EPIC to reproduce field measurements of mean annual runoff has been substantiated by Wang et al. (2006).
2.3 Hydrogeologic processes
A groundwater model is developed to study the movement of recharge through the aquifer system in Fig. 1 and its reemer-gence as surficial baseflow to streams and rivers. A mathe-matical description for steady two-dimensional groundwater flow with recharge is given by
∂ ∂x
k (h −B)∂h ∂x
+ ∂
∂y
k (h −B)∂h ∂y
= −R (3) wherehis the groundwater elevation andBis the elevation of the base of the aquifer. While the groundwater in this study flows through thin horizontal layers of alternating lime-stone and shale (Macpherson, 1996), the approach adopted for this regional study is to model the layered medium as an anisotropic medium wherekis the equivalent anisotropic hydraulic conductivity of the aquifer system (Bear, 1972, Sect. 5.8). While this assumption does not partition the hor-izontal components of specific discharge within individual layers, it does correctly reproduce the vertically integrated specific discharge across all layers, and such a one-layer model was previously adopted in the nearby Mill Creek wa-tershed by York et al. (2002).
The interaction between groundwater and surface water is modeled using Darcy’s Law
qz =
h −h∗
c , c =
D∗
k∗ (4)
whereqzis the vertical component of the specific discharge, cis the resistance of the streambed sediments, andh∗is the elevation of the surface water. The resistance is related to the depthD∗and hydraulic conductivityk∗of the streambed
Small Streams Large Rivers Konza
Zone With Low K Value Kansas Riverbed
Neosho Riverbed 0 4 8 16Km
±
Fig. 3.Streams, river channels, and low conductivity zone.sediments. The enhanced recharge beneath surface water to groundwater is obtained by integrating this specific discharge over the horizontal surface area (Haitjema et al., 2001)
Qer = Z L
0
w qzds (qz < 0) (5)
with width w and length L for stream reaches where the groundwater elevation is less than surface water, Likewise, baseflow from groundwater to surface occurs beneath stream reaches where the elevation of the groundwater is greater than the stream
Qbf = Z L
0
w qzds (qz ≥ 0). (6)
The groundwater flow equations are computationally im-plemented in Modflow (McDonald and Harbaugh, 1988). The governing Eq. (3) is solved using finite differences with cell sizes of 150 m and the model domain contains 400 columns by 574 rows of cells. The stream network is illustrated in Fig. 3 and was obtained from the USGS’s Na-tional Hydrography Dataset.
Fig. 4.Mean estimates for evapotranspiration, runoff, and recharge plus and minus one standard deviation for the soils of the study region.
of the model domain to be 20 m below land elevation, and the USGS’s DEM data is also used to specify the surface water elevation for streams and rivers. This boundary condition reproduces previous regional modeling results in an infinite domain (Yang et al., 2010), and the size of the model domain was chosen such that model predictions at Konza were not significantly changed by further enlarging the model domain. Surface water segments are classified as large rivers with low resistance levels (essentially setting groundwater eleva-tion equal to that of the surface water) or as small streams where the model was run over a range of possible values of resistance. Each cell in Modflow uses the average recharge rate obtained from the EPIC model results. A range of hy-draulic conductivity is specified and PEST is used to obtain the values that best matched a set of groundwater elevation measurements from observation wells about the Konza LTER region. The model results are exported to ArcMap and zonal statistics are used to compute the enhanced recharge Eq. (5) and baseflow Eq. (6) between groundwater and surface.
3 Results
Partitioning of surficial hydrologic fluxes was studied using the EPIC model. While the mean precipitation over the pe-riod of study (1985–2005) is 0.789 m yr−1there is great vari-ability in both the total yearly precipitation (between 0.452 m in 1988 and 1.292 m in 1993) and the timing of rainfall events. The surficial fluxes were evaluated over the histor-ical climate data for all soils in Fig. 2 and results were fur-ther classified by average soil slope as 0.1, 2, 6 or 10 % us-ing USDA (2011). Results are presented in Fig. 4 for the soils and slopes of the study region, showing the mean an-nual fluxes for evapotranspiration, runoff and recharge across the study period. Similar to a study of runoff and recharge by Batelaan and De Smedt (2007) in The Netherlands and Bel-gium, the temporal variability of each flux is indicated using error bars at plus and minus one standard deviation about the mean.
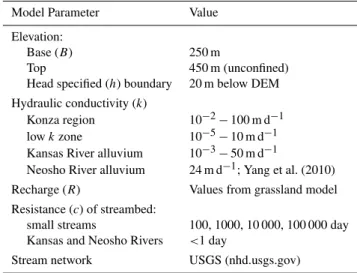
Table 2.Hydrogeology model parameters.
Model Parameter Value
Elevation:
Base (B) 250 m
Top 450 m (unconfined)
Head specified (h) boundary 20 m below DEM Hydraulic conductivity (k)
Konza region 10−2−100 m d−1 lowkzone 10−5−10 m d−1 Kansas River alluvium 10−3−50 m d−1
Neosho River alluvium 24 m d−1; Yang et al. (2010) Recharge (R) Values from grassland model Resistance (c) of streambed:
small streams 100, 1000, 10 000, 100 000 day Kansas and Neosho Rivers <1 day
Stream network USGS (nhd.usgs.gov)
It should be noted that the information provided by these results differs from previous investigations and yet are sub-stantiated in their findings. Famiglietti et al. (1992) and Famiglietti and Wood (1994) developed daily models of evapotranspiration that hypothesized the importances of soil water storage and established the size of REAs that were used here. Gutowski Jr. et al. (2002) developed hydrologic mod-els over a 9 yr period of simulation (1985–1994) that parti-tioned precipitation into evapotranspiration and groundwater recharge, and suggested that future models should include surface water runoff.
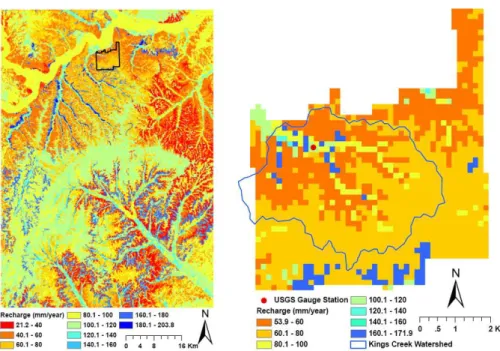
Fig. 5.Spatial distribution of recharge in the study region and at Konza LTER.
alluvial-colluvial deposits and are thicker with highest clay and rock fragment content in the lower part of the subsoil. Soils of the side slopes are thinner gravelly silty clays with the most common Konza soils being Benfield and Clime. Side slope soils of the region include Crete, Irwin, Kenoma, Martin, Morill, and Wymore. Soils of the interfluves and summit benches are Konza, Dwight, Florence and Labette with silty clay texture.
The results in Fig. 4 illustrate that mean evapotranspi-ration (ET) ranges across soils and slopes from 0.495– 0.627 m yr−1, with most soil/slope groups having mean val-ues within±1 standard deviation of the other soils. The ex-ception is Tully soil, which has the lowest evapotranspiration rate, and which is the only major soil group located on the foot slopes. The mean surface runoff (Ro) varies between
0.074–0.150 m yr−1 and consistently shows higher rates of runoff as the slope of the soil surfaces increases across a group with the same soil type. The mean rate of recharge (R) varies between 0.021–0.187 m yr−1and the error bar at 1 standard deviation falls below 0 m yr−1, which is consistent with results in Batelaan and De Smedt (2007) and indicates that a different statistical distribution such as log normal may better capture the variability of recharge across time. Re-sults indicate that higher rates of recharge (and higher vari-ability in standard deviation) occur for parcels with lower slopes. The spatial distribution of average recharge is il-lustrated in Fig. 5. For a given soil type, recharge is larger where the slope is relatively flat, which occurs at Konza in the river valley and foot slopes of Kings Creek and to the south on benches between terraces (see photos in Fig. 1a and b). Likewise, lower recharge rates occur when the soil slope is steeper, which occurs on the side slopes. These patterns that
exist at Konza are observed across the soil types and slopes in the region.
The average rates of evapotranspiration, runoff, and recharge were computed both for Konza and the regional study region by spatially averaging their values across the soil types and slopes. Results are presented in Table 3, where the percent area of each soil type/slope group was multiplied by these rates and then summed. When results are presented as fractions of precipitation, the results at Konza are ET/P= 74.6 %,Ro/P= 14.3 %,L/P= 2.2 %, and
R/P= 8.9 % and values for the region are ET/P = 74.7 %,
Ro/P= 13.3 %,L/P= 1.4 %, andR/P= 10.6 %. These
re-sults are consistent with the findings in Fig. 4 where less recharge occurs at Konza than the region since soils have steeper slopes, and evapotranspiration is fairly uniform be-tween Konza and the region.
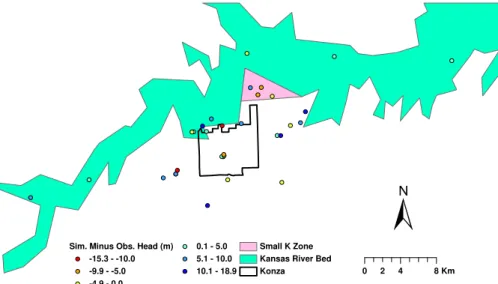
Subsurface groundwater flow and the interactions between groundwater and surface water in streams and rivers was studied using the Modflow model. A steady model was de-veloped to study long-term flow rates using the spatial distri-bution of average recharge from the terrestrial ecosystem in Fig. 5. The aquifer domain was subdivided into the alluvial plains associated with the Kansas and Neosho Rivers, and the limestone and shale units in the Flint Hills. A small zone is identified in Fig. 6 with a lower conductivity than the rest of the carbonate aquifer. This lower conductivity zone is re-quired for the model to accurately match the observed water level elevation in a set of wells.
Sim. Minus Obs. Head (m) -15.3 - -10.0 -9.9 - -5.0 -4.9 - 0.0
0.1 - 5.0 5.1 - 10.0 10.1 - 18.9
Small K Zone Kansas River Bed Konza
±
0 2 4 8Km
Fig. 6.Groundwater observation wells and differences between simulated and observed heads.
database, which contain wells periodically measured by the Kansas Geological Survey and the USGS. The location of twenty three wells are identified in the Kansas WWC5 water well completion records. Additionally, two more were iden-tified in Lauwo (2007) and two other wells on Konza were measured including the well beneath the windmill shown in Fig. 1b. These wells are largely screened in or connected to the Morrill Limestone unit studied by Macpherson (1996). The relatively large number of observation wells and their placement in both the Kansas River valley and the Flint Hills helps substantiate the findings of this study (e.g. only three observation wells in the Kansas River valley were used by York et al., 2002).
As discussed earlier, a range of values for the hydraulic conductivity were specified individually for the Kansas and Neosho River valleys, the Konza Flint Hills region, and the low hydraulic conductivity zone and PEST was used to find the three values that best satisfied the measured values in the observation wells. The values of resistance of the streambeds beneath the upland and lowland prairie streams was also un-known. For this study, a single value of resistance was spec-ified for all these streams that took on values of 100, 1000, 10 000, or 100 000 days and PEST calibration was performed for each of these four values. The actual value of resis-tance at Konza will be chosen later by matching the enhanced recharge (Eq. 5) in the ephemeral streams and the baseflow (Eq. 6) in the perennial streams.
The calibrated values of hydraulic conductivity for each scenario and the mean and root mean square error are presented in Table 4. These results are consistent with those presented by York et al. (2002) who used a value of
k= 2×10⁻⁵m s−1= 1.7 m day−1 for the nearby Mill Creek watershed and it was suggested that this value was too high (York et al., 2002, p.232). The groundwater elevation in Fig. 7 illustrate the mound that forms between the Kansas
and Neosho Rivers as well as the general southeast to north-west flow direction beneath Konza.
Note that the model results indicate that only small changes in conductivity and RMSE in Table 4 occur when the streambed resistance changes from 100 000/day to 10 000/day. As the streambed resistance takes on values of 1000/day to 100/day the surface water interactions through streambeds begin to noticeably change calibrated values of hydraulic conductivity.
The depth to groundwater was computed by subtracting the land elevation from the groundwater elevation and is il-lustrated in Fig. 8. Regionally, the depth to water illustrates recharge zones in the hills, discharge zones in the streams, and shallow depth to water in the floodplains and valleys of the Kansas and Neosho Rivers. These results provide a good match with field observations where baseflow be-comes established downriver from the gauging station (iden-tified in Fig. 5) which is dry most of the year (Dodds et al., 1996). These figures illustrate conditions when resistance is 100 000 days.
While the hydraulic conductivity of the aquifer clearly varies over possible values of streambed resistance in Ta-ble 4, the resistance also strongly influences the exchange of water between groundwater and surface water stores. This was quantified in the Kings Creek watershed by computing enhanced rechargeQerusing Eq. (5) beneath the portions of the watershed where depth to water was positive in Fig. 8, and by computing baseflow Qbf using Eq. (6) beneath the portions of the watershed where depth to water was nega-tive. The results are presented for each value of resistance in Fig. 9.
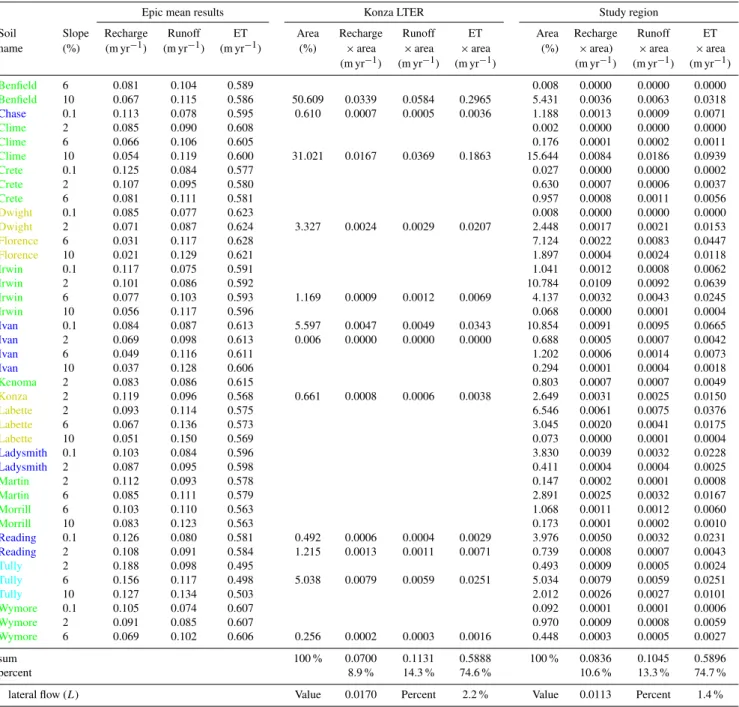
Table 3.Average recharge on Konza and the region by spatially averaging over theflood plains and terraces,foot slopes,side slopes, and benches and interfluves. Note that soil names are colored in the first column to help identify their position in the landscape.
Epic mean results Konza LTER Study region
Soil Slope Recharge Runoff ET Area Recharge Runoff ET Area Recharge Runoff ET
name (%) (m yr−1) (m yr−1) (m yr−1) (%) ×area ×area ×area (%) ×area) ×area ×area (m yr−1) (m yr−1) (m yr−1) (m yr−1) (m yr−1) (m yr−1)
Benfield 6 0.081 0.104 0.589 0.008 0.0000 0.0000 0.0000
Benfield 10 0.067 0.115 0.586 50.609 0.0339 0.0584 0.2965 5.431 0.0036 0.0063 0.0318
Chase 0.1 0.113 0.078 0.595 0.610 0.0007 0.0005 0.0036 1.188 0.0013 0.0009 0.0071
Clime 2 0.085 0.090 0.608 0.002 0.0000 0.0000 0.0000
Clime 6 0.066 0.106 0.605 0.176 0.0001 0.0002 0.0011
Clime 10 0.054 0.119 0.600 31.021 0.0167 0.0369 0.1863 15.644 0.0084 0.0186 0.0939
Crete 0.1 0.125 0.084 0.577 0.027 0.0000 0.0000 0.0002
Crete 2 0.107 0.095 0.580 0.630 0.0007 0.0006 0.0037
Crete 6 0.081 0.111 0.581 0.957 0.0008 0.0011 0.0056
Dwight 0.1 0.085 0.077 0.623 0.008 0.0000 0.0000 0.0000
Dwight 2 0.071 0.087 0.624 3.327 0.0024 0.0029 0.0207 2.448 0.0017 0.0021 0.0153
Florence 6 0.031 0.117 0.628 7.124 0.0022 0.0083 0.0447
Florence 10 0.021 0.129 0.621 1.897 0.0004 0.0024 0.0118
Irwin 0.1 0.117 0.075 0.591 1.041 0.0012 0.0008 0.0062
Irwin 2 0.101 0.086 0.592 10.784 0.0109 0.0092 0.0639
Irwin 6 0.077 0.103 0.593 1.169 0.0009 0.0012 0.0069 4.137 0.0032 0.0043 0.0245
Irwin 10 0.056 0.117 0.596 0.068 0.0000 0.0001 0.0004
Ivan 0.1 0.084 0.087 0.613 5.597 0.0047 0.0049 0.0343 10.854 0.0091 0.0095 0.0665
Ivan 2 0.069 0.098 0.613 0.006 0.0000 0.0000 0.0000 0.688 0.0005 0.0007 0.0042
Ivan 6 0.049 0.116 0.611 1.202 0.0006 0.0014 0.0073
Ivan 10 0.037 0.128 0.606 0.294 0.0001 0.0004 0.0018
Kenoma 2 0.083 0.086 0.615 0.803 0.0007 0.0007 0.0049
Konza 2 0.119 0.096 0.568 0.661 0.0008 0.0006 0.0038 2.649 0.0031 0.0025 0.0150
Labette 2 0.093 0.114 0.575 6.546 0.0061 0.0075 0.0376
Labette 6 0.067 0.136 0.573 3.045 0.0020 0.0041 0.0175
Labette 10 0.051 0.150 0.569 0.073 0.0000 0.0001 0.0004
Ladysmith 0.1 0.103 0.084 0.596 3.830 0.0039 0.0032 0.0228
Ladysmith 2 0.087 0.095 0.598 0.411 0.0004 0.0004 0.0025
Martin 2 0.112 0.093 0.578 0.147 0.0002 0.0001 0.0008
Martin 6 0.085 0.111 0.579 2.891 0.0025 0.0032 0.0167
Morrill 6 0.103 0.110 0.563 1.068 0.0011 0.0012 0.0060
Morrill 10 0.083 0.123 0.563 0.173 0.0001 0.0002 0.0010
Reading 0.1 0.126 0.080 0.581 0.492 0.0006 0.0004 0.0029 3.976 0.0050 0.0032 0.0231
Reading 2 0.108 0.091 0.584 1.215 0.0013 0.0011 0.0071 0.739 0.0008 0.0007 0.0043
Tully 2 0.188 0.098 0.495 0.493 0.0009 0.0005 0.0024
Tully 6 0.156 0.117 0.498 5.038 0.0079 0.0059 0.0251 5.034 0.0079 0.0059 0.0251
Tully 10 0.127 0.134 0.503 2.012 0.0026 0.0027 0.0101
Wymore 0.1 0.105 0.074 0.607 0.092 0.0001 0.0001 0.0006
Wymore 2 0.091 0.085 0.607 0.970 0.0009 0.0008 0.0059
Wymore 6 0.069 0.102 0.606 0.256 0.0002 0.0003 0.0016 0.448 0.0003 0.0005 0.0027
sum 100 % 0.0700 0.1131 0.5888 100 % 0.0836 0.1045 0.5896
percent 8.9 % 14.3 % 74.6 % 10.6 % 13.3 % 74.7 %
lateral flow (L) Value 0.0170 Percent 2.2 % Value 0.0113 Percent 1.4 %
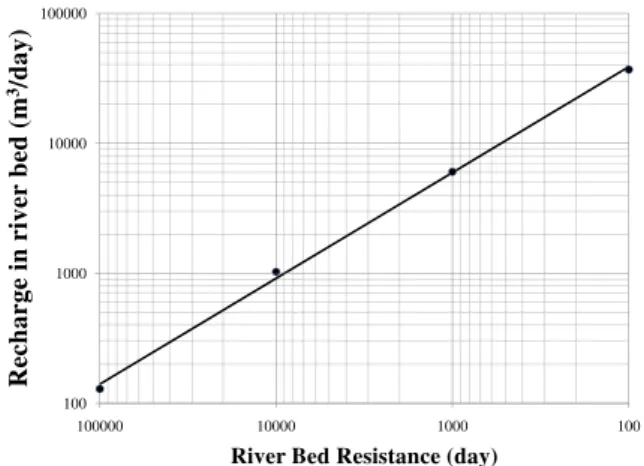
squares regression was applied to develop the best fit straight line, giving cumulative enhanced recharge in the ephemeral stream of the uplands
logQer = 6.217 −0.814 logc (7) and cumulative baseflow in perennial stream of the lowlands logQbf = 4.356 −0.895 logc. (8)
Note that the dots are plotted at the model results and the straight line is the best fit line from regression.
4 Discussion: water balance and geological properties
Head (m) 255.8 - 290 290.1 - 310 310.1 - 330
330.1 - 350 350.1 - 370 370.1 - 390 390.1 - 410
410.1 - 430 430.1 - 450
450.1 - 463.6
±
0 4 8 16Km
360 350
370
340
380
330
320
Head (m) 315.5 - 330 330.1 - 350 350.1 - 370 370.1 - 383
±
0 0.5 1 2Km
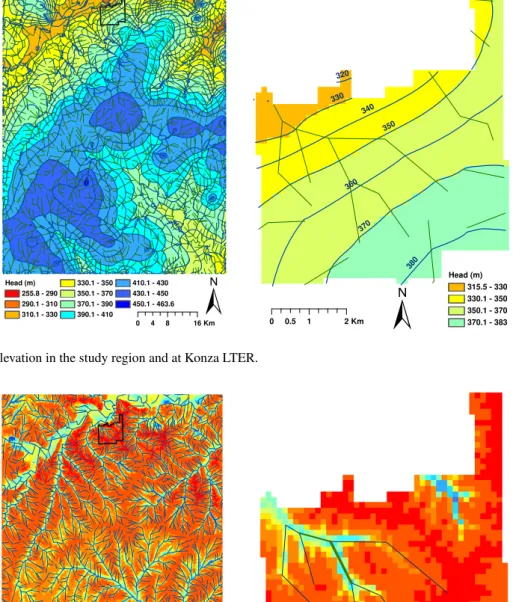
Fig. 7.Groundwater elevation in the study region and at Konza LTER.
Depth To Water Table (m) -28.3 - -20 -19.9 - -10 -9.9 - -8 -7.9 - -6 -5.9 - -4
-3.9 - -2 -1.9 - 0 0.1 - 2 2.1 - 4 4.1 - 6 6.1 - 8
8.1 - 10 10.1 - 20 20.1 - 50 50.1 - 112.9
±
0 5 10 20Km
Depth To Water Table (m) -9 - -8
-7.9 - -6 -5.9 - -4 -3.9 - -2
-1.9 - 0 0.1 - 2 2.1 - 4 4.1 - 6 6.1 - 8
8.1 - 10 10.1 - 20 20.1 - 50 50.1 - 76.2
±
0 0.5 1 2
Fig. 8.Depth to water in the study region and at Konza LTER.
preciptation becomes evapotranspiration at both Konza and the region. Spatial averages of runoff over the land surface plus lateral throughflow and interflow through the soils is between 14–17 % of precipitation with larger values occur-ing in the steeper slopes of Konza. Groundwater recharge is 9 % at Konza and 11 % regionally. These recharge rates are consistent with statewide predictions for Kansas by Hansen
Table 4.Groundwater parameter estimation.
Resistance kKonza kKansas River Lowkzone Mean error RMSE
(day) (m day−1) (m day−1) (m day−1) (m) (m)
100 000 0.69 3.91 0.049 2.44 8.24
10 000 0.82 4.04 0.054 2.45 7.98
1000 2.05 8.08 0.10 2.06 7.74
100 14.30 47.33 0.62 2.02 7.74
1000 10000 100000
in river
bed (m
3/day)
100 1000
100 1000
10000 100000
Recharge
River Bed Resistance (day)
s
s
(a)Cumulative recharge from ephemeral streams to groundwater in the uplands.
s
10 100 1000
seflow
(m
3/day)
0.1 1
100 1000
10000 100000
Ba
s
River Bed Resistance (day)
(b)Cumulative baseflow from groundwater to perennial streams in the lowlands.
Fig. 9. Groundwater and surface water interactions in the Kings Creek watershed and their dependence upon the streambed proper-ties.
would support better agreement between surface water and groundwater, which was done here.
Surface water fluxes may be computed for the 16.02 km2 Kings Creek watershed identified in Fig. 5, which largely lies inside the Konza LTER. The average discharge at the
USGS gauging station in this figure during 1985–2005 is 5430 m3day−1 (2.22 ft3s−1). This gauging station is dry throughout most of the year and baseflow occurs further downstream. The EPIC predictions of surface water runoff across the catchment is 4960 m3day−1 (16.02 km2×(1000 m km−1)2×0.1131 m yr−1×yr/365 day) and lateral flow through the soils contributes 750 m3day−1.
It appears that stream loss through enhanced recharge in the ephemeral streams is small and likely on the or-der of 100 s of m3day−1, given the input to streams is 4960 m3day−1of runoff plus a portion ofL= 750 m3day−1 and average stream discharge at the gauging station is
to the south which flows towards the Kansas River). Since baseflow is on the order of 50 m3day−1, the streambed resistance in the perennial lowlands is on the order of 1000 days in Fig. 9b. This resistance value is consistent with Macpherson and Sophocleous (2004) who measured local sediments in the Kings Creek floodplain to be 8–10 m thick with a hydraulic conductivity of 3×10⁻³m day−1, giving resistance of 2600–3300 days using Eq. (4). This suggests that the net enhanced recharge in the ephemeral stream reaches is on the same order as the net baseflow in ephemeral stream reaches. Results also suggest that future models may differentiate between the resistance controlling groundwater/surface water exchange in ephemeral (higher resistance) vs. perennial streams (lower resistance).
The geological properties of the aquifer in Table 4 may be inferred from the values of resistance found in the streambed channels. This gives values of hydraulic conductivity of
k= 1–2 m day−1on Konza,k= 0.05–0.1 m day−1in the low permeability zone, andk= 4–8 m day−1in the local Kansas River valley. It should be noted that the Kansas River is the only river that incises the Flint Hills from west to east; other rivers originate in the Flint Hills and flow either west or east. A possible geomorphological rationale for this may be that the mantle contains more highly erodible material in this por-tion of the Flint Hills. The lower conductivity zone identified in this study corresponds to a narrowing of the Kansas River valley and suggests the bedrock in the low-conductivity zone is more resistant to erosion than bedrock to the northeast or southwest. The resistant zone may have played a role in the more northerly location of historic channels of the Kansas River (Beck, 1961).
Model calibration was performed to determine the:
– Hydraulic conductivity of the three zones identified in Fig. 3, and
– resistance of streambeds such the model reproduced the:
– Observed groundwater elevations in Fig. 6,
– net discharge from surface water to groundwater through the ephemeral streambeds of the Kings Creek watershed in Eq. (5) and found to be on the order of 100 s of m3day−1from conservation of mass of surface waters, and
– net discharge of groundwater to surface water as base-flow in perennial streambeds of Kings Creek watershed in Eq. (6) and found to be on the order of 50 m3day−1 from field observation.
Our calibration method specifies the value of resistance to a set of representative values and then solves the model at each fixed value by letting PEST find the best values of hydraulic conductivity to match observation heads in Table 4. For each
of these simulations we then integrated enhanced recharge and baseflow, graphed the observed groundwater/surface wa-ter fluxes in Fig. 9, and picked off the values of resistance that best matched observed discharges. To our knowledge, this is the first time this approach has been used to establish resistance of streambeds.
5 Conclusions
This study examines hydrologic fluxes in an important LTER region covered by native prairie. A surficial model was em-ployed to partition long-term precipitation into surface wa-ter runoff, recharge to groundwawa-ter, and lawa-teral flow through soils. The groundwater recharge was incorporated with in-teractions across the groundwater/surface water interface in stream channels to study hydrologic processes. The specific computational tools employed here are the USDA’s EPIC model and the USGS’s Modflow model.
Surficial fluxes were computed for the soils identified in Fig. 2 over observed slopes of the land surface and results are presented in Fig. 4. The spatial distribution of average recharge is shown in Fig. 5 along with the location of the local Kings Creek watershed and a USGS gauging station. The spatial distribution of surficial fluxes are presented in Table 3 for Konza and the region. A groundwater model was calibrated using the observation wells in Fig. 6 and the stream network in Fig. 3. The resulting groundwater elevation and depth to water are illustrated in Figs. 7 and 8. While the resistance of the streambed channel sediments was unknown, the model was run over a range of possible values and the resulting aquifer properties are shown in Table 4. Relations were developed between resistance and enhanced recharge in the uplands in Eq. (7) and baseflow in the lowlands Eq. (8) and shown in Fig. 9.
This study extends previous investigations by fully partitioning precipitation into evapotranspiration, runoff, recharge, and lateral flow through soils in the Konza region. The resulting spatial distribution of recharge was incorpo-rated into a Modflow groundwater model, which was also suggested by previous investigations. The hydrologic water budget for this study substantiates the discharge of enhanced recharge beneath upland ephemeral streams as well as the baseflow contribution to lowland perennial streams. A new log-log relation between these fluxes and streambed resis-tance was developed here and used to quantify the properties of streambed sediments. This in turn enabled interpretation of the hydraulic conductivity of aquifer media based upon the streambed resistance.
and region and provides a framework to study the impacts of climatological and other forcings on the system.
Acknowledgements. The author gratefully acknowledges financial support provided by the National Science Foundation (grants EPS0553722 and GEO0909515), the United States Department of Agriculture/Agriculture Research Service (Cooperative Agreement 58-6209-3-018), and the Provost Office’s Targeted Excellence Program at Kansas State University.
Edited by: Y. Fan
References
Batelaan, O. and De Smedt, F.: GIS-based recharge estimation by coupling surface-subsurface water balances, J. Hydrol., 337, 337–355, 2007.
Bear, J.: Dynamics of fluids in porous media, Dover Publications, New York, 1972.
Beck, H. V.: A buried valley northwest of Manhattan, Kansas, in: Geological Survey Research, Professional Paper 424-D of Short papers in the geological and hydrologic sciences, articles 293– 435, D182–D185, USGS, 1961.
Benson, V. W., Potter, K. N., Bogusch, H. C., Goss, D., and Williams, J. R.: Nitrogen leaching sensitivity to evapotranspi-ration and soil water storage estimates in EPIC, J. Soil Water Conserv., 47, 334–337, 1992.
Brunsell, N. A., Ham, J. M., and Owensby, C. E.: Assessing the multi-resolution information content of remotely sensed vari-ables and elevation for evapotranspiration in a tall-grass prairie environment, Remote Sens. Environ., 112, 2977–2987, 2008. Collins, S. L., Knapp, A. K., Hartnett, D. C., and Briggs, J. M.: The
dynamics of tallgrass prairie synthesis and research opportuni-ties, in: Grassland Dynamics: Long-Term Ecological Research in Tallgrass Prairie, edited by: Knapp, A. K., Briggs, J. M., Hartnett, D. C., and Collins, S. L., Chapt. 17, Oxford University Press, 1998.
Dodds, W. K., Blair, J. M., Henebry, G. M., Koelliker, J. K., Ra-mundo, R., and Tate, C. M.: Nitrogen transport from tallgrass prairie watersheds, J. Environ. Qual., 25, 973–981, 1996. Famiglietti, J. S. and Wood, E. F.: Application of multiscale water
and energy balance models on a tallgrass prairie, Water Resour. Res., 30, 3079–3093, 1994.
Famiglietti, J. S. and Wood, E. F.: Effects of spatial variability and scale on areally averaged evapotranspiration, Water Resour. Res., 31, 699–712, 1995.
Famiglietti, J. S., Wood, E. F., Sivapalan, M., and Thongs, D. J.: A catchment scale water balance model for FIFE, J. Geophys. Res., 97, 18997–19007, 1992.
Gutowski Jr., W. J., V¨or¨osmarty, C. J., Person, M., ¨Otles, Z., Fekete, B., and York, J.: A coupled land-atmosphere simulation program (CLASP): Calibration and validation, J. Geophys. Res., 107, 1– 17, 2002.
Haitjema, H. M., Kelson, V., and de Lange, W.: Selecting Modflow cell sizes for accurate flow fields, Ground Water, 39, 931–938, 2001.
Hansen, C. V.: Estimates of Freshwater Storage and Potential Natu-ral Recharge for Principal Aquifers in Kansas, Water Resources Investigations 87-4230, US Geological Survey, 1991.
Hayashi, M. and Rosenberry, D. O.: Effects of ground water ex-change on the hydrology and ecology of surface water, Ground Water, 40, 309–316, 2002.
Hayden, B. P.: Regional climate and the distribution of tallgrass prairie, in: Grassland Dynamics: Long-Term Ecological Re-search in Tallgrass Prairie, edited by: Knapp, A. K., Briggs, J. M., Hartnett, D. C., and Collins, S. L., Chapt. 2, Oxford Uni-versity Press, 1998.
Jordan, P. R.: Streamflow transmission losses in western Kansas, J. Hydr. Eng. Div.-ASCE, 103, 905–919, 1977.
Kansas Weather Data Library: available at: http://www.ksre.ksu. edu/wdl/, last access: October 2011.
Lauwo, S. Y.: A modeling investigation of ground and surface water fluxes for Konza Tallgrass Prairie, Master’s thesis, Kansas State University, Department of Civil Engineering, 2007.
Macpherson, G. L.: Hydrogeology of thin limestones – the Konza Prairie LTER site, J. Hydrol., 186, 191–228, 1996.
Macpherson, G. L. and Sophocleous, M.: Fast ground-water mix-ing and basal recharge in an unconfined, alluvial aquifer, Konza LTER Site, Northern Kansas, J. Hydrol., 286, 271–299, 2004.
McDonald, M. G. and Harbaugh, A. W.: A modular
three-dimensional ground-water flow model, Techniques of Water-Resource Investigation 06-A1, USGS, US Government Printing Office, Washington, 1988.
Oviatt, C. G.: Geomorphology of the Konza Prairie, in: Grassland Dynamics: Long-Term Ecological Research in Tallgrass Prairie, edited by: Knapp, A. K., Briggs, J. M., Hartnett, D. C., and Collins, S. L., Chapt. 3, Oxford University Press, 1998. Paniconi, C. and Wood, E. F.: A detailed model for simulation of
catchment scale subsurface hydrologic processes, Water Resour. Res., 29, 1601–1620, 1993.
Porporato, A. and Rodrigues-Iturbe, I.: Ecohydrology – a chal-lenging multidisciplinary research perspective, Hydrolog. Sci. J., Journal des Sciences Hydrologiques, 47, 811–821, 2002. Ransom, M. D., Rice, C. W., Todd, T. C., and Wehmueller, W. A.:
Soils and soil biota, in: Grassland Dynamics: Long-Term Eco-logical Research in Tallgrass Prairie, edited by: Knapp, A. K., Briggs, J. M., Hartnett, D. C., and Collins, S. L., Chapt. 4, Ox-ford University Press, 1998.
Sharpley, A. N. and Williams, J. R.: EPIC Erosion/Productivity Im-pact Calculator, US Department of Agriculture Technical Bul-letin No. 1768, 235 pp., 1990.
Steward, D. R. and Ahring, T.: An analytic solution for groundwater uptake by phreatophytes spanning spatial scales from plant to field to regional, J. Eng. Math., 64, 85–103, doi:10.1007/s10665-008-9255-x, 2009.
USDA: Hydrologic soil-cover complexes, in: National Engineering Handbook, National Research Conservation Service, Washing-ton, DC, vol. Part 630 Hydrology, Chapt. 9, 9–1–14, 2004. USDA: Soil Survey Geographic (SSURGO) database, available at:
http://soildatamart.nrcs.usda.gov/, last access: October 2011. Wang, X., Harmel, R. D., Williams, J. R., and Harman, W. L.:
Eval-uation of EPIC for assessing crop yield, runoff, sediment and nutrient losses from watersheds with poultry litter fertilization, Trans. ASABE, 49, 47–59, 2006.
Williams, J. R.: The erosion-productivity impact calculator (EPIC) model: a case history, Philos. T. Roy. Soc. B, 329, 421–428, 1990.
Wood, H. K. and Macpherson, G. L.: Sources of Sr and implications for weathering of limestone under tallgrass prairie, northeastern Kansas, Appl. Geochem., 20, 2325–2342, 2005.
Yang, X., Steward, D. R., de Lange, W. J., Lauwo, S. Y., Chubb, R. M., and Bernard, E. A.: Data model for system conceptualiza-tion in groundwater studies, Int. J. Geogr. Inf. Sci., 24, 677–694, 2010.