Abstract— Protein structure prediction is the major goal to match up the count of known protein sequences and solved protein structures. Current template based modelling methodologies (TBM) rely on selection of structural folds or evolutionary related templates from already solved experimental structures. Even when the first predicted model conformation from correctly selected template(s) through any of the employed modelling algorithm is correct, the increased
model sampling seems ruining the initial model’s topology.
Increased sampling is not biased towards the correct near-native state for a target sequence. Model assessment measures employed during model sampling also pose a huge problem in the reliable selection of the most accurate decoy among the generated ones for a protein sequence. S uch persisting model sampling issues are thus carefully studied and streamlined to consistently yield highly accurate models for the majority of protein sequences. A TM and Z score guided sampling algorithm is designed to solve this problem in a logically efficient manner to make the predictions come closer to the actual native conformati on for a target sequence. Our sampling methodology yields an average GDT-HA, TM_S core improvement of 4.802 and 0.031 respectively for 21 CAS P8 TBM-HA targets (35 Domains), against their best predicted CAS P8 models, and thereby our models are found accurate not only for the individual domain(s) but also for the complete overall conformation of the target sequence.
Index Terms— Model S ampling, MODELLER, DOPE, TM_S core
I. INT RODUCT ION
ST RUCT URAL information encrypted in protein sequences provides a substantial amount of knowledge about a cell system. Structural mapping of available protein sequence universe (translated, sequenced or annotated) is thus vital for functional studies. Despite the development of structure determination methodologies, the count of experimentally
Manuscript received November 14, 2013; revised December 18, 2013.
A. Runthala is with the Department of Biological Sciences, Birla Institute of T echnology and Science, Pilani Campus, Pilani, 333031, INDIA (e-mail: ashishr@pilani.bits-pilani.ac.in).
S. Chowdhury is with the Department of Biological Sciences, Birla Institute of T echnology and Science, Pilani Campus, Pilani, 333031, INDIA (e-mail: shiba@pilani.bits-pilani.ac.in).
solved protein structures is significantly lower than the total number of availabe protein sequences and this sequence-structure gap is constantly increasing [1]. Computational prediction algorithms destined to bridge this ever-increasing gap, also comprise of several unavoidable problems including extremely large conformational space possible for a protein sequence, inefficiency of modelling algorithms to select reliable template(s) for a target sequence and perplexity of sampling algorithms. Computational structure prediction is thus a major challenge in structural biology.
Conventionally, the protein structure prediction methodologies are categorized into three classes as de-novo or ab-initio, threading and homology or comparative modelling. While the ab-initio methodology predicts a structure solely based on knowledge-based potentials, assuming that the protein structure is at the lowest energy conformation, the comparative modelling methodology predicts a protein model by using experimentally solved protein structures as templates. Between these two ends, the threading methodology exists and employs both these algorithms to construct a protein model. Currently, all protein structure prediction algorithms are grouped as FM (Free Modelling) encompassing ab-initio algorithms and TBM (Template Based Modelling) comprising of comparative modelling and threading algorithms, by CASP (Critical Assessment of Structure Prediction), the global blind test that assesses the modelling accuracy of prediction methodologies every two years [2]. Among these two broad categories, TBM is found to be practically reliable algorithm to yield highly accurate model conformations [3]-[4].
Template based modelling methodologies basically involves different steps including template search and selection, construction of target-template(s) alignment, model building, model sampling and assessment and model refinement. These steps are even repeated iteratively in some algorithms to generate a satisfactory model [5]. Each of these steps has been extensively studied to improve the protein modelling accuracy. Several algorithms including PSIPRED [6], Genthreader [7], COMA [8], and HHPred [9] have been developed to improve template search and selection. Similarly several tools and algorithms including MAFFT [10], MUSCLE [11] and PRALINE [12] are developed to improve target-template alignment accuracy. Modelling has been extensively improved through several algorithms like simulated annealing [13], Pro-SP3-TASSER [14], TITO [15]
Iterative Optimal TM_Score and Z_Score
Guided Sampling Significantly
Improves Model Topology
and MODELLER [16]. The model assessment step is improved to a great extent with the development of several knowledge based scoring functions like TM_Score [17] and 3DJury [18]. These assessment measures are normally used after model sampling for the considered target sequence [19]-[20]. Model sampling constructs hundreds and thousands of models for a target sequence and then selects the best model conformation through different assessment measures [4]-[5]. These sampling methodologies iteratively perturb the first template based model topology for the specified number of iterations and attempts to screen the best possible conformational space available for a target sequence for predicting the most reliable conformation [21]. Despite these careful efforts, modelling algorithms do not consistently predict reliable models due to algorithmic and logical problems existing in the modelling steps. Even if the correct template along with an accurate alignment is considered, the modelling accuracy can decrease if the accurate model is not carefully selected from the pool of sampled decoys. Thus, Model sampling and assessment is considered to be one of the important steps to construct highly accurate models.
II. INCREASED SAMPLING AND MODEL ASSESSMENT Conventional increased sampling step aims to relieve the energetically unstable and erroneous atomic contacts that are normally present in a modelled conformation. The models, even constructed through pretty reliable template(s), often include some physically unreliable structures, with energetically unacceptable and non-physical localized atomic clashes. Model assessment is thus used after increased sampling to select the reliable conformation with an improved model topology, probably being closer to the actual native conformation.
Several model assessment measures are usually employed for selecting the most accurate conformation. Such scoring measures normally include MOLPDF (MOLecular Probability Density Function), DOPE (Discrete Optimized Protein Energy), Z_Score and GA341 [22]-[23]. These measures are the normally employed scores in MODELLER, a tool used to model a protein sequence on the basis of distance maps extracted from the alignment file information for the target-template aligned residue pairs. Several other measures including TM_Score, RMSD to employed template(s) or the actual experimentally solved structure (if it exists) are also normally employed. TM_Score computes a score between 0 and 1, on basis of distance deviation between the equivalent pair of Cα coordinates, and also the count of such residues.
Recently developed GDT (Global Displacement Test) score as GDT-TS (Total Score) and GDT-HA (High Accuracy) are also being regularly employed to assess the models. GDT-TS, GDT-HA along with maxcluster tools are based on Maxsub and TM_Score measures , which compute local as well as global structural similarity of two protein structures through a sequence guided optimal structural superimposition [24]-[25]. The employed GDT score is calculated as the average percentage of model Cα residues within a specific distance deviation to the corresponding
residues of the experimental structure in sequence guided structural superimposition. GDT-TS score calculation considers the distance deviations of 1, 2, 4 and 8Å between the equivalent residues to calculate the average percentage of topologically correct model residues. In comparison to GDT_TS, GDT-HA measure is fairly more stringent measure to efficiently discriminate the models with close GDT-TS scores, as it considers the lower distance deviations of 0.5, 1, 2 and 4Å for the calculation of an overall average score. However, the Maxsub score does not penalize the over-prediction or it does not penalize the residue pairs that are incorrectly superimposed and is thus not considered [9].
Even after employing all these sampling and assessment measures, modelling algorithms do not consistently predict highly accurate models for most of the target sequences. This is not only due to inefficient model sampling algorithms, but it is also the result of incompetence of assessment measures. Most of these measures are only good at discriminating extremely bad and correct models. However, these measures do not guarantee an improved model topology on increased sampling, compared to the first constructed model. More importantly, these measures do not unanimously score a single model as the accurate conformation and show a great non-linearity among themselves. These measures do not unanimously justify a single model as the relatively better conformation.
Selection of a reliable model conformation is considered to be tricky and thus several researchers do not prefer to generate large number of models as the chance of selecting a wrong model also increases proportionally with the number of generated decoys. Here we try to employ the best assessment measure(s) along with the increased model sampling to improve the accuracy of model predictions.
We attempted the conventional sampling methodology in a different way. We have divided the normally employed, single long sampling step into several short samplings in which each sampling step employs the best scoring previously sampled model for further searching the available conformational space of the considered target sequence. We sorted out the reliable assessment scores and streamlined them in an iterative algorithm to exploit their consensus scoring criteria to select a reliable model conformation after the increased sampling. Correct and more reliable assessment measure guided iterative model sampling improve the sampling accuracy and construct highly accurate model conformation. We find that our sampling strategy produces considerably improved model topology, compared to the first constructed model from the selected template(s) for the considered target sequences.
III. METHODOLOGY
A. Model Assessment and Selection Strategy
The following Model assessment and selection strategy is developed to choose the best model structure. The target sequence is used to model 100 decoy structures through MODELLER. The constructed model with the highest TM_Score is then employed to construct another 100 models. The top 10 models with the highest TM_Scores are then scored through normally employed assessment measures, like MOLPDF, DOPE, GA341 and Z_Score, to study the correlation of these measures in reliably discriminating two pretty close models. The correlation of these different scoring measures is then scrutinized through these top 10 models. The consensus scoring set of assessment measures is fixed together into a single scoring strategy to score and select the highly accurate model.
B. Model Sampling Strategy
Contrary to traditional single long sampling, we employed an iterative model sampling strategy. Initially 1000 models were generated for the target sequence. The top 10 models with the highest TM_Score were then sorted out. Among these models, the one with the lowest Z-score was selected for further iteration. The combination of TM_Score and Z-score criteria for selecting best model was adopted after evaluating the pereformance of other scoring schemes like MOLPDF, DOPE and GA341 in reliably discriminating two pretty close models. The selected model was then used as a template to construct another set of 1000 models. Such 1000 model sampling runs were iteratively employed, each time starting with the best model of the current sampling. Such iterative sampling runs were employed until the convergence was attained for the selected assessment measures for at-least 3 sampling runs. Optimally sampled and consensus model with the highest TM_Score and lowest Z_Score was then selected as the best predicted conformation. To compare our results with the normally employed single sampling run, an equivalent number of protein models are constructed through a single long sampling run.
IV. RESULTS A. Model Assessment and Selection
It has been observed that there is a chaotic roaming of different model assessment measures during the model sampling and it becomes difficult to select the most accurate sampled conformation from the generated decoy structures. The assessment scores do not unanimously justify a single model as the actually most reliable prediction.
Evaluating all the assessment measures viz. TM_Score, MOLPDF, DOPE, GA341 and Z_Score for the short 100 model sampling run, we observed too much crinkling deviations in all scoring measures. Thus, selecting a reliable model among the generated decoys becomes a tricky exercise. Therefore to make it simpler, we screened the scoring measures which consistently rank and select the most accurate model(s). We observed that TM_Score [26] worked best during selection of the utmost reliable model.
We thus selected TM_Score measure as our preliminary model evaluation criterion. The other assesment scores of the top 10 TM_Score models among 100 model sampling run are listed under the 5 column headings viz. TM_Score, MOLPDF, DOPE,GA341 and Z_Score in Table I.
MOLPDF and GA341 scoring seems to be ineffective as MOLPDF shows too much crinkling deviations across these models. As per Table I, GA341 score does not differentiate among close and structurally correct, near-native models. So, their reliability seems to be doubtful. Models with high GA341score are good models but it fails to discriminate between closely related good models. It is thus effective in efficiently discriminating between good and bad model. Similarly from Table I, MOLPDF score and TM_Score do not correlate with each other.
Quite interestingly, the Z_Score shows a reliable undulation curl, with minimal deviations to the TM_Score measure across these 10 models. Normal DOPE score or energetic assessment on the other hand is quite unreliable. As enlisted in Table I, the energetic assessment is best for Model54, but its TM_Score is not the highest among the models. Hence DOPE parameter becomes ineffective while selecting the highly accurate and reliable model. On the other hand, the Z_Score reliably discriminates two models with same TM_Score. To make the assessment measure more robust and effective in selection of the best model conformation, we employed the TM_Score and Z_Score together. Here for each model sampling, we sorted the top 5 models with highest TM_Score and then finally selected the one with the lowest Z_Score and we found this assessment
set to be very effective. B. Model Sampling
During model sampling, we iteratively generated one thousand samples with the help of MODELLER and selected the best model on the basis of TM_Score and Z_Score. This iterative sampling was continued until the employed scoring measures got saturated for a minimum of 3 sampling runs.
It took altogether 12 sampling runs in our iterative sampling strategy. The assessment scores of each selected high scoring and intermittent sampling conformation is enlisted in Table II. Here, the best sampled model screened
T ABLEI
ASSESSMENT DETAILS MOLPDF,DOPE, GA341 AND Z_SCORE FOR
THE TOP 10 MODELS WITH HIGHEST T M_SCORE.
#
TM_ SCORE
MOL
PDF DOPE
GA 341
Z_ SCORE
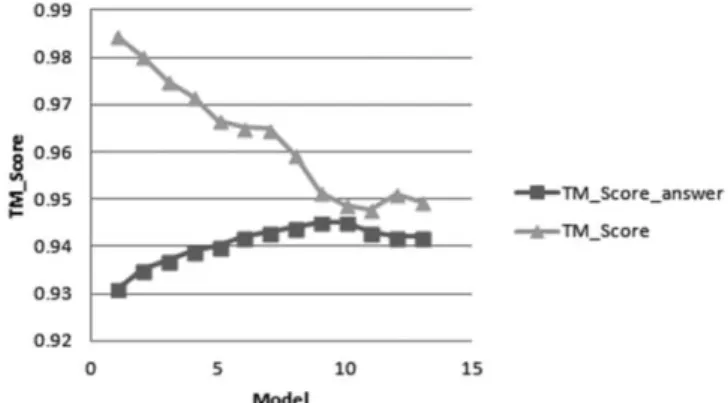
through TM_Score and Z_Score in each iterative run along with the first model and the finally predicted model have been scored as per the CASP defined domain boundary information [28]. These models have been assessed both against the actual native structure of the target sequence and the employed template. The TM_Score of model computed against the solved structure has been normalized by 126 residues (Assessed Domain Length) and is termed as TM_Score_answer. The TM_Score normalized by Template length (138 residues) is referred as TM_Score.
This iterative sampling strategy yields a model with GDT_TS, GDT_HA, TM_Score and RMSD score of 93.548, 82.863, 0.945 and 0.919 respectively, as highlighted with bold characters in Table II. In comparison to our iterative sampling result, a single long increased sampling of 12000 models (equivalent to our set of iterative sampling models) produced interesting results. TM_Score of the top model is marginally improved from TM_Score of first constructed model (0.933 vs 0.931). Similarly, GDT-TS score of top and first model remains same and it implies that single long sampling technique does not impove the structure quality.
V. DISCUSSION A. Model Assessment and Selection
The MOLPDF and DOPE scoring functions show significant distinctive undulations as observed in Table I. They do not rank the best model simultaneously and are not
correlated with the TM_Score ranking. GA341 score is also completely ineffective in selecting the best model. These scoring functions are thus inefficient in clearly discriminating the structurally close and similar near-native conformations. More importantly, for a correct model assessment, we must be extremely careful about the accurate overall topology of the model. Hence the scoring measures which can discriminate an accurate topology from the decoy set should be considered as the better ones. Our results show that the TM_Score based ranking of decoy structures is the most reliable measure that satisfies this preliminary constraint and is thus vital in selection of an accurate model. Z_Score on the other hand is significantly better than the normal DOPE or energetic evaluation score, as the models with lowest Z_Score show significantly higher TM_Score. It is important to understand here that we have used only these measures to score our model predictions because when the experimental structure of the considered target sequence is not available, we cannot use other scoring measures like GDT-TS, GDT-HA and RMSD.
B. Model Sampling
Increased sampling improves the model quality and accuracy compared to the first built conformation for a target sequence, only when it is carefully employed and assessed. In comparison to our iterative sampling results, the single long sampling yielded the best TM_Score model of 0.933. In this single sampling, the GDT-TS score of the best TM_Score model (91.129) is only improved marginally over the initial GDT-TS Score of 90.026. Hence, if the best model is correctly selected, the GDT-TS score is improved by 1.106 T ABLEII
CORRECT ASSESSMENT GUIDED ITERATIVE SAMPLING RESULTS ENLISTING THE EVALUATED SCORES OF THE CONSIDERED
ASSESSMENT MEASURES FOR THE TOP MODEL FOR EACH OF 12 ITERATIVE SAMPLING RUNS ALONG WITH THE BEST
PREDICTED MODEL OF CASP8 AND BEST MODEL OF THE SINGLE LONG SAMPLING.
Model Assessment against the template [27,
28]
Z_Score Assessment against the solved structure[28]
GDT-TS GDT-HA TM_Score_
answer
RMSD_ Answer
First Model 0.98439 0.370 90.726 77.621 0.931 1.075
1 0.98032 0.504 90.726 76.613 0.937 1.014
2 0.97501 0.571 91.935 78.427 0.937 0.990
3 0.97155 0.509 92.137 79.234 0.939 0.979
4 0.96655 0.493 92.137 80.040 0.940 0.961
5 0.96518 0.505 92.137 80.847 0.942 0.949
6 0.96482 0.496 92.742 81.250 0.943 0.933
7 0.9594 0.481 92.540 81.452 0.944 0.918
8 0.95139 0.477 92.742 82.056 0.945 0.902
9 0.94876 0.467 93.548 82.863 0.945 0.919
10 0.9478 0.546 92.944 81.250 0.943 0.943
11 0.951 0.568 93.347 80.645 0.942 0.942
12 0.94936 0.566 92.742 79.839 0.942 0.952
Best model of the Single long
sampling
0.98159 0.376 91.129 78.226 0.933 0.988
Best CASP8 Model
after sampling of 12000 models. On the other hand our proposed iterative sampling reliably predicts the near-native target conformation with GDT-TS, GDT-HA, TM_Score and RMSD scores of 93.548, 82.863, 0.945 and 0.919 respectively (Table II). In comparison with our predicted model, the corresponding scores for the best CASP8 Model are 90.726, 78.831, 0.929 and 0.990 respectively.
The normally employed sampling measures do not keep a track of the sampling path to improve the accuracy of model prediction towards the near-native conformation. Despite this lacuna, it is often muddled up in some wrong local minima prevailing in an energetic landscape. So if a wrong topology is incurred during the sampling, it is sequentially maintained until the very end and so if we could track the
path through correct reliable assessment measures, we would be logically sampling the protein conformation on the correct path. We realize that employing a correct reliable set of assessment measures together consistently predicts more accurate conformation for a protein sequence.
Our sampling methodology improves the model by 2.822 GDT_TS score in comparison to the first constructed model. The TM and Z score guided iterative sampling methodology yields better model topology than the conventional single sampling run for the considered target sequence. This iterative sampling methodology push the model structure towards close and correct near-native conformation of the target sequence. Quite interestingly, GDT-TS improvement rate per model is almost negligible in the conventional model sampling run. However, in our methodology the model accuracy is improved quite significantly.
As shown in Fig. 1, TM_Score of the model against chosen template marginally decreases in every successive iteration but its structural topology, as harnessed from the template and the alignment file, still remains intact. It indicates that all these models still have the same count of the topologically correct modelled Cα residues within 5Å distance deviation against the template. Hence attaining the almost similar structural decoys with almost equivalent TM_Score for at-least 3 successive and iterative sampling runs implies the saturation of TM_Score measure during the sampling. It further implies that our sampling strategy optimally constructs the model with exactly the similar topology harnessed from template(s), but simultaneously, the model is also not exactly like template(s), as TM_Score decreases every successive iteration (Fig. 1). Quite
interestingly, as represented in Fig. 2, our sampling predicts a more accurate near-native conformation. It is because the TM_Score_answer increases every successive iteration. Here in Fig. 2(b), the RMSD_answer decreases every successive iteration, i.e. the modelling slowly leaps towards the actual native conformation and is not biased towards the template. Hence, the model, where the TM_Score and Z_Score remain constant during the iterative sampling strategy with no further significant TM_Score alterations, seems to be the best sampled model and should thus be selected reliably. It is observed that Z_Score gives the best approximation in almost every single modelling case and when employed with TM_Score, its resultant assessment power substantially increases to reliably distinguish between good and bad models. Single increased sampling with no switching and selection of the better intermediary conformations does not improve model quality which was demonstrated by data inTable II.
This assessment and sampling strategy was applied to 21 CASP8 TBM-HA targets (T0388, T0390, T0396, T0398, T0400, T0402, T0404, T0418, T0422, T0423, T0426, T0428, T0432, T0435, T0438, T0442, T0444, T0447, T0458, T0470, T0499) with total 35 domains. In comparison to average GDT-TS and TM_Score of 87.269, 0.911 for the best CASP8 models, we generated models with average GDT-TS and TM_Score of 91.570 and 0.942 respectively. Hence our models show a significant improvement of 4.802 GDT-HA score and 0.031 TM_Score. Moreover our single models are better than the best CASP8 models of different participants for each of the assessed domain(s). Thus our sampling strategy energetically relaxes the model very well to relieve its non-physical atomic clashes, significantly faster than the conventional sampling algorithms.
Fig. 1. T M_Score and T M_Score_answer delineating the correct converging nature of our model sampling methodology
Fig. 2(a). GDT -T S, GDT -HA assessment results of the iterative optimal model sampling run.
Hence our sampling strategy is considerably better than the normal single long sampling to predict highly accurate models. This sampling strategy efficiently bypasses several intermittent saddle points to predict an improved model conformation [29]-[30]. However, we still need more efficient energy functions to reliably screen the correctly modelled conformations and for their sampling, we also need an improved sampling algorithm that is extremely competent at tackling the extremely large conformational space of target sequence. Development of an efficient model clustering method may further enhance accuracy of model predictions.
VI. CONCLUSION
The TM_Score and Z_Score guided sampling measure significantly improves the sampling accuracy of predicted protein models. The predicted model conformation was found to be accurate for overall structure and individual structural domains of the target sequences. Our sampling cum assessment strategy substantially improves the accuracy of predicted models, when compared to the first constructed model through the employed template(s).
ACKNOWLEDGMENT
The authors would like to thank the Birla Institute of Technology and Science, Pilani for providing computational resources and extending financial assistance.
REFERENCES
[1] H. M. Berman, J. Westbrook, Z. Feng, G. Gilliland, T . N. Bhat , H. Weissig et al., "T he Protein Data Bank," Nucleic Acids Research, vol. 28, no. 1, pp. 235-242, 2000.
[2] J. Moult, "A decade of CASP: progress, bottlenecks and prognosis in protein structure prediction," Current Opinion in Structural Biology, vol. 15, pp. 285–289, 2005.
[3] A. Sali, "100,000 protein structures for the biologist," Nature Structural Biology, vol. 5, pp. 1029-1032, 1998.
[4] A. Runthala and S. Chowdhury, (2013, April) Protein Structure Prediction: Are we there yet?," Knowledge Based Systems in Biomedicine and Computational Life Science, Springer Studies in Computational Intelligence, Volume 450. Available:
http://link.springer.com/chapter/10.1007%2F978-3-642-33015-5_4
[5] A. Runthala, "Protein Structure Prediction: Challenging targets for CASP10," Journal of Biom olecular Structure and Dynam ics, vol. 30, no. 5, pp. 607-615, 2012.
[6] D. T . Jones, "Protein secondary structure prediction based on position-specific scoring matrices," Journal of Molecular Biology, vol. 292, pp. 195–202, 1999.
[7] A. Lobley, M. I. Sadowski and D. T . Jones, "pGenT HREADER and pDomT HREADER: new methods for improved protein fold recognition and superfamily discrimination," BIOINFORMATICS, vol. 25, pp. 1761-1767, 2009.
[8] M. Margelevičius and C. Venclovas, "Detection of distant evolutionary relationships between protein families using theory of sequence profile-profile comparisons," BMC Bioinform atics, vol. 11:89, 2010.
[9] J. Söding, "Protein homology detection by HMM-HMM comparison," BIOINFORMATICS, vol. 21, pp. 951-960, 2005. [10] K. Katoh, K. Kuma, H. T oh and T . Miyata, "MAFFT version 5:
improvement in accuracy of multiple sequence alignment," Nucleic Acids Research, vol. 33, pp. 511-518, 2005.
[11]R. C. Edgar, "MUSCLE: multiple sequence alignment with high accuracy and high throughput," Nucleic Acids Research, vol. 32, pp. 1792-1797, 2004.
[12]W. Pirovano, K. A.Feenstra and J. Heringa, "PRALINE™: a strategy for improved multiple alignment of transmembrane proteins," BIOINFORMATICS, vol. 24, no. 4, pp. 492-497, 2007.
[13] K. T . Simons, C. Kooperberg, E. Huang and D. Baker, "Assembly of protein tertiary structure from fragments with similar local sequences using simulated annealing and Bayesian scoring functions," Journal of Molecular Biology, vol. 268, pp. 209-225, 2000.
[14] H. Zhou and J. Skolnick, "Protein structure prediction by pro-sp3-T ASSER," Biophysical Journal, vol. 96, pp. 2119-2127, 2009.
[15] G. Labesse and J. P. Mornon,. "Incremental threading optimization (T IT O) to help alignment and modelling of remote homologues," BIOINFORMATICS, vol. 14, pp. 206-350, 1998. [16] A. Sali and T . L. Blundel, "Comparative protein modeling by
satisfaction of spatial restraints," Journal of Molecular Biology, vol. 234, pp. 779-815, 1993.
[17]Y. Zhang and J. Skolnick, "A scoring function for the automated assessment of protein structure template quality," PROTEINS: Structure, Function, and BIOINFORMATICS, vol. 57, pp. 702--710, 2004.
[18] K. Ginalski, A. Elofsson, D. Fischer and L. Rychlewski, "3D-jury: a simple approach to improve protein structure predictions," BIOINFORMATICS, vol. 19, pp. 1015-1018, 2003.
[19] H. Joo, X. Qu, R. Swanson, C. M. McCallum and J. T sai, "Fine grained sampling of residue characteristics using molecular dynamics simulation," Com putational Biology and Chem istry, vol. 34, pp. 172-183, 2010.
[20]S. T rojanowski, A. Rutkowska and A. Kolinski, "T RACER. A new approach to comparative modeling that combines threading with free-space conformational sampling," Acta Biochim ica Polonica, vol. 57, no. 1, pp. 125-133, 2010.
[21] M. T opf. , M. L. Baker, M. A. Marti-Renom, W. Chiu and A. Sali, "Refinement of Protein Structures by Iterative Comparative Modelling and CryoEM Density Fitting," Journal of Molecular Modelling, vol. 357, no. 5, pp. 1655–1668, 2006.
[22] F. Melo,R. Sa´nchez and A. Sali, "Statistical potentials for fold assessment," Protein Science, vol. 11, pp. 430–448, 2002. [23]B. John and A. Sali, "Comparative protein structure modeling by
iterative alignment, model building and model assessment," Nucleic Acids Research, vol. 31, no. 14, pp. 3982-3992, 2003. [24]N. Siew, A. Elofsson, L. Rychlewski and D. Fischer, "MaxSub: an
automated measure for the assessment of protein structure prediction quality," BIOINFORMATICS, vol. 16, no. 9, pp. 776-785, 2000.
[25]Y. Zhang and J. Skolnick, "Scoring Function for Automated Assessment of Protein Structure T emplate Quality," PROTEINS: Structure, Function, and BIOINFORMATICS, vol. 57, no. 4, pp. 702–710, 2004.
[26] Ruslan I. Sadreyev, ShuoYong Shi, David Baker and Nick V. Grishin, " Structure similarity measure with penalty for close non-equivalent residues", BIOINFORMATICS, vol. 25, no. 10, pp. 1259-1263, 2009.
[27]Y. Zhang and J. Skolnick, "T M-align: a protein structure alignment algorithm based on the T M-score" Nucleic Acids Research, vol. 33, pp. 2302-2309, 2005.
[28]Michael L. T ress, Iakes Ezkurdia, Jane S. Richardson, "T arget domain definition and classification in CASP8," PROTEINS: Structure, Function, and BIOINFORMATICS, vol. 77, no. S9, pp. 10–17, 2009.
[29] B. Fain and M. Levitt, "Funnel sculpting for in silico assembly of secondary structure elements of proteins," Proceedings of the National Academ y of Sciences USA, vol. 100, no. 19, pp. 10700-10705, 2003.
[30]K.I. Okazaki, N. Koga, S. T akada, J. N. Onuchic and P. G.Wolynes, "Multiple-basin energy landscapes for large-amplitude conformational motions of proteins: Structure-based molecular dynamics simulations," Proceedings of the National Academ y of Sciences USA, vol. 103, no. 32, pp. 11844–11849, 2006.
Date of modification: February 26th, 2014