ApiAP2 Factors as Candidate Regulators of
Stochastic Commitment to Merozoite
Production in
Theileria annulata
Marta Pieszko1, William Weir1, Ian Goodhead2, Jane Kinnaird1, Brian Shiels1*
1Institute of Biodiversity Animal Health and Comparative Medicine, College of Medical, Veterinary and Life Sciences, University of Glasgow, Bearsden Road, Glasgow, United Kingdom,2Institute of Integrative Biology, University of Liverpool, Crown Street, Liverpool, United Kingdom
Abstract
Background
Differentiation of one life-cycle stage to the next is critical for survival and transmission of apicomplexan parasites. A number of studies have shown that stage differentiation is a sto-chastic process and is associated with a point that commits the cell to a change over in the pattern of gene expression. Studies on differentiation to merozoite production (merogony) in T. annulata postulated that commitment involves a concentration threshold of DNA bind-ing proteins and an auto-regulatory loop.
Principal Findings
In this study ApiAP2 DNA binding proteins that show changes in expression level during merogony of T. annulata have been identified. DNA motifs bound by orthologous domains in Plasmodium were found to be enriched in upstream regions of stage-regulated T. annu-lata genes and validated as targets for the T. annuannu-lata AP2 domains by electrophoretic mobility shift assay (EMSA). Two findings were of particular note: the gene in T. annulata encoding the orthologue of the ApiAP2 domain in the AP2-G factor that commits Plasmo-dium to gametocyte production, has an expression profile indicating involvement in trans-mission of T. annulata to the tick vector; genes encoding related domains that bind, or are predicted to bind, sequence motifs of the type 5'-(A)CACAC(A) are implicated in differential regulation of gene expression, with one gene (TA11145) likely to be preferentially up-regu-lated via auto-regulation as the cell progresses to merogony.
Conclusions
We postulate that the Theileria factor possessing the AP2 domain orthologous to that of Plasmodium AP2-G may regulate gametocytogenesis in a similar manner to AP2-G. In addition, paralogous ApiAP2 factors that recognise 5'-(A)CACAC(A) type motifs could oper-ate in a competitive manner to promote reversible progression towards the point that com-mits the cell to undergo merogony. Factors possessing AP2 domains that bind (or are OPEN ACCESS
Citation:Pieszko M, Weir W, Goodhead I, Kinnaird J, Shiels B (2015) ApiAP2 Factors as Candidate Regulators of Stochastic Commitment to Merozoite Production inTheileria annulata. PLoS Negl Trop Dis 9(8): e0003933. doi:10.1371/journal.pntd.0003933
Editor:Rhoel Ramos Dinglasan, Johns Hopkins Bloomberg School of Public Health, UNITED STATES
Received:February 20, 2015
Accepted:June 25, 2015
Published:August 14, 2015
Copyright:© 2015 Pieszko et al. This is an open access article distributed under the terms of the
Creative Commons Attribution License, which permits unrestricted use, distribution, and reproduction in any medium, provided the original author and source are credited.
Data Availability Statement:All microarray data files are available from the Gene Expression Omnibus (GEO) database, accession number GSE71307.
Funding:The work was supported by grant awards from the Wellcome Trust (http://wellcome.ac.uk/) grant number WT075820 and the EU (http://europa. eu/): POSTICK ITN (Post-graduate training network for capacity building to control ticks and tick-borne diseases) FP7- PEOPLE–ITN program (Grant No.
predicted to bind) this motif are present in the vector-borne genera Theileria, Babesia and Plasmodium, and other Apicomplexa; leading to the proposal that the mechanisms that con-trol stage differentiation will show a degree of conservation.
Author Summary
The ability of vector-borne Apicomplexan parasites (Babesia,PlasmodiumandTheileria)
to change from one life-cycle stage to the next is critical for establishment of infection and
transmission to new hosts. Stage differentiation steps of bothPlasmodiumandTheileria
are known to involve stochastic transition through an intermediate form to a point that commits the cell to generate the next stage in the life-cycle. In this study we have identified
genes encoding ApiAP2 DNA binding proteins inTheileria annulatathat are differentially
expressed during differentiation from the macroschizont stage, through merozoite pro-duction (merogony) to the piroplasm stage. The results provide evidence that the ApiAp2
factor inTheileriathat possesses the orthologue of thePlasmodiumAP2-G domain may
also operate to regulate gametocytogenesis, and that progression to merogony is promoted by the ability of a merozoite DNA binding protein to preferentially up-regulate its own production. In addition, identification of multiple ApiAP2 DNA binding domains that bind related motifs within and across vector-borne Apicomplexan genera lead to the pro-posal that the mechanisms that promote the transition from asexual to sexual replication will show a degree of conservation.
Introduction
The process of differentiation from one stage to the next is critical for survival, propagation and transmission of parasites within the phylum Apicomplexa. Differentiation steps can be conserved across genera. For example, generation of merozoites from an intracellular schizont, and the formation of gametocytes via merozoites that are committed for the sexual phase of the life-cycle, are events common to different members of the phylum. Moreover, differentiation steps across the Apicomplexa show a number of similarities indicating that the mechanisms involved are likely to have a degree of conservation. Apicomplexan stage differentiation events can occur in a stochastic manner (i.e. are asynchronous, with the probability of a differentiation step occurring influenced by culture/growth conditions and cell lineage) and are induced by
multiple distinct stimuli [1,2]. In addition, work onPlasmodiumandTheileriadifferentiation
systems has provided evidence for an intermediate position, with progression towards or rever-sal from a point that commits the cell to generate the next life-cycle stage [3,4]. Drugs or condi-tions that alter the probability of a differentiation event occurring are likely to operate by altering the ability of a cell to reach a commitment threshold [5], and it can be hypothesised that the probability of switching from repeated rounds of asexual proliferation to the next phase of the life-cycle is governed by stage-determining commitment circuits that compete against each other, as identified in higher eukaryotic cell systems [6].
Candidates for Apicomplexan factors that control the switch in gene expression following a commitment to differentiate include members of the ApiAP2 gene family. ApiAP2 proteins
were initially identified in the Apicomplexan generaCryptosporidium,Plasmodiumand
Thei-leria[7], and have been subsequently identified in all Apicomplexan genomes analysed to date. All ApiAP2s possess an Apetala (AP2) domain of approximately 60 amino acids, originally
data collection and analysis, decision to publish, or preparation of the manuscript.
identified as the DNA binding domain of transcription factors (TFs) that control
developmen-tal and stress-regulated gene expression in plants [8]. Work initially performed inPlasmodium
has shown that ApiAP2s can bind to specific nucleotide motifs in the upstream regions of stage-regulated genes and are required to control their differential expression [9,10]. In
addi-tion, recent studies onToxoplasma gondiihave demonstrated the involvement of ApiAP2
fac-tors in the regulation of the transition from the tachyzoite stage to the bradyzoite encysted stage [11,12] and they have also been shown to operate in commitment to gametocytogenesis inPlasmodium[13,14]. Identification of AP2 binding sites coupled with enrichment analysis of binding sites in stage-regulated genes has allowed prediction of networks that operate to con-trol expression of ApiAP2 genes and their associated targets during the Intra-erythrocytic
Developmental Cycle (IDC) ofP.falciparum[9]. Moreover, the prediction that ApiAP2s
regu-late their own expression indicates they could operate in the stochastic model of stage
differen-tiation previously proposed forTheileria[4].
Theileriais a tick-borne Apicomplexan parasite responsible for an economically important disease syndrome that threatens hundreds of millions of ruminants over large areas of the Old World. Currently, drugs are used as part of disease control strategies but emerging resistance against the most commonly used drug, buparvaquone, indicates that novel therapeutics will be required [15]. Based on the observation that the infection and treatment method of vaccination
againstT.parvaoperates by delaying differentiation to the intracellular macroschizont stage,
targeting stage differentiation can be considered as a control strategy [5]. Previous work onT.
annulataestablished anin vitrosystem of stage differentiation from the proliferating multi-nucleated macroschizont to production of the uni-multi-nucleated merozoite (merogony). Analysis of this system established that differentiation is stochastic and that the probability of merogony occurring could be increased by inhibition of DNA synthesis, while inhibition of protein syn-thesis reduced the potential to reach commitment [16]. From these results it was postulated that during differentiation, an increase in the level of key DNA binding factors relative to their nucleic acid template occurs until a quantitative threshold, involving auto-regulation of gene expression, is reached that commits the cell to merozoite production [2]. Support for this model was provided by evidence for an increase in levels of factors in nuclear extracts of differ-entiating cultures that bind to a motif identified in the promoter region of the major merozoite
antigen gene,Tams1[17]. In this study we have utilised microarray analysis to profile gene
expression inT.annulatafrom the sporozoite stage through merogony to the piroplasm stage.
Stage-regulated genes encoding AP2 DNA binding domains with orthologues in ApiAP2
fac-tors of, primarily, related vector-borne genera (BabesiaandPlasmodium) were then identified.
Following this, cohorts of co-expressed genes were analysed to determine enrichment of nucle-otide motifs bound by AP2 domains. The results identify ApiAP2 DNA binding domains (ApiAP2s) that are conserved across Apicomplexan genera and can be incorporated into a sto-chastic model of competitive factor binding that promotes reversible progression to the com-mitment point of stage differentiation.
Methods
Cell culture and mRNA isolation
Three cell lines were used in this study: theT.annulatainfected D7 and D7B12 cloned cell
lines provide a comparativein vitrosystem for merogony, as while D7 undergoes efficient
centrifugation and total RNA isolated at Day 0, 4, 7 and 9 using Tri-reagent, as previously
described [4,19]. RNA was also isolated using Tri-reagent from sporozoite-infectedHyalomma
ticks and purified piroplasms, as described [20].
Microarray and analysis
A whole-genome tiling microarray approach was used to investigateT.annulatagene
expres-sion during stage-differentiation. The most recent verexpres-sion of theT.annulata(Ankara C9)
ref-erence genome assembly and annotation [21], which was released in 2009 and is available at GeneDB (http://www.genedb.org/Homepage/Tannulata), was utilised to design a custom para-site microarray. The microarray consisted of abutting 45-mer oligonucleotide probes repre-senting both DNA strands of each of the four nuclear chromosomes and the mitochondrial genome. The BLAST-like alignment tool (BLAT) [22] was used to match probe sequences to annotated spliced gene sequences. The sequence of each probe on the array was mapped to coding sequences utilising a flagging system similar to the web-based application, ProbeLynx [23]. A flag value of 1 represents a perfect, full-length alignment between a probe and gene, while a flag value of 5 represents poor alignment. For each individual probe, if a clear best match within the coding sequence was identified, that coding sequence (i.e. gene) was nated as the target of that probe and any poorer scoring BLAT-aligned sequences were desig-nated as cross-hybridisation candidates. Only gene-specific probes were used in the present analysis, with flag thresholds based on previous experimental sensitivity and specificity studies of oligonucleotide arrays [24]. The array was designed for use on a 1,024 x 768 resolution chip
and comprises 392,778 probes in total, 95% of which are targeted to theT.annulatagenome.
The remaining probes comprise bovine gene-targeted probes or control probes, including a set of over 15,000 oligonucleotides with random sequence and of mixed GC content. cDNA syn-thesis, labelling of cDNA and hybridisation to the microarray were performed by Roche
Nim-bleGen. Parasite gene expression levels were determined using log2-transformed median
intensity values and the data normalised using the Robust Multi-array Average [25]. The data discussed in this publication has been deposited in NCBI's Gene Expression Omnibus [26] and is accessible through GEO Series accession number GSE71307 (http://www.ncbi.nlm.nih.gov/ geo/query/acc.cgi?acc=GSE71307). To determine whether a gene is expressed in a particular sample, the probe values for each gene were compared with background values from non-spe-cific, random probes with equivalent GC content. Background hybridisation never exceeded a
log2intensity value of 10. Genes with a value of 10 or more were scored as expressed in a given
parasite stage.
DNASTAR ArrayStar3 software was used to perform hierarchical clustering on log2
-trans-formed gene expression levels. The results were visualised as a heat-map with the data clustered by sample (horizontally) and gene (vertically). Rank Product (RP) analysis is a non-parametric statistical test that may be used to identify differentially expressed genes between conditions using limited sets of replicates [27]. RP analysis was conducted on the following pair-wise com-parisons: sporozoite to macroschizont, macroschizont (Day 0) to merozoite (Day 9), merozoite
to piroplasm, and piroplasm to sporozoite. The obtained RP score was used to rank all theT.
annulatagenes in the dataset according to statistical confidence levels. Differentially expressed
genes were assigned based on a false discovery rate (FDR)<0.05 [28] and a fold change2
(absolute). The same pipeline was used to generate a list of differentially expressed parasite genes between the D7 and D7B12 cell lines cultured at 37°C. Expression values for all identified
T.annulataAP2 domain genes were then extracted from both datasets. Profiles of gene
expres-sion values (log2) across stages and during the differentiation time course were generated using
Quantitative Reverse Transcription PCR
Two-step quantitative Reverse Transcription PCR (qRT-PCR) incorporating SYBR Green
qRT-PCR methodology was utilised. cDNA synthesis was carried out in a total volume of 20μl
using oligo(dT) primers and the method provided with the AffinityScript Multi-temperature cDNA Synthesis Kit (200436, Agilent). qRT-PCR reactions were performed using 500 ng
cDNA template in a final volume of 25μl according to Brilliant SYBR Green QPCR Master Mix
protocol (http://www.chem-agilent.com/) for real-time fluorescence detection of PCR product.
To normalise qRT-PCR data, the genes encoding the heat shock 70 kDa protein (TA11610)
and a heat shock 90 kDa protein (TA10720) were used based on constitutive expression from
both microarray, semi-quantitative RT-PCR data and previous analysis by northern blotting
[29]. Primers for both control and test genes were as follows:TA13515F,
5'-CGGGGAA-GAGTGTAAAAATGAGTG and R, 5'-GGAGGTGATGGTCGTGATGG;TA11145F,
5'-CGTTGAGGGATCTTGTGAC and R, 5'-CTTCACACTCCTGTTCCCA;TA15705F,
5'-TGGAGATGGAGATAGCATGC and R, 5'-CTGGACCTCCAGATGCAC;TA11610F,
5'-ACGCAAATGGAATCCTCAAC and R, 5'-TATTCGTCGTGCTCTGCTAA;TA10720F,
5'-ACAATAGCAGAATCAGGAACAG and R, 5'-TATTGGGAAACGGATGAATTCTG; TA07100F, 5'-GCCACCCAGTAGACCTTCA and R, 5'-GTCGAGCATCAGCAAGTGT. Thermal cycling parameters used were: 1 cycle enzyme activation and initial denaturation, 10 min at 95°C; 40 cycles of PCR amplification (denaturation, 30 sec at 95°C; annealing, 60 sec at 60°C; elongation, 60 sec at 72°C); 1 cycle dissociation curve (60 s at 95°C, 30 s at 55°C and 30 s at 95°C). All qRT-PCR data was captured and analysed by MxPro v4.10 software with the Mx3005P Real-Time PCR System (Agilent Technologies). Melting curve analysis was carried out to verify product specificity and determine the presence of primer-dimers and other non-target products. Three technical replicates of each experimental time-point and no tem-plate controls were included in the PCR reactions for all sample points and primer sets.
Expres-sion values of target genes were normalised against Hsp70 (TA11610) and an Hsp90 gene
(TA10720) and fold-change calculated relative to a calibrator point/condition, Day 0–
macro-schizont stage, using a -2-ΔΔCtequation [30]. Data was plotted as normalised mean values of
log2fold change ± the standard error of the mean (SEM). Statistical analysis was performed
using a one-tailed Student’s t-test.
PlasmoDB, BLAST, Motif enrichment analysis and MEME
Genes inT.annulataencoding orthologues of AP2 domains in related Apicomplexan species
and genera were identified using BLASTP (www.ncbi.nlm.nih.gov/BLAST). ApiAP2 domain
boundaries were defined as in Balajiet al. [7] and confirmed using the Pfam database (pfam.
sanger.ac.uk). A cut-off of>50% sequence identity was employed. Sequence alignments were
generated using ClustalW (www.ebi.ac.uk/Tools/msa/clustalw2/). Alignment of all TaApiAP2s using T-coffee software (www.ebi.ac.uk/Tools/msa/tcoffee/) was generated to identify general
conservation of the domain inT.annulata.
To establish whether upstream intergenic regions (IGR) of differentially expressed sets of
genes were enriched for selectedPlasmodium falciparumApiAP2 domain target motifs, the
motif pattern search (www.piroplasmadb.org/piro) function in PiroplasmaDB (version 1 and 2) was utilised. PiroplasmaDB was released in 2011 and is based on the pre-existing 2009
Gen-eDB assembly/annotation forT.annulata. A size restriction of 400 bp upstream of the
114 bp for the Tams1 gene (TA17050) ofT.annulata[17]. Motif enrichment analysis was
per-formed on the complete dataset ofT.annulatapredicted genes together with subsets of genes
differentially expressed across stages and time points of the macroschizont (Day 0) to merozo-ite (Day 9) time course. The obtained data was exported to an Excel file and motif distribution data was tabulated. For each subset of genes, a motif enrichment P value was calculated by comparing the proportion of genes within the subset that possess the motif with the proportion
of genes in a background list that possess the motif using a Fisher’s Exact Test. Pearson
Corre-lation (positive or negative) of the expression pattern of genes which possess an ApiAP2 domain binding motif in their upstream region with the profile displayed by the gene encoding the ApiAP2 domain predicted to bind the motif was performed using Excel.
The Multiple Expectation Maximization for Elicitation of Motifs (MEME; version 4.6.1) software [32] was used to screen for putative motifs in IGRs of stage-regulated genes. Input sequences were prepared by extracting sequences upstream of predicted protein coding
sequences (CDS) from theT.annulataGeneDB database. Searches were performed using a
motif length of between 5 and 8 bp, 8 and 12 bp and 8 and 20 bp, and ZOOPS (Zero Or One Occurrence Per Sequence). The statistical significance of the motif was computed as an E-value based on an estimation of the expected number of motifs with the given log likelihood ratio and with the same width and site count that could be expected in a similarly sized set of ran-dom sequences.
To investigate the potential of ApiAP2 domains to bind to motifs in upstream of genes encoding the domain (auto-regulation), sequence alignments of upstream regions of selected
T.annulataApiAP2 genes to theirT.parvaorthologues was performed using ClustalW and
visualised using Jalview. Alignments representingTA13515,TA11145,TA12015andTA16485
were then searched for the core DNA binding motifs (5'-GTGTAC, 5'-CACACA/ACACAC,
G-box/C-box or 5'-TCTACA) identified for the respective orthologous domain inP.
falcipa-rum[9] orC.parvum[33].
Based on previous phylogenetic analysis [7,9], four TaApiAP2 domains (encoded by
TA11145,TA0710,TA19920andTA02615) that could be predicted to bind to (A)CACAC(A)
type motifs were selected and aligned toT.parva,T.orientalisandP.falciparumdomain
ortho-logues. Domain boundaries were defined using the Pfam database and a Maximum Likelihood tree constructed using RAxML [34]. Reciprocal BLAST analysis of each domain was also per-formed, as described above.
Recombinant AP2 domain fusion proteins and parasite enriched nuclear
extracts
Expression of selected AP2 domains as glutathione S-transferase (GST) fusion proteins was
performed using the pGEX system. The regions selected for amplification included 10–20
nucleotides on either side of the sequence encoding each domain. Primers designed to create N-terminal GST-fusion constructs contained 5' and 3' extensions to create EcoRI and XhoI
restriction sites respectively, for cloning. Primer sequences for each domain were:TA13515F,
5'-CAGGAATTCGTACAGGGTATGGTTGGATATTCT and R, 5'-GCACTCGAGGCTGAA
TACGCTCTACTGGAGTGC;TA11145F, 5'-CAGGAATTCCAAAGAACGAGCGCAAA
GATTC and R, 5'-GTTCTCGAGTGTTAAATCTTATCATTATGTCTAAGTGC;TA16485F,
5'-CAGGAATTCAGAGCAAATTACTACCGAAGATTAG and R, 5'-GCACTCGAGCGGT
CAGATTTGTTGGTTGGTTTCTG;TA12015F, 5'-CAGGAATTCTACCGAAGGAAGC
CAATCTCATC and R, 5'-GCACTCGAGAGATGTGGTTCCTCTCGGT. PCR amplification
was performed using the proof-reading Polymerase (Pfu) andT.annulataDNA (strain
QiaQuick PCR Purification Kit (Qiagen, 28104), ligated into pGEX5x-2 vector DNA digested with EcoRI and Xhol, and competent XL-1 Blue cells (Stratagene, 200249) transformed using standard methodology. Recombinant clones were validated by DNA sequencing (Eurofins MWG Operon, Germany). Validated pGEX constructs were then re-transfected into BL21 Codon Plus (DE3)-RIL (Stratagene) competent cells and fusion proteins induced by IPTG (final concentration of 0.2 mM). Purification of fusion protein was performed using
glutathi-one sepharose affinity beads (Sigma-Aldrich, GE17-0756-01) according to the manufacturer’s
methodology. Protein concentrations were generated using the Better Bradford Assay Reagent, (Pierce Biotechnology, 23238). If required, GST-fusion proteins were concentrated using Ami-con Ultra-15 Centrifugal Filter Units, with an Ultracel-3 membrane (Millipore, UFC900308).
Eluted proteins were stored at -80°C in 25–50μl aliquots, at a concentration of 1 mg/ml.
Parasite-enriched Nuclear Extracts (PNE) were generated based on the method of Shiels
et al. [17] but using the NE-PER Nuclear and Cytoplasmic Extraction Reagent kit, following
the supplier’s instructions (Thermo Scientific). A differential centrifugation step (x 500 g to
pellet host nuclei, followed by re-centrifugation of the supernatant at x 16,000 g) to enrich for parasite nuclei was incorporated after the initial cell lysis.
Chemiluminescent Electrophoretic Mobility Shift Assay (EMSA)
To investigate protein-nucleic acid interaction, the Thermo Scientific LightShift Chemilumi-nescent Electrophoretic Mobility Shift Assay was employed. Single-stranded HPLC purified 5'-biotinylated oligonucleotides containing an ApiAP2 target or mutated motif (synthesised by
Eurofins Genomics, Germany) were re-constituted in water to 100 pmol/μl. Labelled and
com-plementary unlabelled oligonucleotides were annealed using a thermocycler in 20 mM
Tris-HCl, pH 7.6; 50 mM NaCl, 10 mM NaCl at 50μmol. Annealed oligonucleotides were diluted to
1 pmol/μl for non-labelled and 20 fmol/μl for biotinylated probes. For EMSA using fusion
pro-tein, in addition to the standard components used in the kit protocol, each reaction included
1μl 50% glycerol, 1μl 1% NP40, 2μl fusion protein (0.7–1 mg/μl), 1μl biotinylated oligo (20
fmol/μl). For reactions with PNE, additional components for optimisation were: 1μl 50%
glyc-erol, 1μl 100 mM MgCl2, 1μl 1% NP40, 1μl EDTA, 5μl of PNE, 2μl biotinylated oligo (40
fmol/μl). A 4% polyacrylamide gel was run at 100V, at 4°C and free and bound probes
trans-ferred to Biodyne Precut Nylon Membrane (Thermo Scientific, 77015) and then cross-linked
at 120 mJ/cm2using UV-light. Detection was performed using the Chemiluminescent Nucleic
Acid Detection Module (Thermo Scientific, 89880). For competition experiments, cold
double-stranded oligos were added to the reaction mix at 4–10 pmol and incubated on ice for 20
minutes before addition of the labeled probe. Oligonucleotides used as EMSA probes are listed (S1 Table).
Results
Identification of differentially regulated gene sets by microarray analysis
A microarray approach was utilised to profile gene expression ofT.annulata. The array was
screened with cDNA representing anin vitrostage-differentiation time-course from the
macroschizont (Day 0) to cultures undergoing significant production of merozoites (Day 7 and Day 9), with an intermediate time-point (Day 4) included. The array was also hybridised with RNA representing sporozoites (the stage transmitted by ticks) that infect leukocytes and intra-erythrocytic piroplasms (the stage transmitted to ticks).
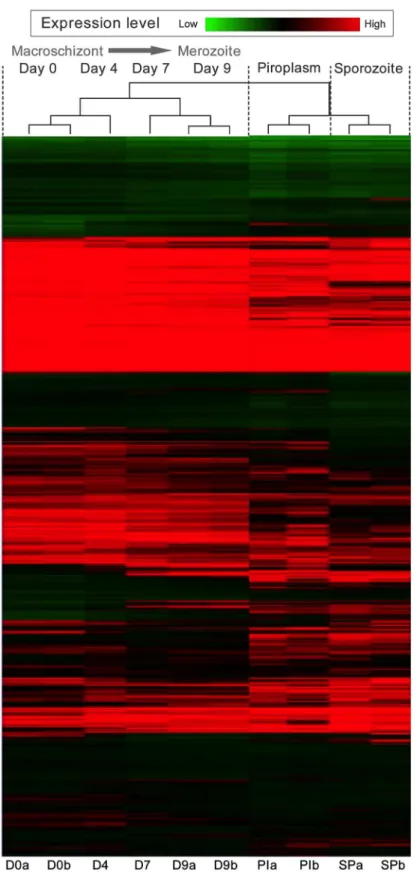
Hierarchical clustering was performed on log2-transformed gene expression data
represent-ing eachT.annulatacoding sequence (CDS). The data was clustered by sample and CDS, and
Day 0, while the Day 7 data shows greatest similarity to the profile obtained for Day 9. How-ever, with detailed inspection it can be seen that the day 4 time-point represents a transitional state, with genes that are down-regulated or up-regulated in the later time-points showing intermediate expression at Day 4: a few genes showed peak expression at this time-point. Sig-nificantly, clear differences in the expression level of genes were observed across different
life-cycle stages and points of thein vitrodifferentiation time course e.g. Day 4 to Day 7. In
addi-tion, an appreciable number of genes, clustered at the top of the heat-map, show a pattern indi-cating constitutive expression. It can be concluded that a major change over in the control of
gene expression occurs between Day 4 and Day 7 of differentiation to the merozoitein vitro.
Further analysis was performed using Rank Products (RP) to identify differentially expressed genes between different stages and time-points [27]. The numbers of genes
identi-fied for each pair-wise comparison are shown inTable 1. Datasets of the top 100 differentially
expressed genes were generated, with further analysis focusing on the macroschizont (macro) to merozoite (mero) differentiation step. The up-regulated macro-mero list (S2 Table) is mostly comprised of genes encoding hypothetical proteins but also includes genes encoding
rhoptry-associated proteins (TA05870,TA05760andTA05705), as predicted from previous
studies [4,16]. Genes encoding a Map2 kinase (TA21080), cysteine protease (TA04105,
TA15660), myosin (TA20555), a phosphate transporter (TA13530), a ubiquitin-conjugating
enzyme E2 (TA10690), a cyclin-dependent serine/threonine kinase—related protein
(TA08470) and an aspartyl (acid) protease (TA17685) were also identified as up-regulated
during merogony. Three genes (TA13515,TA16485andTA12015) encoding proteins
anno-tated as possessing AP2 DNA binding motifs were identified as significantly (FDR<0.05)
up-regulated during differentiation to the merozoite.
The list of down-regulated macro-mero genes (S3 Table) includes members of two gene families encoding proteins predicted to be secreted into the host cell compartment implicated
in establishment of the macroschizont infected cell [35–37]. Thus, members of the SVSP
family (e.g.TA11410,TA09805,TA09790andTA09420) and TashAT family genes (TA2009,
TA03125,TA03120,TA03145andTA03165) were identified as highly down-regulated during differentiation to the merozoite. In addition, the gene encoding the macroschizont specific T
cell antigen, Ta9 (TA15705) [38], was present in the list, as were members of the
SfiI-subtelo-meric fragment-related protein family and a gene (TA10735) encoding a putative GATA type
transcription factor. Down-regulated expression (relative to the Day 0 (macroschizont) time-point) was validated for Ta9 by qRT-PCR with reduced expression most marked between the Day 4 and Day 9 time-point (S1 Fig).
and tick-derived sporozoites (SP). Each horizontal line represents an individual gene, replicate samples are labelled a and b. Green bands represent genes expressed at low levels, while black and red bands represent intermediate and highly expressed genes respectively.
doi:10.1371/journal.pntd.0003933.g001
Table 1. Number of genes displaying differential gene expression between stages identified by Rank Products (FDR<0.05).
Between-stage comparison Up Down
Sporozoite to macroschizont 66 133
Macroschizont to merozoite 152 115
Merozoite to piroplasm 24 20
Piroplasm to sporozoite 57 35
Expression profiles for
T
.
annulata
AP2 domain encoding genes
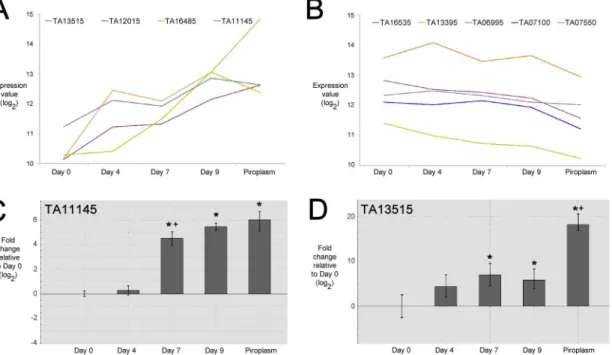
K means clustering was performed on log2-transformed gene expression data for all 22 ApiAP2
encoding genes inT.annulata. Two groups displayed expression profiles that could be
associ-ated with differentiation to the merozoite stage, i.e. showing generally progressive up-regula-tion and down-regulaup-regula-tion respectively. The first of group of genes (Fig 2A) included the three AP2 domain genes identified by RP analysis as up-regulated during merogony. These genes
were elevated, 7.36 fold (TA13515), 6.84 fold (TA16485) and 4.01 fold (TA12015) between Day
0 (macroschizont) and Day 9 (merozoite), with an additional ApiAP2 gene (TA11145)
display-ing a 3.08 fold increase between these time-points (FDR = 0.07). Notable differences in profile between these genes were, a higher relative level of expression in the macroschizont stage (Day
0) forTA11145, a delayed elevation in expression forTA16485(between Day 4 and Day 7) and
a sustained, significant elevation in expression ofTA13515through the Day 9 time-point
(mer-ozoite) to the piroplasm stage. Based on their temporal expression patterns we have denoted
the factors encoded by these genes as TaAP2.me1 (TA11145), TaAP2.me2 (TA12015), TaAP2.
me3 (TA16485); the fourth factor (encoded byTA13515) we have denoted as TaAP2.g based
on elevated expression of the encoding gene in the piroplasm stage and high identity of the
AP2 domain to the domain of thePlasmodiumAP2-G factor (see below).
Genes in the second group possess a profile indicating reduced expression from the macro-schizont stage (Day 0) through the merozoite stage (Day 9) to the piroplasm stage (Fig 2B). The change in expression level was not as marked but like the up-regulated group of ApiAP2
genes, differences between their profiles were manifest. For example, forTA13395a decrease in
expression was observed between Day 0 and Day 4, whereas forTA07550expression increased
from sporozoite though to the intermediate Day 4 time-point, followed by a reduction in levels
at Day 7 and Day 9 (merozoite).TA07100did not display a reduction until between Day 9
(merozoite) and the piroplasm stage.
Of the four macroschizont to merozoite up-regulated AP2 genes, two,TA11145(TaAP2.
me1) andTA13515(TaAP2.g), were selected for validation by qRT-PCR. The qRT-PCR results
broadly supported the array data with significant up-regulation (p<0.05) relative to the Day 0
time-point at the Day 7 and Day 9 time-points and the piroplasm stage (Fig 2C and 2D).
TA11145(TaAP2.me1) displayed elevation in expression level during merogony while for
TA13515(TaAP2.g) the most significant increase in expression level was detected later, between the merozoite (Day 9) and piroplasm stage. In general, higher differences in expres-sion levels between time-points were indicated by RT-PCR compared to microarray data, and
a significant difference was detected in expression ofTA11145between Day 4 and Day 7 that
was not apparent with the array data. These differences are likely to arise from the increased quantitative sensitivity of qRT-PCR over the microarray platform, and inherent variability between differentiation time courses used to generate RNA for the two procedures [2].
Conservation of
T
.
annulata
AP2 domains across related species and
genera
Previous work has identified a considerable number of distinct consensus DNA motifs bound by different apicomplexan AP2 domains [9,39]. Moreover, it is known that ApiAP2 domain sequences can show conservation across Apicomplexan genera and that orthologous domains can bind closely related DNA motifs [9,12,39,40], although this is not always the case and domains that bind similar DNA motifs can show sequence diversity [39]. We, therefore,
inves-tigated conservation of the AP2 domain of the fourT.annulataAP2 encoding genes that are
up-regulated during merogony. AcrossTheileriaspecies there is a high level of conservation in
domains with maintenance of the three anti-parallel beta strands and the alpha helix secondary structure (Fig 3). However, a degree of divergence between the four paralogous domains is
evi-dent (S2 Fig). In addition, for Ta.AP2.me1 (TA11145), TaAP2.me3 (TA16485) and TaAP2.g
(TA13515), orthologous AP2 domains with strong identity were identified inBabesiaand Plas-modium(Fig 3) species supporting previous studies [7], while for TaAP2.me2 (TA12015) AP2
domain orthologues were identified inBabesiaandCryptosporidiumbut notPlasmodium.
Thus, it can be predicted that while orthologous groups of these AP2 domains may recognise similar DNA motifs, the four paralogous domains encoded by genes that are up-regulated
dur-ing merogony inT.annulataare likely to recognise distinct motifs.
DNA motifs predicted for
T
.
annulata
AP2 domains are enriched in
upstream IGRs of stage-regulated genes
Based on identity across orthologues, data on the primary DNA motifs bound byPlasmodium
AP2 domains [9] was utilised to investigate enrichment of these motifs in theT.annulata
genome.Plasmodiumorthologues (PF3D7_1222600 (previously, PFL1085w), PBANKA_143750)
of TA13515 (TaAP2.g) encode the AP2-G factor critical for commitment to gametocytogenesis
[13,14].PlasmodiumAP2-G binds the motif GxGTACxC, with GTAC identified as core
nucleo-tides [9]: this motif was found to be significantly enriched (P<0.0001) within a 400 bp region
upstream of the ATG start codon on the positive strand ofT.annulatagenes up-regulated from
merozoite to piroplasm (29% vs 4% of all other genes). No statistical enrichment of this motif was found in any other subset, implying this motif may be important for the up-regulation in expression of these genes from merozoite to piroplasm. The motif was also significantly enriched
Fig 2. Temporal expression profiles of selected ApiAP2 genes inT.annulata.A. Microarray log2expression values (Y-axis) of up-regulated ApiAP2
genes generated from RNA derived from an in vitro stage-differentiation time-course from Day 0 (macroschizont) to Day 9 (merozoite), and piroplasm stage (x-axis). B. Microarray log2expression values (Y-axis) of down-regulated APiAP2 genes generated from RNA derived from an in vitro stage-differentiation
time-course from Day 0 (macroschizont) to Day 9 (merozoite), and piroplasm stage (x-axis). C. QRT-PCR analysis of ApiAP2 gene, TA11145, expression, plotted as fold change in expression relative to the Day 0 (macroschizont) at Day 4, Day 7 and Day 9 (merozoite), and piroplasm stage. D. QRT-PCR analysis of ApiAP2 gene, TA13515, expression, plotted as fold change in expression relative to the Day 0 (macroschizont) at Day 4, Day 7 and Day 9 (merozoite), and piroplasm stage. Significant difference (P value0.05)*, relative to Day 0 and +, relative to the preceding time-point/stage.
within 100–85 bp upstream of the ATG in the up-regulated merozoite to piroplasm gene set (25% vs 1.38%). This indicates the motif is either located within the 5' UTR or is just proximal to the transcription start site of genes with a UTR of less than 100 bp. A motif associated with genes enriched near telomeres and those encoding signal peptide proteins has been reported just
proxi-mal to the transcription start site inT.parva[31]. To validate that expression of genes enriched
for the motif correlates with the expression profile of the gene encoding the AP2 domain pre-dicted to bind the motif, the Pearson correlation coefficient value was computed. A perfect
positive correlation (R = 1) was identified forTA13515(TaAP2.g) and the average profile of
mer-ozoite to piroplasm up-regulated genes possessing the motif (S3 Fig).
Fig 3. Alignment ofT.annulataApiAP2 domains, encoded by genes identified as up-regulated following merogony, with orthologous domains from related species and genera.A. Alignment of ApiAP2 domain encoded by TA13515 with orthologous domains identified by BLAST analysis from T. parva, T. orientalis, B. bovis, and P. falciparum or C. parvum: strong conservation of the domain across the related species is indicated (up to 100% identity) and genera (92% identity, 96% similarity with B. bovis; 80% identity, 94% similarity with P. falciparum). B. Alignment of ApiAP2 domain encoded by TA11145: strong conservation of the domain across the related species (100% identity) and genera (96% identity, 98% similarity with B. bovis; 72% identity, 82% similarity with P. falciparum) is apparent. C. Alignment of ApiAP2 domain encoded by TA16485: strong conservation of the domain across the related species (100% identity) and genera (96% identity, 100% similarity with B. bovis; 87% identity, 90% similarity with P. falciparum) is evident. D. Alignment of ApiAP2 domain encoded by TA12015: strong conservation of the domain across related species (91% identity with T. parva; 85% identity with T. orientalis), with strong to good conservation across genera (70% identity, 81% similarity with B. bovis; 52% identity, 68% similarity with C. parvum. Regions of predicted secondary structure are indicated above the alignment and were predicted by Phyre2using three independent secondary structure prediction programs:
Psi-Pred [58], SSPro [59] and JNet [60].*identity,:. similarity.
Enrichment for the core TCTAC(T)A motif bound by thePlasmodiumorthologue
(PF3D7_1239200 (PFL1900w)) of the AP2 domain of TaAP2.me3 (encoded byTA16485)
indi-cated a possible association within 400 bp upstream of the ATG start codon of genes down-reg-ulated from macroschizont to merozoite; 11.5% vs 6.7% of all other genes (P = 0.057). There was no significant enrichment indicated within the first 100 bp upstream of the translation start in the down-regulated gene set. A significant negative correlation (R = -0.92) was com-puted for the average profile of down-regulated macroschizont to merozoite genes enriched for
the TCTAC motif and the expression profile of theTA16485(TaAP2.me3) gene (S3 Fig).
No direct orthologue of the AP2 domain encoded byTA12015(TaAP2.me2) can be
identi-fied inPlasmodium, but the domain orthologue inC.parvum(cgd8_810 Cpar) binds a
G-box like motif [7,33]. A similar G-G-box like motif, A(G)NGGGGC(A) showed significant enrichment in the 400 bp upstream of the translation start site on the positive strand in IGRs of genes categorised as up-regulated from merozoite to piroplasm stage, with 45% vs 9%
(P<0.0001) of IGRs containing this motif. In addition, a significant depletion (1.7% vs 9.4%)
was computed on the positive strand of upstream IGRs of genes down-regulated from
macro-schizont to merozoite (P<0.005). The motif was not detected on the positive strand within
100 bp of the ATG start codon for either the down or up-regulated gene set.
The orthologue of the AP2 domain of TaAP2.me1 (TA11145) inP.falciparumis encoded
byPF3D7_0802100(previously denoted,MAL8P1.153), which has been demonstrated to rec-ognise a core motif rich in AC di-nucleotides [A/G]CACA[C/T][A/T] [9]. Although this motif
type was commonly found within non-coding (intergenic) regions of theT.annulatagenome,
enrichment analysis found that there is a depletion of the motif in the 400 bp upstream region of IGRs of genes down-regulated from macroschizont to the merozoite stage, 13% vs 25%
(P<0.005). There was also evidence of enrichment 400 bp upstream of the ATG start codon
in IGRs of genes up-regulated in merozoite, 31% vs 24% (P = 0.06) and piroplasm stages, 46%
vs 24% (P<0.05). No significant enrichment or depletion was obtained on analysis of the
region 100 bp upstream of the translation initiation ATG codon. A positive Pearson
Correla-tion (R = 0.93) was observed for expression of the TaAP2-me1 gene (TA11145) and the average
profile of macro-mero most up-regulated gene set enriched for ACACAC in their upstream IGRs (S3 Fig). Analysis of 5' IGRs of genes upregulated from macroschizont to merozoite was also performed by MEME. The top motif identified was a 14 bp motif (AG)AATGTGTAA
(AG)(GT)(TAG)(AT) (E-value = 1.3 x 10⁻⁹) with a conserved core motif of AATGTGTAA.
This motif shows similarity with the reverse complement of the ACACAC motif, and identity
with the motif previously identified by MEME in 5' IGRs ofT.parvaandT.annulata[31]. The
motif has identity with aP.falciparumconserved TGTGT(G/A)(A/T) motif, and like its
Plas-modiumcounterpart has a widespread distribution in non-coding regions of the genome. A role as a binding site for regulatory nuclear proteins other than transcription factors was pro-posed [31].
Validation of motif binding by recombinant
T
.
annulata
AP2 DNA binding
domains and factors in parasite-enriched nuclear extract
To test whetherT.annulataAP2 domains could bind the nucleotide motifs predicted for
theirPlasmodiumorthologues, GST fusion proteins of the AP2 domain were generated for
Plasmodium[13,14]. The shift complex was competed with unlabelled probe, and no shifts were obtained using a mutated core binding site (G/C replaced with A in motif) probe (Fig 4, lane 6).
Similar results were obtained for the recombinant AP2 domain of TaAP2.me1 (TA16485D), as a shift was obtained using a probe containing the core motif TCTACA identified for the
orthologousP.falciparumdomain [9]. The EMSA generated a clear band shift (S4 Fig) with
binding specificity indicated by a reduction in the detected shift on addition of cold probe.
EMSA with the AP2 domain encoded byTA12015, predicted to bind a G box like motif, did
not generate a detectable shift (S5 Fig).
TheP.falciparumorthologue of the AP2 domain of TaAP2.me1 (TA11145) has been shown to bind the motif ACACAC [9]. To test that TaAP2.me1 could also bind this motif, EMSA was performed using the AP2 domain fusion protein and a probe containing a double ACACAC
type motif located in the intergenic region upstream of the encoding gene (TA11145). The
TaAP2.me1 AP2 domain fusion protein (TA11145D) generated a strong shift with this probe (Fig 5A). To confirm that binding required the ACACAC motifs, these motifs were mutated. A shift was not observed with the mutated probe. Thus, the TaAP2.me1 AP2 DBD has the capacity to bind specifically to a double motif in the upstream region of its own encoding gene (TA11145).
To determine if native nuclear factors could bind to the probe representing the double ACACAC type motif,, EMSA was performed using extracts from parasite-enriched nuclear fractions derived from macroschizont-infected cells (Day 0) and infected cells undergoing
dif-ferentiation to the merozoite (Day 9).Fig 5Bshows that EMSA performed with extracts derived
from parasite-enriched nuclear extracts generated a total of 4 shift complexes A-D. Shifts A, C and D were also detected with nuclear extracts derived from uninfected host BL20 cells (S6 Fig) and were concluded to be derived from host contamination in PNE. Shift B, however, was only obtained using extracts derived from cultures undergoing merozoite production and was not detected in host-derived nuclear extracts. To confirm that the up-regulated B shift required the (A)CACAC(A) motifs, EMSA was performed using the mutant probe and Day 9 PNE (Fig 5C): the up-regulated shift B was not obtained with this probe. The results indicate that a
Fig 4. TA13515D AP2 domain (TaAP2.g) fusion protein domain binds to the motif identified for the orthologous AP2G domain ofPlasmodium.EMSA performed with 0.7μg of purified GST-TA13515D and 20 fmol of biotin-labelled double-stranded oligo probe containing the GTGTACAC motif recognised by the AP2 domain of Plasmodium AP2-G: lane 1, probe only; lane 2, probe + GST-TA13515D; lane 3, probe + GST-TA13515D + cold competitor (4 pmol); lane 4, probe + GST-TA13515D + competitor (6 pmol); lane 5, probe + GST-TA13515D + competitor (8 pmol); lane 6, mutated ATATAAAA probe (G/C in motif replaced with A) + GST-TA13515D; arrow indicates probe-specific shift.
nuclear factor(s) associated with cultures undergoing differentiation to the merozoite can
spe-cifically bind to (A)CACAC(A) motifs upstream of theTA11145gene that is up-regulated
dur-ing merogony.
AP2 domain genes up-regulated during differentiation to the merozoite
are predicted to auto-regulate
Demonstration that the ACACAC motif in the IGR upstream of theTA11145gene is
recog-nised by the AP2 binding domain encoded by the gene indicates that its expression may be
auto-regulated. This is of interest as the stochastic model of merogony inT.annulatapredicted
Fig 5. TA11145D AP2 domain (TaAP2.me1) fusion protein and PNE factor(s) bind to an (A)CACAC(A) type motif upstream of the TA11145 gene.A. EMSA performed with 0.7μg of purified GST-TA11145D and 20 fmol of biotin-labelled double stranded oligo probe containing a double (A)CACAC(A) motif: lane 1, probe alone; lane 2, probe + GST-TA11145D; lane 3, mutant probe with both motifs mutated*denotes position of specific shift. B. EMSA performed with PNE and the double (A)CACAC(A) motif probe: lane 1, probe alone; lane 2, probe + PNE Day 0; lane 3, probe + PNE Day 9. Letters denote shifts detected, shift B was only present in Day 9 PNE. C. EMSA performed with PNE, and above probe: lane 1, probe only; lane 2, probe + PNE Day 9; lane 3, mutated probe + PNE Day 9, the infection associated shift detected in Day 9 PNE was not obtained with the mutant probe.
that the commitment to differentiate is reached via the capacity of regulators of differential gene expression to auto-regulate. It was investigated, therefore, whether there is a greater
occurrence of the motif in the IGR upstream of the domain encodingTA11145gene relative to
the other 21 AP2 encoding genes. Seven ACACAC type motifs were found in the IGR upstream ofTA11145(including the double motif separated by five nucleotides) and six were conserved
upstream of theT.parvaorthologue (S7 Fig). In contrast, a maximum of three motifs were
detected in the IGR upstream of two other AP2 domain genes (TA05055andTA08375) and an
average of 0.95 motifs per AP2 gene IGR was obtained. Both ApiAP2 genes with three motifs
were classed in the same expression profile asTA11145(up from macroschizont (Day 0) to
merozoite (Day 9)).
Auto-regulation has also been predicted for genes encoding thePlasmodiumAP2G factor
(PF3D7_1222600,PBANKA_143750) [13,14]. Screening for the core motif (GTAC) bound by
the TaAP2.g domain detected it’s presence at three positions in the upstream intergenic region
of the encoding gene (TA13515), including a double motif separated by 6 bp (core A to core
G). These three motifs were conserved in the upstream region of theT.parvagene encoding
the orthologous domain (TP02_0497) [41].
Multiple AP2 domains are predicted to bind (A)CACAC(A) type motifs in
T
.
annulata
and
Plasmodium
InP.falciparum, multiple AP2 domains have been shown to bind to motifs rich in CA di-nucleotides, two variants being ACACAC and CACACA [9]. We term these (A)CACAC(A)
type motifs, where an A is present either at the 5', 3' or both ends of the motif.Theileria
ortho-logues ofPlasmodiumAP2 domains that bind (A)CACAC(A) can be identified in the
phyloge-netic analysis performed by Balajiet al., [7]. Thus domains encoded byTA11145,TA07100
andTA02615were found to be orthologues of the domains encoded byPF3D7_0802100
(MAL8P1.153),PF3D7_0420300(PFD0985w.D1) andPF3D7_1305200(PFL13_0026), while
the domain encoded byTA19920was placed in a position in the tree intermediate between
TA07100 and TA11145 but without a clear domain orthologue indicated inPlasmodium. To
analyse this group of domains in more detail, a maximum likelihood tree was constructed with
the fourP.falciparumdomains and the putative orthologous domains fromT.annulata,T.
parvaandT.orientalis(Fig 6). The tree generated essentially supports the phylogeny of Balaji
et al. [7] with three clear orthologous groups, containing TA07100, TA11145 or TA02615
domains, indicated. The domains encoded byTA19920and a fourthPlasmodium(A)CACAC
(A) binding domain, encoded byPF3D7_1456000(PF14_0533), did not fit into an orthologous
group. This was supported by reciprocal BLAST analysis with no clear orthologue identified
for the TA19920 AP2 domain inPlasmodiumor the PF3D7_1456000 domain inTheileria.
An alignment of AP2 domains in the orthologous groups represented by TA11145 and
TA07100 domains, respectively (Figs3BandS8) indicates that these domains are highly likely
to bind related (A)CACAC(A) motifs inBabesia,TheileriaandPlasmodium. Thus, there are, at
least, two phylogenetically related AP2 domains conserved in vector-borne Apicomplexa that bind (A)CACAC(A) type motifs, with orthologous members of a third ApiAP2 domain (repre-sented by TA02615) possibly binding to this, or a closely related, motif.
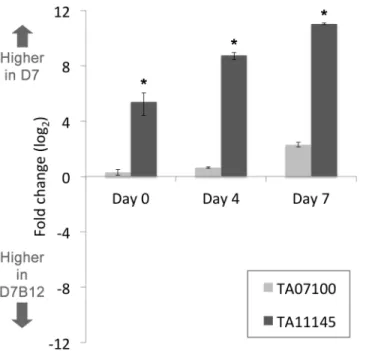
TA11145
gene expression is significantly elevated in the D7 infected cell
line compared to a line severely attenuated for differentiation to the
merozoite
attenuated phenotype may be linked to a quantitative alteration in expression of key regula-tory molecules. To test whether this might be associated with AP2 domain encoding genes, microarray data was generated for the D7B12 line (Day 0) and compared to data for the differ-entiation competent D7 line (Day 0). Three AP2 domain genes were predicted to show
signifi-cantly higher expression in D7 relative to D7B12 (S4 Table). One of these genes (TA11145)
encodes the domain shown to bind (A)CACAC(A) and is up-regulated during merogony;
while the gene (TA07100) encoding the other AP2 domain inT.annulatathat is strongly
pre-dicted to bind (A)CACAC(A) did not show a significant difference. To validate the difference
in expression qRT-PCR was performed for theTA11145, andTA01700genes using RNA
derived from D7 and D7B12 cells cultured at 37°C (Day 0) and during progression to
merog-ony at 41°C (Day 4 and Day 7). The results indicate that RNA levels ofTA11145were
signifi-cantly higher (5.4 fold, log2) in D7 vs D7B12 cells at the Day 0 time-point and that this
difference is exacerbated following culture at 41°C: 8.7 fold (log2) at Day 4 and 11 fold (log2)
at Day 7 (Fig 7). In contrast, qRT-PCR performed forTA07100showed a relative difference of
0.2 fold, 0.6 fold and 2.2 fold (log2) higher in D7 cells at Day 0, Day 4 and Day 7, respectively.
This validates that the TaAP2.me1 gene (TA11145) is expressed at a higher level in a cell line
competent for differentiation and that up-regulation is independent of a heat shock response.
Thus, the expression level ofTA11145relative toTA07100is clearly altered in favour of
TA11145in the D7 cell line and this bias is increased during progression towards merogony (Day 4 and Day 7).
Discussion
Within the life cycles of Apicomplexan parasites, transition from stages that undergo multiple rounds of asexual replication to stages that promote life-cycle progression and parasite trans-mission are regulated by critical cellular differentiation events. Evidence generated across apicomplexan genera indicates that these transition points operate on a stochastic basis and that stage-differentiation steps can be programmed to occur in a time-dependent manner
Fig 6. Phylogenetic tree of AP2 domains fromP.falciparumandTheileriaorthologues predicted to bind to (A)CACAC(A) type motifs.A maximum likelihood phylogenetic tree was constructed using the amino acid sequence of AP2 domains of related genes in T. annulata, T. parva, T. orientalis and P. falciparum. Three clusters of orthologous domains with a representative from each species can be observed for TA11145, TA02615 and TA07100. No clear Plasmodium orthologue was detected for the TA19920 domain. Percentage bootstrap values are shown at each node on the tree.
[1,2,13,14,42]. Together, these findings indicate that a basic mechanism may have been conserved.
From previous investigation of merogony inT.annulata in vitroit was proposed that the
stochastic differentiation mechanism involves the build up of DNA binding protein(s) relative to their DNA template to generate a commitment point involving an auto-regulatory loop [2]. The aim of the present study was to identify potential DNA binding factors and nucleotide motifs that could play a role in this differentiation model.
To search for motifs and DNA binding factors associated with stage differentiation, expres-sion data representing the sporozoite stage, a macroschizont (Day 0) to merozoite stage (Day 9) differentiation time-course, and piroplasm stage was generated. Comparative analysis pro-duced two sizeable lists of genes up- or down-regulated during differentiation to the merozoite
(152 and 115 at FDR<0.05, respectively). Both lists contained genes predicted from previous
studies. For example, genes encoding rhoptry proteins, Tams1 [4] and cysteine proteinases [43] were defined as up-regulated whereas members of the TashAT and SVSP encoding gene families, implicated in establishment of the proliferating macroschizont-infected cell [36,37], were identified as down-regulated during differentiation to the merozoite.
Several general observations could be made from the temporal expression patterns. Firstly, genes expressed at a high level in one stage were often indicated as expressed at a low level in the preceding or subsequent stage. This supports previous studies reporting that merozoite genes are expressed at the macroschizont stage [4], and that a low level of non-stringently
regu-lated mRNA expression operates inT.parva[44]. Thus, repression of gene expression in a
stage-specific manner at the mRNA level is unlikely to be absolute inTheileria. The data also
indicated differences in the pattern of expression for distinct genes across the differentiation (merogony) time-course, implying regulation of gene expression via multiple factors that
Fig 7. Expression ofTA11145(TaAP2.me1) is significantly higher in the D7 cell line compared to a cell line that has lost the ability to differentiate to the merozoite.A. QRT-PCR data plotted as fold change in elevated expression (log2) for ApiAP2 domain encoding genes TA11145 and TA07100 in the differentiation
competent D7 cell line versus the attenuated D7B12 cell line. Fold change in expression between cell lines was computed at Day 0 (macroschizont) and Day 4 and Day 7 points of a time-course of differentiation to the merozoite;*denotes significant (P value0.05) fold change elevated expression in D7 vs D7B12.
operate in a temporal order. Similar results have been reported for related Apicomplexa [9,33,45] and cascades of transcriptional regulators proposed for these systems are likely to
operate forT.annulata.
Recent studies on DNA binding proteins have provided strong evidence of their
involve-ment in the regulation of Apicomplexan stage-differentiation events. TheT.annulata
microar-ray data was therefore screened for predicted DNA binding proteins that showed differences in expression level between macroschizont and merozoite stage. Genes encoding four putative AP2 domain DNA binding proteins were found to show elevation of mRNA levels between macroschizont and merozoite.
Comparison of the four up-regulatedT.annulataAP2 domain amino acid sequences with
the orthologous domains inPlasmodiumorCryptosporidium(TA12015) showed that there
was greater identity for orthologues across genera than between these four paralogous domains
withinT.annulata. This allowed prediction that each of the four domains bound different
tar-get motifs. In addition, consensus motifs bound by the AP2 domains inPlasmodiumor
Crypto-sporidiumwere predicted for the orthologous domain inT.annulata. EMSA performed with
fusion protein domains encoded byTA11145,TA13515andTA16485demonstrated that this
prediction was valid. Based on previous studies [9,39,40] this does not mean that the AP2 fac-tors from different genera operate to control gene expression in the same life-cycle stage or reg-ulate the same genes, because orthologous domains across genera have been shown to target
different gene sets. Our results for domains encoded byTA13515andTA11145, however, do
show parallels with data obtained for their orthologues inPlasmodium.
The direct orthologue of the AP2 domain encoded byTA13515inPlasmodiumis the
domain of the AP2-G factor that is essential for commitment to gametocyte production [13,14]. The AP2 domain of AP2-G shows a high degree of conservation with the domain
encoded byTA13515(92% identity) and binds the motif GxGTACxC. As expected, the
Thei-leriaAP2.g domain specifically bound the GxGTACxC motif. This motif is enriched in the
upstream region of genes up-regulated from merozoite to piroplasm stage inT.annulata, with
no enrichment in any other subset of stage-regulated genes. Furthermore, in a similar manner toPlasmodiumAP2-G, a GTAC core motif is present in three copies (one double motif) in the
upstream region of the TaAP2.g gene (TA13515) andT.parvaorthologue (TP02_0497),
indi-cating putative auto-regulation of gene expression. A role in regulating gene expression as the parasite differentiates into the piroplasm stage is highly likely. The piroplasm stage has been postulated to be equivalent to gametocytes and it is known that a sexual phase occurs within the tick [46]. Thus, as recently suggested, orthologues of AP2-G could contribute to sexual stage switching across vector borne Apicomplexa and provide a target for transmission block-ing strategies [47]. AP2-G expression and gametocytogenesis has been associated with a stress
response inPlasmodium[48]. The expression profile obtained forT.annulata, however,
indi-cates that up-regulation is primarily liked to developmental events. This conclusion is sup-ported by demonstration of significantly elevated expression in the D7 cell line vs D7B12 cell line when both lines were cultured for 7 days at 41°C (S9 Fig).
The AP2 domain encoded byTA11145(TaAP2.me1) is the orthologue of the
PF3D7_0802100 (MAL8P1.153) domain inP.falciparumand TGME49_071030 inT.gondii
[39], and domain orthologues with high identity are present inBabesia(Fig 3). Our findings
allow postulation thatTA11145is a key regulator of stochastic commitment to merozoite
pro-duction inT.annulata. The gene is expressed at the RNA level at the preceding stage of the
life-cycle and shows significant elevation during the differentiation time-course. Moreover, expression is significantly reduced in a cell line that has lost the ability to differentiate to the
merozoite. Motifs recognised by the AP2 domain encoded byTA11145are the (A)CACAC(A)
the non-coding region of the genome, but showed evidence of being enriched in the upstream IGRs of genes up-regulated during merogony, while depleted in upstream regions of
down-reg-ulated genes. The motif type is also over-represented in non-coding regions of thePlasmodium
andToxoplasmagenomes [31,49,50], but was observed to be associated with a large group of genes expressed during the middle to later stages of the Intra-erythrocytic Developmental
Cycle (IDC) ofP.falciparum[50]. In addition, this motif type is recognised by two AP2 factors
critical for regulation of tachyzoite to bradyzoite conversion inT.gondii[11,12], one of which
possess a AP2 domain that is the orthologue of the domain encoded byTA07100inT.annulata
andPF3D7_0420300(PFD0985w.D1) inP.falciparum[39]. The motif may have a general role in genome organisation associated with differential gene expression, possibly acting as a site for accessory factors that modulate chromatin structure.
InPlasmodium, four AP2 domains have been shown to recognise (A)CACAC(A) type motifs, three of which are closely related to each other [9]. Expression of the genes encoding
these three domains occurs at different points of the IDC, and two (PF3D7_0802100and
PF3D7145600) are predicted to auto-regulate [9]. Based on phylogenetic analysis, a similar
sit-uation exits forTheileria, with at least two domains (encoded byTA11145andTA07100)
dis-playing a level of similarity to theirPlasmodiumorthologues that indicates binding to the same
or similar motif. Auto-regulation is predicted forTA07100andTA11145(and potentially
TA02615). However, since there is only one (A)CACAC(A) motif upstream ofTA07100
rela-tive to seven inTA11145there is a much stronger prediction of auto-regulation forTA11145.
Auto-regulation of this gene was supported by demonstration that the encoded AP2 domain binds specifically to a probe representing a double (A)CACAC(A) type motif present in the
upstream IGR. Multiple auto-regulatory sites were also reported forP.falciparum AP2-G[13].
One possibility is that these sites generate and/or detect a gradient of DNA binding factor that influences when a commitment event will occur. It is known that double motifs allow higher interaction affinities and slower dissociation of DNA binding proteins [51].
Multiple domains that recognise (A)CACAC(A) type motifs allow speculation that different AP2 factors could bind to the same promoter and potentially compete for binding if co-expressed. Indeed, the TA11145 AP2 domain can bind to the motif predicted for the TA07100
domain (S10 Fig). In addition, the data of Campbellet al. [9] indicate that individual domains
bind to variants but show greater affinity to their preferred motif. The expression patterns of
genes inT.annulataencoding AP2 domains that are predicted to bind (A)CACAC(A) motifs
overlap during differentiation to the merozoite (seeFig 2), with TA11145 showing significant
up-regulation relative to TA07100. These findings support the previous stochastic model of
dif-ferentiation forT.annulata[2], where a functional overlap between regulatory factors of
differ-ent life-cycle stages was predicted. In an update of this model, we propose that low-level expression of merozoite genes involves regulation by macroschizont (AP2) factors that bind to
(A)CACAC(A) motifs in the upstream region ofTA11145. Thus expression ofTA11145at the
macroschizont stage may be influenced by a stoichiometric relationship between competing factors that bind to (A)CACAC(A) motifs and promote low (repressed) or elevated (activated) gene expression. Following placement at 41°C, an elevation in protein levels relative to DNA
template occurs and generates a skewed increase inTA11145expression over time via an
auto-regulatory loop. This loop would be promoted by preferential binding of the AP2 domain
encoded byTA11145to multiple (A)CACAC(A) sites in its own upstream region. One
predic-tion of the model is that the relative level of competing factors would differ between parasite lines attenuated or competent for a stage-differentiation event. This appears to be the case for genes encoding AP2 domains that bind the (A)CACAC(A) motif, with a significant increase in
the level ofTA11145expression, relative toTA07100, in an infected cell line that is able to
Further experimental data are required to validate, refute or modify the above model. Nev-ertheless, it could account for a number of findings common across stage-differentiation events of different Apicomplexan genera. These include, low level expression of genes in the life-cycle
prior to the stage where they are expressed at a high level [4,12–14]; a gene expression profile
that is intermediate between two stages that may be reversed or progressed, depending on cul-ture conditions [3,4,16,52,53]; evidence for multiple DNA-binding proteins that bind to related motifs and show a temporal order of expression linked to stage-differentiation [9,11,12]; and parasite lines with marked, quantitative differences in their potential to undergo a stage-differ-entiation event [4,11,13,42,54]. It should be noted though that even if a common mechanism operates across genera, it is unlikely that the target genes regulated during stage differentiation steps will be necessarily conserved.
Recognition of closely related binding motifs by multiple DNA binding proteins shared across genera operates to regulate developmental gene expression in higher eukaryotes, with auto-regulation and competition for binding sites evident [55]. For example, the double GATA motif upstream of the GATA-1 gene that is required for developmental expression is first bound by GATA-2 to initiate expression of GATA-1, followed by preferential GATA-1 binding and auto-regulation via the same motif [51,56,57]. Thus, we propose that competition between related DNA binding proteins can determine whether an Apicomplexan parasite stays at the same life-cycle stage or progresses to the next, and may be a remnant of an ancestral stochastic mechanism of cellular differentiation retained in both lower and higher eukaryotes.
Supporting Information
S1 Table. List of biotinylated oligonucleotide probes used in EMSA.Motifs predicted forT.
annulataAP2 binding domains are in bold, mutated motifs are underlined. (PDF)
S2 Table. List of top 100 genes displaying elevated expression level from macroschizont (Day 0) to merozoite stage (Day 9) identified by RP analysis of microarray data (FDR<0.05).
(PDF)
S3 Table. List of top 100 genes displaying reduced expression levels from macroschizont (Day 0) to merozoite stage (Day 9) identified by RP analysis of microarray data
(FDR<0.05).
(PDF)
S4 Table. Differential expression of TaApiAP2 genes between infected cell lines, D7 versus the D7B12 line that is attenuated for differentiation to the merozoite.Differential
expres-sion between cell lines was identified by RP analysis of microarray data (FDR<0.05). Genes
encoding AP2 domains predicted to bind (A)CACAC(A) motifs are highlighted with a blue bar.
(PDF)
S1 Fig. QRT-PCR analysis of TA15705 gene expression, plotted as fold change in expres-sion relative to the Day 0 (macroschizont) at Day 4, Day 7 and Day 9 (merozoite), and piro-plasm stage;
significant difference (P value0.05) relative to Day 0 (macroschizont stage).
(PDF)
Regions of predicted secondary structure are indicated above the alignment and were predicted
with Phyre2using three independent secondary structure prediction programs: Psi-Pred [58],
SSPro [59] and JNet [60].identity,:. similarity.
(PDF)
S3 Fig. Correlation plots of expression of ApiAP2 domain-encoding genes and putative tar-get genes.ApiAP2 gene expression profile is shown in red, while the average profile of putative
target genes possessing the motif bound by theP.falciparumorthologous domain are shown in
blue, a significant Pearson correlation coefficient value is indicated for each plot. (PDF)
S4 Fig. EMSA performed with 0.7μg of purified GST-TA16485D (TaAP2.me3) and 20 fmol of biotin-labelled double stranded oligo probe containing the core TCTATA motif bound by the orthologous domain (PF3D7_1239200) inP.falciparum: lane 1, probe only; lane 2, probe + GST-TA16485D; lane 3, probe + GST-TA16485D + cold competitor (2 pmol); lane 4, probe + GST-TA16485D + competitor (4 pmol).
(PDF)
S5 Fig. EMSA performed with GST-TA12015D (TaAP2.me2) fusion protein and 20 fmol of biotin-labelled probe (ATTGTTAATTCCCCATCCAGATCTATAAAA) representing the core motif TCCCCAT (C-box/G-box): lane 1, probe only; lane 2, 0.6 g of fusion protein + probe; lane 3, 0.9μg of fusion protein + probe; lane 4, 1.2μg of fusion protein + probe; lane 5, 1.6μg of fusion protein + probe.
(PDF)
S6 Fig. EMSA performed with probe representing the double (A)CACAC(A) motif upstream of gene TA11145: lane 1, probe only; lane 2, probe + nuclear extract generated from uninfected BL20 cells; lane 3, probe + PNE from D7 culture Day 9 of differentiation to merozoite time-course.Letters denote shift positions detected in both infected and unin-fected cells at Day 0 (37°C), shift B was only detected in extracts derived from inunin-fected cells undergoing merogony (Day 9, 41°C).
(PDF)
S7 Fig. Intergenic region upstream of the protein-encoding region of TA11145: (A) CACAC(A) motifs are highlighted in red, motifs spatially conserved in the IGR of theT. parvaorthologue (TP04_0872) are in bold; the probe used for the EMSA is underlined. (PDF)
S8 Fig. Alignment of ApiAP2 domain encodedby TA07100with orthologous domains identified by BLAST analysis fromT.parva,T.orientalis,B.bovis, andP.falciparum: strong conservation of the domain across the related species (98% and 100% identity) and genera (91% identity, 96% similarity withB.bovis; 78% identity, 91% similarity withP. fal-ciparum) is apparent.The domain inP.falciparumhas been shown to bind an (A)CACAC(A) type motif. Regions of predicted secondary structure are indicated above the alignment and
were predicted with Phyre2using three independent secondary structure prediction programs:
Psi-Pred [58], SSPro [59] and JNet [60].
identity,:. similarity. (PDF)