1
Capital structure determinants of hospitality sector SMEs
Luís Pacheco
Portucalense University – Department of Economics, Management and Computer Sciences, room 201 Rua Dr. António Bernardino de Almeida, 541-619, 4200-072 Porto – Portugal
luisp@upt.pt
Fernando Tavares
Portucalense University – Department of Economics, Management and Computer Sciences, room 203 Rua Dr. António Bernardino de Almeida, 541-619, 4200-072 Porto – Portugal
2
Capital structure determinants of hospitality sector SMEs
ABSTRACT
The main objective of this paper is to study the capital structure determinants of SMEs in the hospitality sector and how this can influence their level of indebtedness. Using panel data methodology and considering a sample of 43 Portuguese hotels we study the capital structure determinants between 2004 and 2013. The paper intends to examine the indebtedness level in light of the two main theories – the Trade-off theory and the Pecking Order theory. We chose the hospitality sector because of its importance in the Portuguese economy and because this particular sector has hardly been studied. In addition to total indebtedness, we extend the literature by analyzing the differences between short-term and long-term indebtedness. The results obtained suggest that profitability, assets tangibility, firm dimension, total liquidity and risk are key factors affecting the capital structure of hospitality sector SMEs, while growth, other tax benefits and age were not deemed relevant. These results allow us to conclude that Trade-off and Pecking Order theories should not be considered in isolation to explain the capital structure of hospitality sector SMEs.
Keywords: Capital Structure, Small-to-medium sized enterprises, Hospitality industry, Pecking Order theory, Trade-off theory, Panel data estimation.
1. Introduction
Small and medium enterprises (SMEs) are commonly referred to as the backbone of the economy, the Portuguese case being no exception. One of the main problems reported by Portuguese SMEs is how to finance their activity, being largely dependent on banks. Nevertheless, following Basel III regulations, banks need to better scrutinize their lending activity in order to compute minimum capital requirements which, allied to the economic downturn and the need to deleverage, lead banks to reduce their lending activity, in particular towards SMEs. Thus, SMEs’ capital structure is affected by that factor. SMEs play a critical role in the global economy, as suppliers of employment and key agents for local and regional communities’ well-being. The role of these firms ultimately depends on the flexibility they have to undertake entrepreneurial strategies and promote innovation.
The objective of this paper is to study the capital structure determinants of the Portuguese hospitality sector SMEs and the way those determinants could influence their indebtedness levels. According to Tsai, Pan and Lee (2011), the hospitality sector has been little researched in terms of capital structure, so we extend the literature by analyzing the determinants of short and long-term indebtedness from a sample of hotel firms, covering the period from 2004 to 2013. Also, our paper extends the literature since it is focused on SMEs pertaining to the Portuguese hospitality sector, a sector strongly affected by the recent economic downturn. Albeit being a purely quantitative paper, we should not disregard the determinant role played by qualitative variables on our research question. The importance of a confidence relation between banks and firms was a factor strongly highlighted by several bank managers contacted by the authors when writing this paper. We will return to this question in the conclusions.
The next section presents an introduction to this issue and a literature review. The third section discusses the importance of SMEs in the overall economy and reasons to study the hospitality sector, and section four presents the hypothesis to be tested. The following sections present the data and methodology used
3
and the results, with the final section presenting a discussion about the results and some concluding remarks.
2. Review of the relevant literature
Following the seminal paper from Durand (1952) about costs of capital for business, capital structure theory had its debut with a paper from Modigliani and Miller (1958) which developed a theoretical model concluding that a firm’s capital structure is irrelevant to its value, asserting that a firm consists of a set of assets representing a certain capacity to generate returns, at a certain risk that determines the cost of capital.
In a later approach, Modigliani and Miller (1963) acknowledged that their previous model was based on a set of unrealistic assumptions, considering now the effect of taxes and the risk of debt on capital structure. The introduction of the tax effect, which originated the development of the Trade-off theory of capital structure, had implications on the determination of the firm market value. That is, indebtedness brings a tax benefit that allows the firm to increase its value because interest paid is deductible. The approach made by Modigliani and Miller (1963) about the importance of indebtedness on the firm capital structure allowed an approximation to a traditional view. If for the authors the effect was essentially the result of the maximization of tax profits generated by the usage of debt capital, for the traditionalists it was the result of financial leverage. So, Modigliani and Miller (1963) explained that the maximization of the firm value occurs when assets are totally financed by debt, ceteris paribus.
DeAngelo and Masulis (1980) included the effect of other tax benefits besides debt in the firm’s capital structure analysis and held that the tax advantages given by indebtedness are limited, considering the model from Miller (1977) as unrealistic and excessively sensitive to changes in tax laws. Also, according to Myers (1984), as the firm increases its indebtedness it also increases its tax benefits and financial difficulties, so that the firm has to find a point of indebtedness that maximizes its value. According to the model from Myers (1984), the indebtedness level is limited by the costs of an eventual financial difficulty, that is, the market value of the firm is an increasing function of the tax benefits generated by indebtedness until a point where doubts begin to be raised concerning the firm’s financial health and bankruptcy costs begin to be high.
Jensen and Meckling (1976) provided a relevant contribution to the capital structure theme with the agency costs theory, discussing the tax effects and the risk from indebtedness. These authors depart from the agency relationship, that is, when someone is brought in to manage then other costs could arise. Those costs result from a conflict between shareholders and managers, mainly because managers could act according to their personal interests, possibly manipulating and hiding relevant financial and strategic information from shareholders, instead of trying to maximize firm value.
Jensen (1986) observed that these situations occur when there are excessive free cash flows, that is, there is available cash after financing all the projects, thereby increasing manager’s tendency to spend the available resources in sumptuary goods or projects that will not reward the invested capital. Ross et al (2011) found that the behavior of shareholders and the risks incurred by the debt owners can prevent greater financial leverage. When a firm uses capital from third parties conflicts arise between
4
shareholders and creditors, those conflicts are aggravated when the firm goes through greater financial difficulties. Myers and Majluf (1984) found that managers possess information that it is not known by the market, due to the fact that insiders have information about the firm’s investment opportunities that is unknown to external investors.
The controversies around the Trade-off theory lead to the development of the Pecking Order theory which had its roots in papers from Myers and Majluf (1984) and Myers (1977 and 1984). This theory of capital structure was the result of the presence of asymmetrical information between “inside” managers and “outside” investors, asserting that the firm should use debt to finance established assets and stocks to finance new growth opportunities.
Myers and Majluf (1984) state that the Pecking Order theory consists of a hierarchical sequence of financing decisions, that is, firms first use internally generated (self-financing) funds to finance their investments, only resorting to external financing when those funds are not enough, first preferring loans and then stock issuance. According to Myers (1984), firms prefer internal financial resources, adjusting their dividend policies to their investment opportunities, with the objective to avoid sudden changes in dividend payments.
According to Myers (1984), firms with a higher capacity to generate results have lower levels of debt capital, not because of a policy of low indebtedness but because they do not need to resort to external resources. On the contrary, unprofitable firms tend to issue debt because the ability to generate funds internally is not sufficient to meet their investments (Rajan and Zingales, 1995).
3. Relative importance of SMEs
According to the Commission Recommendation 2003/361/EC of 6th May (Decreto Lei nº. 372/2007 in Portugal) the definition of micro, small and medium-sized enterprises is as follows:
1. The category of micro, small and medium-sized enterprises (SMEs) is made up of firms which employ fewer than 250 persons and which have an annual turnover not exceeding EUR 50 million, and/or an annual balance sheet total not exceeding EUR 43 million.
2. Within the SME category, a small enterprise is defined as a firm which employs fewer than 50 persons and whose annual turnover and/or annual balance sheet total does not exceed EUR 10 million.
3. Within the SME category, a microenterprise is defined as a firm which employs fewer than 10 persons and whose annual turnover and/or annual balance sheet total does not exceed EUR 2 million.
In spite of the harsh economic situation, with the intensification of the euro zone sovereign debt crisis, in 2012 SMEs maintained their position as the backbone of the European economy. Representing 99.8% of all firms, which corresponds to about 20 million firms, SMEs employ approximately 86.8 million people and are responsible for over half of the privately generated Gross Value Added (GVA) in Europe. Also, micro-firms, defined as those with less than 10 workers account for 92% of the non-financial firms. In Portugal, according to the National Statistics Office - INE (2014), SMEs are the main drivers of employment creation and are recognized as a pillar of the national economy. In 2012, and according to INE, 99.9% of the firms were SMEs, 95.9% of which were micro-firms. Although large firms are responsible for over 40% of the turnover and GVA, SMEs account for about 78% of employment.
5
Compared with the previous year we observe reductions of 6.5%, 7.9% and 9.9% in terms of number of firms, employment and turnover, respectively.
3.1.Why study the hospitality sector?
Empirical efforts on factors influencing capital structure have shown that industry classification could be a relevant factor (Hall et al, 2000 and Abor, 2007). For this type of research it is better to study a particular sector in order to control possible idiosyncrasies of different industries. The intensive capital nature of hospitality sector firms influences their capital structure, probably due to the high levels of fixed costs, invariant with turnover. That risk exposure could lead firms to prefer internal sources of funds, using debt only after the exhaustion of internal funds. Thus, the sector may follow the Pecking Order theory. On the other hand, the same capital intensity allows the availability of fixed assets that serve as collateral against debt, so that hospitality firms could follow the Trade-off theory in terms of capital structure. Although capital structure determinants are well documented, there are few papers about the capital structure of firms in the hospitality industry. Some exceptions are Sheel (1994), Kim (1997), Upneja and Dalbor (2001), Dalbor and Upneja (2002 and 2004), Madan (2007), Such et al (2009), Karadeniz et al (2009), Devesa and Esteban (2011), Dewally et al (2013), Lee and Dalbor (2013) and Farcnik et al (2015). Sheel (1994) examines the potential determinants of debt used by hotel and manufacturing firms. Upneja and Dalbor (2001) and Dalbor and Upneja (2002) examine the use of debt by domestic restaurant firms and find key determinants to be firm size, age and firm risk (positive) and growth opportunities (negative). Debt is used by larger and older firms as an effective monitoring agent to help reduce agency costs. On the other hand, restaurant firms with large growth opportunities may choose less debt because of the Pecking Order theory. Further research by Dalbor and Upneja (2004) found a positive relationship between growth opportunities and total debt for domestic lodging firms. Hua et al (2012) and Hua et al (2013) provide empirical evidence that certain characteristics are critical in explaining profitability and outperformance of US lodging and public restaurant firms. So, the results of these studies indicate that hospitality sector may not be homogeneous in terms of capital structure choice. With respect to Portuguese firms in general, there are few papers published using firm-level financial data to study the capital structure determinants [some examples are Gama (2000), Vieira and Novo (2010), Antão and Bonfim (2012), Serrasqueiro and Nunes (2011 and 2012) and Pastor and Gama (2013)]. To the best of our knowledge the Portuguese hospitality sector has only recently been the object of such a study (Serrasqueiro and Nunes, 2014), a factor which motivates the present research. Employing a rather different methodology from the one used in this paper, and considering a much less recent time period, Serrasqueiro and Nunes (2014) concluded that the Pecking Order and Trade-off theories are not mutually exclusive in explaining the capital structure decisions of SME hotels.
According to INE (2014), the Portuguese hospitality sector (CAE 55 and 56 – “Alojamento, Restauração e similares”) represents 7.8% of the total number of firms (83.103), of which 99.9% are SMEs, and of those 95.6% are micro and only 0.4% are medium enterprises. SMEs employ 88.6% of the sector total. Table 1 illustrates a comparison of some main financial and economic indicators for the total numbers of Portuguese SMEs and for the particular case of the hospitality sector in 2004 and 2012:
6
A simple analysis of these numbers shows a struggling sector, presenting now higher levels of debt and lower profitability. Notice that in 2012 the hospitality sector, in comparison to total SMEs, presents weaker values for all the ratios, particularly in terms of turnover per employee and profitability. Also, the ratios decreased steadily between 2004 and 2012. The return indicators for the hospitality sector were always negative during the considered period.
In relation to demographic data, according to INE (2014), in 2012 the sector witnessed the birth of 10,582 new enterprises, which contrasts with 5,701 SME deaths registered in 2011. The birth rate in the sector is in line with the national global average. Considering micro enterprises, the birth and death rates are both higher than the national average. These facts make the sector decidedly responsible for the creation, and also the destruction, of employment opportunities.
4. Capital structure determinants
The main theories that support the capital structure determinants are the Pecking Order and the Trade-off theories. Our hypothesis will be formulated according to the principles underlying those two theories in order to achieve a homogeneous exposure of the hypothesis to be tested, albeit different empirical works present some conflicting results.
The hypotheses to be tested are the following:
H1: Profitability is negatively related to debt, ceteris paribus.
According to the Trade-off theory more profitable firms should use more debt in order to benefit from the interest tax deduction (Modigliani and Miller, 1963), thus suggesting a positive relationship between profitability and indebtedness because firms with a greater capability to create and maintain results have a greater bargaining power and thus should be more attractive when resorting to external financing (Harris and Raviv, 1991; Jang et al 2008).
On the contrary, Pecking Order theory assumes that when firms need to finance, their investments have a hierarchic preference when choosing financing sources. Accumulated results are used first, then third party resources, then indebtedness and, lastly, the issuance of new stocks. More profitable firms will have better conditions to self-finance and a lower need to raise debt (Myers, 1984 and Myers and Majluf, 1984), so that the Pecking Order theory predicts a negative relationship between indebtedness and profitability.
SMEs resort mostly to Pecking Order theory since agency conflicts between managers and shareholders are less relevant (Degryse et al 2012). In our study, the hypothesis is based on Pecking Order theory and we expect to obtain a negative relationship between hotels’ profitability and indebtedness, like those found in the empirical studies of Antão and Bonfim (2012), Bastos and Nakamura (2009), Degryse et al (2012), Serrasqueiro and Nunes (2011, 2014) and Vieira and Novo (2010).
7
H1.1: Profitability is negatively related with short-term debt, ceteris paribus. H1.2: Profitability is negatively related to long-term debt, ceteris paribus.
Short-term and long-tem indebtedness can be distinctively affected by profitability. Abor and Biekpe (2009) show that profitability is mainly negatively related with long-term debt, but concluded that it is also related with short-term debt. To Michaelas et al (1999), the effect of profitability on long-tem indebtedness is more relevant than on short-term indebtedness. Those authors argue that when SMEs possess sufficient internal resources, resorting to long-term debt decreases, choosing short-term financing instead. That supports the SMEs’ preference for current liabilities, because short-term debt can be easily repaid and leads to higher interest rates.
H2: Assets tangibility is positively related to debt, ceteris paribus.
According to the Trade-off theory there is a positive relationship between asset tangibility and indebtedness, where the greater the tangible asset value the greater the indebtedness, because those act as collateral in case the firm enters a bankruptcy process (Harris and Raviv, 1991).The existence of collateral reduces agency costs and the problems of information asymmetry (Jensen and Meckling, 1976; Ross et al, 2011). Pecking Order theory also predicts a positive association, because firms which have collateral make their creditors feel more comfortable financing their investments and their financial costs are also lower (Myers and Majluf, 1984). Abor and Biekpe (2009) observed that SMEs with lower asset value tend to have more difficulties in access to financing. Also Vieira et al (2013) found that asset value positively influences the level of indebtedness, concluding that the higher the asset value, the higher would be the level of credit granted. Thus, since assets are accepted as collateral, a positive relationship between assets tangibility and indebtedness is expected. However, Poornima and Manokaran (2012), Serrasqueiro and Nunes (2011) and Vieira and Novo (2010), concluded that there is a negative relationship between tangible assets and debt.
H2.1: Assets tangibility is negatively related with short-term debt, ceteris paribus. H2.2: Assets tangibility is positively related with long-term debt, ceteris paribus.
Firms in the hotel industry are characterized by a high level of fixed assets, which provide collateral to creditors but, on the other hand, a high level of demand volatility and a high level of capital intensity may increase the firm’s risk, implying less recourse to indebtedness (Serrasqueiro and Nunes, 2014, p. 100). Kwansa et al (1987) tried to prove a positive relation in the lodging industry of the United States and did not obtain significant empirical results. Also, tangible assets, as mentioned earlier, can affect long and short-term financing differently. Brito et al (2007) found a negative relationship for short-term debt and a positive relationship for long-term debt. However, the relationship between permanent assets and total debt was negative, which goes against expectations. Thus, firms with higher assets tangibility have lower levels of financing but are more indebted in the long-term than in the short-term. Also, Michaelas, et al (1999) and Vieira and Novo (2010) found a negative relationship to short-term indebtedness and a positive relationship for the long-term. Despite that, in the paper by Vieira and Novo (2010), long-term debt was not statistically significant.
8 H3: Growth is positively related to debt, ceteris paribus.
Miller (1977) argued that firms with higher growth rates could not optimize their investments, possibly causing lenders to become unwilling to finance them. According to the Trade-off theory, access to finance would be more limited for these firms, with a negative relationship between growth and indebtedness (Jensen, 1986 and Elgonemy, 2002). In contrast, the Pecking Order theory predicts a positive relationship between growth and debt, because firms with higher growth rates experience more financing needs. So, if their ability to generate and maintain internal funds becomes insufficient to meet their needs that will lead a firm to turn to external sources to finance its growth (Myers, 1984 and Myers and Majluf, 1984). Ramalho and Silva (2013), who followed the Pecking Order hypothesis, considered that firms with higher growth rates rely more on debt capital, since they do not possess sufficient internal funds for financing and want to avoid the costs of issuing new equity. Michaelas et al (1999), Brito et al (2007), Abor and Biekpe (2009), Vieira and Novo (2010) and Poornima and Manokaran (2012), considered that growth is related with the asset or turnover growth rates, thus expecting a positive effect on debt. In our paper the hypothesis rests on the assumptions of the Pecking Order theory.
H3.1: Growth is positively related to short-term debt, ceteris paribus. H3.2: Growth is positively related to long-term debt, ceteris paribus.
Abor and Biekpe (2009) concluded that growth is positively related to long-term debt, since firms with higher growth rates need more external financing. However, financing opportunities could generate conflicts between managers and lenders, so to avoid these costs SMEs resort to short-term debt. For Brito et al (2007) growth also showed a positive relationship with long-term and total debt. Finally, Michaelas et al (1999) found a positive link between growth and short-term debt. Yet, Vieira and Novo (2010) did not obtain any statistically significant relationship.
H4: Size is positively related to debt, ceteris paribus.
The two main theories argue that there is a positive association between size and debt. According to the Trade-off theory, larger firms tend to be more diversified and have lower probability of bankruptcy. Also, due to lower information asymmetry larger firms have easier access to capital markets and pay lower interest rates, thus having a greater incentive to increase their debt capital (Fama and French, 2007). There are several studies finding a positive relationship between size, given by the logarithm of total assets, and total debt, not only for larger firms but also for SMEs (Michaelas et al, 1999; Frank and Goyal, 2003 and 2009; Brito et al, 2007; Fama and French, 2007; Abor and Biekpe, 2009; Vieira and Novo, 2010 and Serrasqueiro and Nunes, 2011). Some examples applied to the hospitality sector are Dalbor and Upneja (2004); Devesa and Esteban (2011) and Serrasqueiro and Nunes (2014).
H4.1: Size is negatively related to short-term debt, ceteris paribus. H4.2: Size is positively related to long-term debt, ceteris paribus.
Bastos and Nakamura (2009) reported that larger firms are more able to obtain long-term debt, due to their lower risk, lower probability of bankruptcy and lower financing costs. On the other hand, for
short-9
term debt they found a negative relationship, indicating that smaller firms rely more on short-term debt since their internal funds are insufficient to finance growth. Michaelas et al (1999) also concluded that there is a negative link between size and short-term financing, suggesting that smaller firms resort less to long-term debt due to the higher transaction costs they face. Brito et al (2007) and Vieira and Novo (2010) found no significant relationship between size and short-term indebtedness, but instead found a positive effect for total and long-term debt.
H5: Total liquidity is negatively related to short-term debt, ceteris paribus.
Bastos and Nakamura (2009) confirmed the Pecking Order theory that predicts a negative relationship between liquidity and indebtedness. Payments are often financed by trade credit, which leads to increased current liabilities. Therefore, the most indebted firms have lower levels of cash (Pastor and Gama, 2013). On the contrary, Michaelas et al (1999) found no significant relationship with long-term debt.
H6: Other tax benefits besides debt are negatively related to debt, ceteris paribus.
The Trade-off theory predicts a negative relationship between Other Tax Benefits (OTB) and indebtedness. DeAngelo and Masulis (1980) justified that correlation, arguing that firms with more depreciations and provisions should reduce the level of debt in their financial structure. Some empirical studies show a negative relationship between OTB and indebtedness (Michaelas et al, 1999; Gama, 2000; Poornima and Manokaran, 2012). However, Vieira and Novo (2010) found a negative relationship with short-term debt and a positive effect with long-term debt. On the contrary, Serrasqueiro and Nunes (2011) found no relationship between OTB and indebtedness. Due to the high level of fixed assets held by the hotel firms, it seems appropriate to expect a negative relation between OTB and debt.
H7: Age is negatively related to debt, ceteris paribus.
According to the Pecking Order Theory, firms increase their capability to retain resources throughout their lifecycle, reducing the need to resort to borrowing in order to finance their investment opportunities. Consequently, younger SMEs are more dependent on debt because retained earnings are not sufficient to meet their investment needs (Myers, 1984; Myers and Majluf, 1984).
Abor and Biekpe (2009) concluded that age is a key factor in accessing finance, since more mature firms have more guarantees to offer banks if they cannot honor their obligations. Ramalho and Silva (2013) and Vieira and Novo (2010) found a negative relationship between the variables. According to these authors, older firms generate sufficient internal resources, and are not so dependent on indebtedness as younger firms. However, Vieira et al (2013) found that the age variable did not yield significant results, concluding that indebtedness is not related to firm maturity.
H7.1: Age is negatively related to short-term debt, ceteris paribus. H7.2: Age is positively related to long-term debt, ceteris paribus.
In our paper, the hypotheses are based on the assumptions of the Pecking Order theory and we follow Serrasqueiro and Nunes (2012) and Vieira et al (2013), where age is measured in years since the incorporation of each firm.
10 H8: Risk is negatively related to debt, ceteris paribus.
SMEs are subject to considerable levels of risk due their dimension and hotel firms in particular are exposed to business risk due to their seasonal activities, economic environment and management skills (Elgonemy, 2002). According to the Trade-off theory, debt is negatively related to risk (Bastos and Nakamura, 2009). To Harris and Raviv (1991), agency costs and bankruptcy costs suggest that risk also influences the capital structure of firms. The Pecking Order theory also predicts a negative relationship between risk and indebtedness, since the greater the risk the greater the likelihood of the firm becoming insolvent. Therefore, risk reduces the firms’ capability to finance and increases their costs (Myers, 1984). In Bastos and Nakamura (2009) long-term debt had a negative relationship with risk, albeit short-term debt presented a positive one. Brito et al (2007) found a positive relationship between risk and debt, both in the long and short-term, which presumes that firms with higher risk are more indebted, thus contradicting the theory. On the other hand, Vieira and Novo (2010) found no statistically significant value for total debt, but obtained a positive relationship between risk and long-term debt, which is positive when bankruptcy costs are insignificant but negative when those costs gain considerable weight in the total costs of the firm. Concerning short-term debt they found a negative relationship.
Different indicators have been used to measure the risk variable. Several empirical studies present divergent results for the relationship between risk and indebtedness because it is difficult to define the parameters to measure that attribute since the costs of financial failure are difficult to estimate. In general, the risk of a firm is in the level of uncertainty regarding its future (Brito et al, 2007; Vieira and Novo, 2010).
This study will measure the risk variable using financial ratios, allowing us to assess how the firm finances itself and manages its ability to fulfill its non-current commitments, and to determine the dependence of the firm towards third parties, namely using the following two ratios: Solvency Ratio (SOR) and Structure Ratio (STR). The solvency ratio aims to assess the firm's ability to fulfill its commitments, reflecting the risk that their lenders support, by comparing the levels of equity invested by the partners with the levels of debt capital applied by lenders. Obeying a principle of prudence, SOR should always have a value greater than or equal to one and should not have values lower than 0.5. The higher the SOR the lower is the risk and the firm will be more able to borrow. Thus, SOR should be positively related to indebtedness. Furthermore, STR is negatively associated with indebtedness because higher values for STR are associated with higher risk for the firm so that it will be less able to get financing.
5. Data and methodology
The analysis of the capital structure in the hospitality sector is relevant for the firm managers because of its influence on growth and profitability (Tsai et al, 2011). In this paper we use a sample of SMEs from the hotel sector and we extend the literature by analyzing the existence of differences between short-term and long-term indebtedness besides total indebtedness.
11
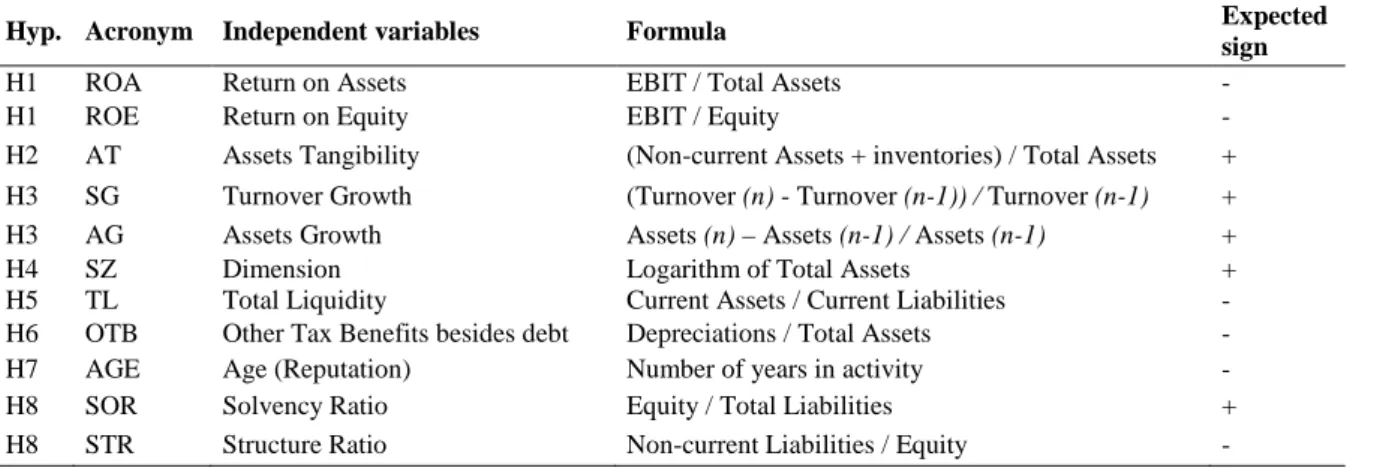
The dependent variables are total debt (Total liabilities / Total assets) and its subdivision in short-term and long-term debt (respectively, Current Liabilities / Total Assets and Non-current Liabilities / Total Assets) and the independent variables represent the firm’s essential determinant factors of its capital structure and are used in order to test the previously stated hypothesis (Table 2).
[Insert Table 2]
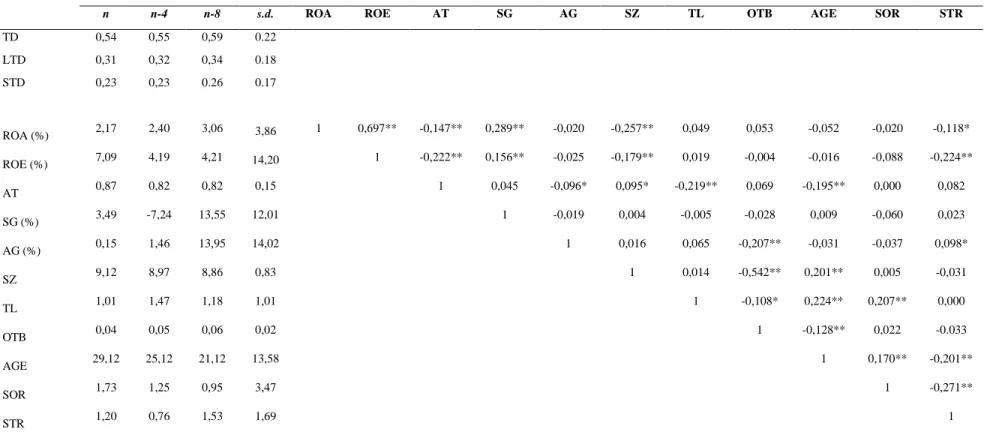
After the identification of the hypotheses to be tested as well as the dependent and independent variables, it is necessary to describe the data collection process for the sample characterization over which our empirical study will be made. Our objective is to analyze a sample of SMEs from the hospitality sector, obtained from SABI, a financial database powered by Bureau van Dijk. Considering only hotels (CAE 55), applying the criteria for SMEs definition, excluding firms with less than 10 employees - because micro firms tend to present gaps in terms of data – and considering a 10 year period of complete data from 2004 to 2013, we obtained a final sample of 43 firms. That sample accounts for 2.479 employees, a turnover around 129 M€ and total assets of 531 M€ in 2013. The firm average age is 29 years (10 have more than 40 years) and the sample is equally distributed between medium (21) and small (22) firms. Before estimating the different models we present some descriptive statistics of the variables. As can be seen in Table 3, in recent years, the indebtedness levels decreased slightly but firms present a deterioration in ROA, asset growth and liquidity ratios, albeit presenting a stable position in terms of solvency and structure. Note also that the values for our sample are better than the aggregate sector’s averages (hotel and restaurant firms presented in Table 1), certainly due to the fact that, on one hand, only the surviving and most robust firms are able to present ten years of complete data in the SABI database being thus presented in our sample and, on the other hand, Table 3 considers only firms from the hotel industry. Table 3 also presents the correlation coefficients between variables. According to Gujarati and Porter (2008), when the correlation coefficients are above 50%, the problem of collinearity becomes significant. Observing the correlation coefficients between the independent variables only in two circumstances the correlation coefficients are above 50%, therefore the problem of collinearity between explanatory variables will not be particularly relevant.
[Insert Table 3]
In order to attain our research objective we apply a panel data methodology, which presents several advantages, namely better effects’ detection and measurement, minimization in sample bias and control of individual heterogeneity (Gujarati and Porter, 2008). Panel data can be estimated trough three different regression models: Pooled Ordinary Least Squares (POLS), Fixed Effects Model (FEM) and Random Effects Model (REM). Applying the Wald, Breusch-Pagan and Hausman tests we will choose the most appropriate regression technique. First, comparing between POLS and FEM, the Wald test states the null hypothesis of the constant terms being all equal. Under the null hypothesis, the efficient estimator is the POLS model, indicating the non existence of a specific effect for each one of the firms. After, the Breusch-Pagan test compares between POLS and REM, where the rejection of the null hypothesis
12
indicates that REM is more appropriate. Finally, the Hausman test compares REM with FEM, where under the null hypothesis the efficient estimator is the REM. If we reject the null hypothesis, the FEM is more appropriate, since the REM would yield biased results.
In order to test the different hypothesis, we perform the following regressions, one for each indebtedness variable (TD, LTD and STD):
Yi,t = β1 + β2ROAi,t + β3ROEi,t + β4ATi,t + β5SGi,t + β6AGi,t + β7SZi,t + β8TLi,t + β9OTBi,t + β10AGEi,t + + β11SORi,t + β12STRi,t + εi,t
Where: Yi,t – Dependent variable (TD, LTD and STD) for the i-th firm in year t;
β – Coefficient to estimate;
Xi,t – Independent variable for the i-th firm in year t;
εi,t – Error describing the non-explained effects on Yi,t.
In the beginning all the independent variables were included but after chosen the most appropriate model the regression was repeated with only the determinants of debt that showed up first as statistically significant.
6. Empirical results
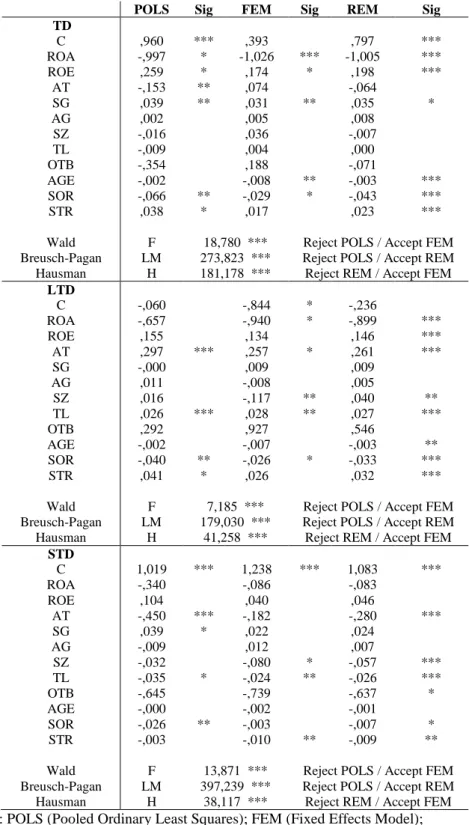
Table 4 presents the results obtained for Pooled OLS (POLS), Fixed Effects Model (FEM) and Random Effects Model (REM) and the different tests to choose the appropriate model. According to the Wald and Breusch-Pagan tests we always reject the Pooled OLS model and according to the Hausman test we reject the random effects model, indicating that the fixed effects model is more efficient.
[Insert Table 4]
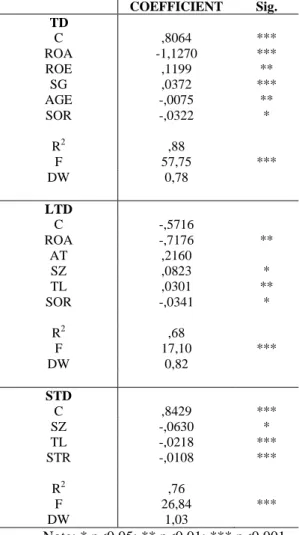
Since the tests reveal that the results under FEM have better explanatory power compared to results under POLS or REM, we estimate again the fixed effects model but selecting only the explanatory variables that showed up as significant in the previous estimation. Table 5 presents the results obtained for TD, LTD and STD.
[Insert Table 5]
Finally, Table 6 presents a comparison between the expected and observed relationships, were we can validate the different hypotheses that are being tested in this empirical study.
13 Hypothesis 1 - Profitability
In our study ROE does not show the expected sign relative to TD, indicating the rejection of the Pecking Order theory. Nevertheless, ROA presents the expected negative sign. Michaelas et al (1999), Bastos and Nakamura (2009), Vieira and Novo (2010), Serrasqueiro and Nunes (2011, 2014), Antão and Bonfim (2012) and Degryse et al (2012) also found a negative relationship between profitability and indebtedness, suggesting that SMEs prefer to finance their assets internally and not externally.
Regarding short-term and term indebtedness a negative relationship was expected but only for long-term indebtedness did we found the expected negative relation.
Hypothesis 2 - Assets Tangibility
Although the observed relation with TD is not statistically significant, only for LTD did we obtained the expected sign, being that result in line with Bastos and Nakamura (2009), Brito et al (2007), Michaelas et al (1999) and Vieira and Novo (2010). In the context of Portuguese hotels, Serrasqueiro and Nunes (2014) also found a positive relationship between assets tangibility and indebtedness.
Hypothesis 3 - Growth
In this study, nor SG nor AG yielded statistically significant results, with the exception of the effect of SG on TD. Therefore, we cannot conclude that there is a positive or negative relationship to TD in the short or long-term. Note that Bastos and Nakamura (2009) and Vieira and Novo (2010) also evidenced no significant results for growth.
Hypothesis 4 - Size
In this study, the SZ variable showed a negative relationship with STD and a positive relationship with LTD, confirming the results found by some other authors (Michaelas et al, 1999; Bastos and Nakamura, 2009). Gama (2000) also found a negative relationship with STD, arguing that SMEs cannot increase their indebtedness level as the firm grows. This negative relationship reinforces the idea of the difficulties that SMEs face in accessing external financing, leading them to mainly obtain short-term debt.
Hypothesis 5 - Total Liquidity
Concerning STD, our results show a negative sign, confirming the conclusions reached by Bastos and Nakamura (2009) and Pastor and Gama (2013), who argue that firms with low levels of liquidity have a preference for short-term debt. Therefore, the negative relationship between STD and TL reveals that, in relative terms, SMEs have more STD to meet their obligations since they have high liquidity problems. For SMEs suffering from the problem of meeting their obligations, there are two ways to mitigate that issue: delay payments to lenders or to some extent increase short-term bank loans.
Hypothesis 6 - OTB
As for OTB, the variable was not deemed as relevant, nor was it considered in the TD, LTD and STD estimations. Thus, we did not confirm the Trade-off theory which defends a negative relationship between
14
OTB and short-term debt. A similar result was found by Serrasqueiro and Nunes (2014), but Serrasqueiro and Nunes (2011) also did not found a significant relationship either for STD or LTD.
Hypothesis 7 - Age
This variable shows a significant relationship with TD so we can conclude that AGE negatively influences total indebtedness. For Vieira et al (2013), the age variable showed no significant results, concluding that financing is not associated with firm maturity.
Hypothesis 8 - Risk
To measure risk two independent variables (SOR and STR) were used. Thus, for risk to be negatively associated with TD, LTD and STD, it is expected that SOR and STR have, respectively, positive and negative signs. However, according to the results, it can be concluded that risk is positively related with debt. These results, although contradicting the two theories, are in line with the results previously obtained by Brito et al (2007), Vieira and Novo (2010) and Devesa and Esteban (2011). So, firms with higher risk, which have more debt, may see their agency costs reduced and probably surpass the expected increase in bankruptcy costs. This association may be sensitive to firm size as lenders continue to finance larger companies although they are more risky.
7. Discussion and conclusions
This paper explores the determinant factors behind the capital structure of the Portuguese hospitality sector SMEs. Several empirical studies hold that the SMEs indebtedness policy can be explained mainly by two theories involving the firm’s capital structure. Those two controversial theories are the Trade-off and Pecking Order theories. So, profitability, assets tangibility, growth, dimension, total liquidity, other tax benefits besides debt, age and risk were used as determinant factors of the capital structure, and its relationship with total, long-term and short-term indebtedness was tested to account the impact on the capital structure.
Based on a sample of 43 SMEs of the Portuguese hospitality sector obtained from the SABI database for a period of 10 years, between 2004 and 2013, and using as methodology the panel data estimation, the results indicate that profitability, assets tangibility, firm dimension, total liquidity and risk are key factors affecting the capital structure of hospitality sector SMEs, while growth, other tax benefits and age were not deemed relevant.
ROE did not show a negative relationship with TD, not confirming the Pecking Order theory. Notwithstanding, ROA showed a negative relationship with TD in accordance with that theory, suggesting that the most profitable firms should use more debt in order to take advantage of the interest tax deductibility. The positive relationship between AT and LTD suggests that SMEs with higher levels of tangible assets resort more to long-term debt, a result that confirms hypothesis (H2.2) and is in line both with the Trade-off and Pecking Order theories.
The size variable showed a negative relationship with STD, contradicting both theories, albeit in accordance with the formulated hypothesis (H4.1), indicating that smaller firms are more leveraged in the
15
short-term. Also, we confirm that hospitality sector SMEs increase the level of long-term debt as they increase in size. In terms of total liquidity we observe the expected negative relationship with STD, confirming the Pecking Order theory. In this study, hospitality SMEs have high levels of short-term debt, which means they have liquidity problems and consequently have difficulties to meet their short-term obligations.
Finally, in terms of risk, we conclude that hospitality firms’ total and long-term indebtedness is associated with factors representative of business solvency and structure (SOR and STR). However, when significant, the signs are contrary to the expected and predicted from both the main theories, suggesting that riskier companies continue to be financed by lenders in order to avoid bankruptcy and of course the losses implied by bankruptcy costs. Devesa and Esteban (2011) found a similar result, arguing that such anomalous behavior could be justified by the progressive undercapitalization registered in the sector. According to those authors, the more expansive formulas that are being developed by the hotel industry, namely seeking financing through capital markets, could indicate that indebtedness can be protected under a different profile than the traditional one. This puzzle highlights the importance of further research linking hospitality firms capital structure with industry specific determinants and the international character of some firms.
Our results provide some insights to characterize hospitality firms’ capital structure but also call for further research. Further research should, inter alia, (i) introduce qualitative variables, for instance, obtained by an interview/questionnaire to the industry and bank managers, allowing to consider problems in terms of access to credit and capture the role played by firm-bank relationships. Considering the traditional dependence on banks of Portuguese firms, the issue of firm-bank relationship could be helpful in explaining the intriguing sign for the risk variable. Exploratory talks with several bank managers revealed that, regarding lending decisions, the focus on the firms’ financial accounts should not obliterate more qualitative aspects related to firm-bank connections and relations; (ii) increase the number of observations and distinguish the sample between micro, small and medium firms; (iii) consider firms from CAE 56 (restaurant sector) besides CAE 55 in order to compare the two industries and its particular idiosyncrasies; (iv) introduce industry specific determinants, namely researching which variables could be specific to Portugal; and (v) consider other factors, such as the quality of management, variables of macroeconomic nature and the organizational characteristics of the firms (e.g., distinguishing between independent versus franchising operations). We expect further research will contribute to finding a specific group of determinants of the hospitality sector SMEs capital structure, offering a clearer view about which data should be considered by managers, entrepreneurs and other stakeholders when analyzing the industry.
In summary, the results of this paper allow us to conclude that the Trade-off and Pecking Order theories are not mutually exclusive in explaining the capital structure of Portuguese hospitality sector SMEs. Those firms are not homogeneous, and both theories are necessary to explaining their capital structure throughout their lifecycle.
16 REFERENCES
Abor, J. (2007), “Industry classification and the capital structure of Ghanaian SMEs”, Studies in Economics and Finance, Vol 24, No 3, 207-219.
Abor, J., and Biekpe, N. (2009), “How do we explain the capital structure of SMEs in sub-Saharan Africa?: Evidence from Ghana”, Journal of Economic Studies, Vol 36, No 1, 83-97.
Antão, P., and Bonfim, D. (2012), “The dynamics of capital structure decisions”, working paper, Economics and Research Department, Banco de Portugal, Lisboa.
Bastos, D., and Nakamura, W. (2009), “Determinantes da estrutura de capital das companhias abertas no Brasil, México e Chile no período 2001-2006”, Revista Contabilidade & Finanças, Vol 20, No 50, 75-94.
Brito, G., Corrar, L., and Batistela, F. (2007), “Fatores determinantes da estrutura de capital das maiores empresas que atuam no Brasil”, Revista Contabilidade & Finanças, Vol 18, No 43, 9-19.
Dalbor, M., and Upneja, A. (2002), “Factors affecting the long-term debt decision of restaurant firms”, Journal of Hospitality and Tourism Research, Vol 26, 422-432.
Dalbor, M., and Upneja, A. (2004), “The investment opportunity set and the long-term debt decision of U.S. lodging firms”, Journal of Hospitality and Tourism Research, Vol 28, No 3, 346-355.
Deangelo, H., and Masulis, R. (1980), “Optimal capital structure under corporate and personal taxation”, Journal of Financial Economics, Vol 8, No 1, 3-29.
Degryse, H., Goeij, P., and Kappert, P. (2012), “The impact of firm and industry characteristics on small firms’ capital structure”, Small Business Economics, Vol 38, No 4, 431-447.
Devesa, M., and Esteban, L. (2011), “Spanish hotel industry: indebtedness determinants”, Applied Economics, Vol 43, No 28, 4227-4238.
Dewally, M., Shao, Y., and Singer, D. (2013), “The liquidity crisis: evidence from the US hospitality industry”, Tourism Economics, Vol 19, No 3, 545-563.
Durand, D. (1952), “Costs of debt and equity funds for business: trends and problems of measurement”, in Conference on Research in Business Finance, National Bureau of Economic Research, 215-262.
Elgonemy, A. (2002), “Debt-financing alternatives: refinancing and restructuring in the lodging industry”, The Cornell Hotel and Restaurant Administration Quarterly, Vol 43, No 3, 7-21.
Fama, E., and French, K. (2007), “The anatomy of value and growth stock returns”, Financial Analysts Journal, Vol 63, No 6, 44-54.
Farcnik, D., Kuscer, K., and Trobec, D. (2015), “Indebtedness of the tourism sector in Mediterranean countries”, Tourism Economics, Vol 21, No 1, 141-157.
Frank, M., and Goyal, V. (2003), “Testing the pecking order theory of capital structure”, Journal of Financial Economics, Vol 67, No 2, 217-248.
Frank, M., and Goyal, V. (2009), “Capital structure decisions: which factors are really important?”, Financial Management, Vol 38, 1-37.
Gama, A. (2000), “Os determinantes da Estrutura de Capital das PME’s Industriais Portuguesas”, Instituto Mercado de Capitais, Porto.
17
Hall, G., Hutchinson, P., and Michaelas, N. (2000), “Industry effects on the determinants of unquoted SME’s capital structure”, International Journal of the Economics and Business, Vol 7, No 3, 297-312.
Harris, M., and Raviv, A. (1991), “The theory of capital structure”, The Journal of Finance, Vol 46, No 1, 297-355.
Hua, N., Nusair, K., and Upneja, A. (2012), “Financial characteristics and outperformance”, International Journal of Contemporary Hospitality Management, Vol 24, No 4, 574-593.
Hua, N., Xiao, Q., and Yost, E. (2013), “An empirical framework of financial characteristics and outperformance in troubled economic times”, International Journal of Contemporary Hospitality Management, Vol 25, No 6, 945-964.
INE (2014), Empresas em Portugal – 2012, Instituto Nacional de Estatística, Lisboa.
Jang, S., Tang, C.-H., and Chen, M. (2008), “Financing behaviors of hotel companies”, International Journal of Hospitality Management, Vol 27, No 3, 478-487.
Jensen, M. (1986), “Agency costs of free cash flow, corporate finance, and takeovers”, The American Economic Review, Vol 76, No 2, 323-329.
Jensen, M., and Meckling, W. (1976), “Agency costs and the theory of the firm”, Journal of Financial Economics, Vol 3, No 4, 305-360.
Karadeniz, E., Kandir, S., Balcilar, M., and Onal, Y. (2009), “Determinants of capital structure: evidence from Turkish lodging companies”, International Journal of Contemporary Hospitality Management, Vol 21, No 5, 594-609.
Kim, W. (1997), “The determinants of capital structure choice in the U.S. restaurant industry”, Tourism Economics, Vol 3, No 4, 329-340.
Kwansa, F., Johnson, D., and Olsen, M. (1987), “Determinants of financial structure in the hotel industry and implications for the teaching of financial management in the hospitality industry”, Hospitality Education and Research Journal, Vol 10, 99-106.
Lee, S., and Dalbor, M. (2013), “Short-term debt and firm performance in the US restaurant industry: the moderating role of economic conditions”, Tourism Economics, Vol 19, No 3, 565-581.
Madan, K. (2007), “An analysis of the debt-equity structure of leading hotel chains in India”, International Journal of Contemporary Hospitality Management, Vol 19, No 5, 397-414.
Marôco, J. (2013), Análise Estatística com o SPSS Statistics, 6ª ed., ReportNumber, Lisboa.
Michaelas, N., Chittenden, F., and Poutziouris, P. (1999), “Financial policy and capital structure choice in UK SMEs: Empirical evidence from company panel data”, Small Business Economics, Vol 12, No 2, 113-130.
Miller, M. (1977), “Debt and taxes”, The Journal of Finance, Vol 32, No 2, 261-275.
Modigliani, F., and Miller, M. (1958), “The cost of capital, corporation finance and the theory of investment”, The American Economic Review, Vol 48, No 3, 261-297.
Modigliani, F., and Miller, M. (1963), “Corporate income taxes and the cost of capital: a correction”, The American Economic Review, Vol 53, No 3, 433-443.
Myers, S. (1977), “Determinants of corporate borrowing”, Journal of Financial Economics, Vol 5, 147-175.
18
Myers, S., and Majluf, N. (1984), “Corporate financing and investment decisions when firms have information that investors do not have”, Journal of Financial Economics, Vol 13, No 2, 187-221.
Pastor, C., and Gama, P. (2013), “Determinant Factors of Cash Holdings: Evidence from Portuguese SMEs”, International Journal of Business and Management, Vol 8, No 1, 104-112.
Poornima, S., and Manokaran, G. (2012), “Capital Structure Analysis of Asset Financing Services Industry in India”, Biz N Bytes: Journal of Applied Management & Computer Science, No 1, 1-19.
Rajan, R., and Zingales, L. (1995), “What do we know about capital structure? Some evidence from international data”, The Journal of Finance, Vol 50, No 4, 1421-1460.
Ramalho, J., and Silva, J. (2013), “Functional form issues in the regression analysis of corporate capital structure”, Empirical Economics, Vol 44, No 2, 799-831.
Ross, S., Westerfield, R., Jaffe, J., and Jordan, B. (2011), Corporate Finance: Core Principles & Applications, 3rd ed., McGraw-Hill Irwin.
Serrasqueiro, Z., and Nunes, P. (2011), “The Capital Structure of Portuguese SMEs: Empirical Evidence using Dynamic Panel Data”, Transformation in Business & Economics, Vol 10, No 1, 62-80.
Serrasqueiro, Z., and Nunes, P. (2012), “Is Age a Determinant of SMEs' Financing Decisions? Empirical Evidence Using Panel Data Models”, Entrepreneurship Theory and Practice, Vol 36, No 4, 627-654.
Serrasqueiro, Z., and Nunes, P. (2014), “Financing behavior of Portuguese SMEs in hotel industry”, International Journal of Hospitality Management, Vol 43, 98-107.
Sheel, A. (1994), “Determinants of capital structure choice and empirics on leverage behaviour: a comparative analysis of hotel and manufacturing firms”, Hospitality Research Journal, Vol 17, No 3, 3-16.
Such, M., Parte, L., and Garre, A. (2009), “The financial structure of the Spanish hotel industry: evidence from cluster analysis”, Tourism Economics, Vol 15, No 1, 121-138.
Tsai, H., Pan, S., and Lee, J. (2011), “Recent research in hospitality financial management”, International Journal of Contemporary Hospitality Management, Vol 23, No 7, 941-971.
Upneja, A., and Dalbor, M. (2001), “An examination of capital structure in the restaurant industry”, International Journal of Contemporary Hospitality Management, Vol 13, No 2, 54-59.
Vieira, E., and Novo, A. (2010), “A estrutura de capital das PME: evidência no mercado português”, Revista Estudos do ISCA, No 2, 1-16.
Vieira, E., Pinho, C., and Oliveira, D. (2013), “A concessão de crédito comercial e o financiamento dos clientes: evidência nas empresas Portuguesas”, Revista Universo Contábil, Vol 9, No 4, 144-156.
19 ANNEX - TABLES
Table 1 - Average financial and economic indicators for SMEs
2012 2004 Total Hospitality sector Total Hospitality sector Financial Autonomy 0.27 0.23 0.25 0.27 Solvency 0.37 0.30 0.33 0.37 Debt-to-Equity 2.70 3.39 3.06 2.72 Indebtedness 0.73 0.77 0.75 0.73 Return on Sales (%) -2.78 -15.78 1.32 -2.30 ROA (%) -1.53 -5.63 0.91 -1.26 ROE (%) -5.67 -24.70 3.70 -4.69
Turnover per employee (103 €) 68.42 29.59 66.76 30.56 Operational Profitability on Sales (%) 3.26 -1.35 6.01 12.40 Source: INE (2014)
Table 2 – Independent variables and expected signs
Hyp. Acronym Independent variables Formula Expected
sign
H1 ROA Return on Assets EBIT / Total Assets -
H1 ROE Return on Equity EBIT / Equity -
H2 AT Assets Tangibility (Non-current Assets + inventories) / Total Assets + H3 SG Turnover Growth (Turnover (n) - Turnover (n-1)) / Turnover (n-1) + H3 AG Assets Growth Assets (n) – Assets (n-1) / Assets (n-1) +
H4 SZ Dimension Logarithm of Total Assets +
H5 TL Total Liquidity Current Assets / Current Liabilities - H6 OTB Other Tax Benefits besides debt Depreciations / Total Assets - H7 AGE Age (Reputation) Number of years in activity - H8 SOR Solvency Ratio Equity / Total Liabilities + H8 STR Structure Ratio Non-current Liabilities / Equity -
20
Table 3 – Descriptive statistics (mean and s.d.) and correlation matrix between independent variables
n n-4 n-8 s.d. ROA ROE AT SG AG SZ TL OTB AGE SOR STR
TD 0,54 0,55 0,59 0.22 LTD 0,31 0,32 0,34 0.18 STD 0,23 0,23 0.26 0.17 ROA (%) 2,17 2,40 3,06 3,86 1 0,697** -0,147** 0,289** -0,020 -0,257** 0,049 0,053 -0,052 -0,020 -0,118* ROE (%) 7,09 4,19 4,21 14,20 1 -0,222** 0,156** -0,025 -0,179** 0,019 -0,004 -0,016 -0,088 -0,224** AT 0,87 0,82 0,82 0,15 1 0,045 -0,096* 0,095* -0,219** 0,069 -0,195** 0,000 0,082 SG (%) 3,49 -7,24 13,55 12,01 1 -0,019 0,004 -0,005 -0,028 0,009 -0,060 0,023 AG (%) 0,15 1,46 13,95 14,02 1 0,016 0,065 -0,207** -0,031 -0,037 0,098* SZ 9,12 8,97 8,86 0,83 1 0,014 -0,542** 0,201** 0,005 -0,031 TL 1,01 1,47 1,18 1,01 1 -0,108* 0,224** 0,207** 0,000 OTB 0,04 0,05 0,06 0,02 1 -0,128** 0,022 -0.033 AGE 29,12 25,12 21,12 13,58 1 0,170** -0,201** SOR 1,73 1,25 0,95 3,47 1 -0,271** STR 1,20 0,76 1,53 1,69 1
22
Table 4 – Regression Models: Total Indebtedness (TD), Long-term Indebtedness (LTD) and Short-term indebtedness (STD)
POLS Sig FEM Sig REM Sig
TD C ,960 *** ,393 ,797 *** ROA -,997 * -1,026 *** -1,005 *** ROE ,259 * ,174 * ,198 *** AT -,153 ** ,074 -,064 SG ,039 ** ,031 ** ,035 * AG ,002 ,005 ,008 SZ -,016 ,036 -,007 TL -,009 ,004 ,000 OTB -,354 ,188 -,071 AGE -,002 -,008 ** -,003 *** SOR -,066 ** -,029 * -,043 *** STR ,038 * ,017 ,023 ***
Wald F 18,780 *** Reject POLS / Accept FEM Breusch-Pagan LM 273,823 *** Reject POLS / Accept REM Hausman H 181,178 *** Reject REM / Accept FEM
LTD C -,060 -,844 * -,236 ROA -,657 -,940 * -,899 *** ROE ,155 ,134 ,146 *** AT ,297 *** ,257 * ,261 *** SG -,000 ,009 ,009 AG ,011 -,008 ,005 SZ ,016 -,117 ** ,040 ** TL ,026 *** ,028 ** ,027 *** OTB ,292 ,927 ,546 AGE -,002 -,007 -,003 ** SOR -,040 ** -,026 * -,033 *** STR ,041 * ,026 ,032 ***
Wald F 7,185 *** Reject POLS / Accept FEM Breusch-Pagan LM 179,030 *** Reject POLS / Accept REM Hausman H 41,258 *** Reject REM / Accept FEM
STD C 1,019 *** 1,238 *** 1,083 *** ROA -,340 -,086 -,083 ROE ,104 ,040 ,046 AT -,450 *** -,182 -,280 *** SG ,039 * ,022 ,024 AG -,009 ,012 ,007 SZ -,032 -,080 * -,057 *** TL -,035 * -,024 ** -,026 *** OTB -,645 -,739 -,637 * AGE -,000 -,002 -,001 SOR -,026 ** -,003 -,007 * STR -,003 -,010 ** -,009 **
Wald F 13,871 *** Reject POLS / Accept FEM Breusch-Pagan LM 397,239 *** Reject POLS / Accept REM Hausman H 38,117 *** Reject REM / Accept FEM Note: POLS (Pooled Ordinary Least Squares); FEM (Fixed Effects Model); REM (Random Effects Model); * p<0,05; ** p<0,01; *** p<0,001
23 Table 5 – Regression (Fixed Effects Model):
Total Indebtedness (TD), Long-term Indebtedness (LTD) and Short-term indebtedness (STD)
COEFFICIENT Sig. TD C ,8064 *** ROA -1,1270 *** ROE ,1199 ** SG ,0372 *** AGE -,0075 ** SOR -,0322 * R2 ,88 F 57,75 *** DW 0,78 LTD C -,5716 ROA -,7176 ** AT ,2160 SZ ,0823 * TL ,0301 ** SOR -,0341 * R2 ,68 F 17,10 *** DW 0,82 STD C ,8429 *** SZ -,0630 * TL -,0218 *** STR -,0108 *** R2 ,76 F 26,84 *** DW 1,03 Note: * p<0,05; ** p<0,01; *** p<0,001
Table 6 – Expected and Observed Relations
Explanatory Variables
Expected Relation Observed Relation Hypothesis validated?
TD LTD STD TD LTD STD H1 ROA - - - - - NR YES ROE - - - + NR NR H2 AT + + - NR + NR YES H3 SG + + + + NR NR … AG + + + NR NR NR H4 SZ + + - NR + - YES H5 TL NR NR - NR + - YES H6 OTB - - - NR NR NR … H7 AGE - + - - NR NR … H8 SOR + + + - - NR … STR - - - NR NR -
Source: Own calculations.