A Work Project, presented as part of the requirements for the Award of a Master Degree in Finance from the NOVA – School of Business and Economics.
RETURNS AND BETAS: STATUS OF THE AIRLINE INDUSTRY
FRANCISCO SEQUEIRA DE PAIVA MARTINS DA SILVA
33976
A Project carried out on the Master’s in Finance Program, under the supervision of: Rosário André
Abstract
In this report an analysis will be conducted concerning the historical betas, in order to conclude the inherent past volatility of the securities with the market, comparing them with the current status of the industry. A further analysis is also conducted with regards to past returns by assessing which airline security was able to bring higher gains to its shareholders. Lastly, by applying the previous results, a sensitivity analysis is conducted to understand the impact in Delta’s valuation if the 1st Quartile, Median and 3rd Quartile historical past betas were used to assess the share’s fair value.
Keywords
Delta Air Lines, Inc. Airline Industry Beta
Past Return
This work used infrastructure and resources funded by Fundação para a Ciência e a Tecnologia (UID/ECO/00124/2013, UID/ECO/00124/2019 and Social Sciences DataLab, Project 22209), POR Lisboa (LISBOA-01-0145-FEDER-007722 and Social Sciences DataLab, Project 22209) and POR Norte
PAGE 3/7
Airline Return
As part of the individual report an analysis will be made on betas. Two market indexes will be analyzed (‘Dow Jones U.S. Airlines Index’ {‘DJUSAR’, ticker ‘DJUSAR Index’} and ‘NYSE Arca Global Air Line Index’ {‘AXGAL’, ticker ‘AXGAL Index’}), as well as Delta’s national peers (American {ticker ‘AAL US Equity’}, United {‘UAL US Equity’}, Southwest {ticker ‘LUV US Equity’}, Alaska {ticker ‘ALK US Equity’} and Air Canada {ticker ‘AC CN Equity’}), other American airline companies (SkyWest, Inc {‘SkyWest’, ticker ‘SKYW US Equity’}, JetBlue Airways Corporation {‘JetBlue’, ticker ‘JBLU US Equity’} and Hawaiian Holdings, Inc. {‘Hawaiian’, ticker ‘HA US Equity’}), and, lastly, similar international companies (International Consolidated Airlines Group, S.A. {‘IAG’, ticker ‘IAG LN Equity’}, Turk Hava Yollari Anonim Ortakligi {‘Turkish Airline’, ticker ‘THYAO TI Equity’}, Deutsche Lufthansa AG’ {‘Lufthansa’, ticker ‘LHA GR Equity’}, Ana Holdings Inc. {‘Ana’, ticker ‘9202 JT Equity’}, Japan Airlines Co., LTD {‘Japan Air’, ticker ‘9201 JT Equity’} and Air France-KLM SA {‘Air France-KLM’, ticker ‘AF FP Equity’}). The indexes used for the betas will be the S&P500 {ticker ‘SPX Index’} (for American airlines and airline indexes alone) and MSCI world index {ticker ‘MXWO Index’}.
The beta of a stock is calculated in order to ascertain the volatility of the stock when compared to the market, also defined as the systematic risk of a stock. It represents the security’s expected returns compared to the market’s – i.e. for every 1% market return, a security with beta of 2, for example, would expect 2% return. It is calculated as the covariance between the stock and the market divided by the variance of the market index being used:
𝛽𝑆𝑡𝑜𝑐𝑘 = 𝐶𝑜𝑣(𝑟𝑠𝑒𝑐𝑢𝑟𝑖𝑡𝑦, 𝑟𝑚𝑎𝑟𝑘𝑒𝑡) 𝑉𝑎𝑟(𝑟𝑚𝑎𝑟𝑘𝑒𝑡)
In this case the r stands for the return of the security/market, usually considered as the weekly/monthly return. Both the absolute (i.e. Pricen/Price(n-1) - 1) and the log return can be
PAGE 4/7
used (i.e. ln{Pricen/Price(n-1)}). For this individual report, only the log return will be used as:
if prices are log-normally distributed, then so are the log returns, since the weekly returns will be used, a raw equality is observed between the normal and log returns; and added effect of time additively – ability to add all log returns when referring to multiple periods.
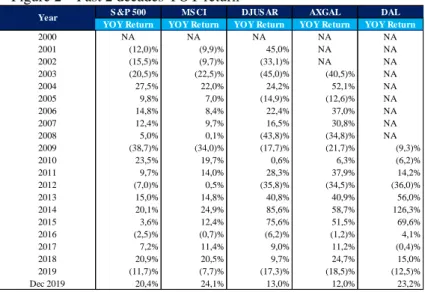
The DJUSAR is an American index composed of the airline companies trading in the Dow Jones stock exchange, while the AXGAL covers global airlines with more than $100 million in market capitalization that are liquid in their market of origin. Looking at the current 3Y betas using the S&P 500, we can first analyze that DJUSAR has a beta of 1.20 and AXGAL has a beta similar to that of Delta (1.14), currently standing at 1.15. This means that the market is currently assessing a systematic risk greater than that of the market (as the betas are greater than 1). If we look at the historic betas, we can see that the indexes’ betas achieved its maximum in March 2005, in fact while the MSCI index gained around 16% over the previous 3 years and the S&P 500 increased its value by almost 3% in the same period, the DJUSAR index lost 49.4% and the AXGAL index lost 30.8% in the aftermath of the September 11 attacks in 2001 and resulting consequences. Furthermore, by analyzing the single biggest loss since the index began trading, this occurred during the terrorist attack mentioned previously, with both indexes loosing almost 50% of their value in a single week (46% drop in value for the DJUSAR index and 48% for the AXGAL index). Figure 2 present in the annex shows a more in-depth analysis with regards to the year-on-year returns of both indexes along with Delta’s and the market returns.
Taking a closer look at Delta and its peers, we can see a similar trend to that of the indexes, though it should be stated that only Southwest and Alaska were trading at the time of the 2001 terrorist attacks and are still trading today, uninterrupted. At the time, in a single week, Southwest lost 20% of its market capitalization, while Alaska lost 40%. Looking at the historical rolling 3Y betas with the S&P 500, a high volatility can be observed. In fact, as it
PAGE 5/7
can be viewed in the graph below, the betas from Delta and its comparable national companies have oscillated between 0 and 3, throughout the years, though as of lately they have stabilized between 0.5 and 1.5. Several major shocks can be observed, the 2001 terrorist incident and the 2008 crash the most evident.
Another analysis was made with regards to other national companies currently trading in the United States’ stock market and other international comparable (ie. companies based in companies not in the USA that could also be considered major carriers). The analysis with smaller American airlines shows a beta more volatile than characteristic from Delta’s peers. This is due to higher volatility of returns from the smaller American airlines as oil prices have greater effect on the company’s margins rather than on major airlines that have well established operations. In the systematic risk associated with international airlines, there are three major periods that can be observed from 2000 onwards. The first, from 2000 to 2006, is a period of instability in the airline’s betas; between 2006 and 2014, they stabilized between 1.2 and 1.8, with the exception being ‘Ana’, where the beta settled around 0.3 implying a lower returns for
0.00 0.50 1.00 1.50 2.00 2.50 3.00
DAL US Equity AC C N Equity ALK US Equity SKYW US Equity JBLU US Equity HA US Equity IAG LN Equity THYAO TI Equity LHA GR Equity 9202 JT Equity 9201 JT Equity AF FP Equity Delta Peers Ave rage
PAGE 6/7
the company. Finally, after 2014, the airline’s volatility decreased with the market, where none of the comparables had a beta greater than 1.8 during the final period. Turkish airlines should be noted, as their returns have fallen due to the recent instability felt in the country.
An analysis was concluded to assess the returns an investor would obtain if it had invested in an Airline security, as well as analyzing its ‘sharpe ratio’ (the risk an investor has compared to returns) – results and formula present in Figure 1 and Figure 5, respectively, in the annex. The analysis shows a higher return investing in Delta compared with most other airlines/index. In fact, since Delta began trading only Southwest, Alaska and Hawaiian had higher annualized returns. At the same time, while both S&P 500 and MSCI world enjoyed exceptional years gaining 13.8% and 12.3%, respectively, in the past year, the airlines have either lost value in the past years or have had near flat returns. The exceptions being SkyWest gaining 9.5% in the previous year and Air Canada that increased over 70% in value.
To conclude, a sensitivity analysis was conducted in order to ascertain the impact in the valuation if historical information was used to compute the beta (both for Delta as for its peers). The higher price (from the lower betas), $110.60, is close to the current valuation of $112.34 as the betas are approaching historic lows, since the current beta is 1.06, while the 1st quartile beta sits at a comparative 1.05. At the same time, if the upper range of the century’s beta was to be taken into account, ie. the 3rd quartile beta of 1.34 for Delta, the resulting valuation would be just $73.82 which results in a discount of over 34% compared with the share’s fair value calculated. However, even when considering the higher beta, the share would still be trading at a discount compared to the current valuation. It should be noted, however, that these betas may not be exactly comparable to the current betas as the companies can be offering different services while, at the same time, the market is no longer the same.
Note: The analysis was conducted with prices present in the Bloomberg platform. Last prices considered were in November 29th, 2019.
PAGE 7/7
Figure 1 – Security and Market Returns
DAL US Equity AAL US Equity UAL US Equity LUV US Equity ALK US Equity
1st Quartile 1,05 1,32 1,18 0,93 1,03
M edian 1,19 1,39 1,28 1,03 1,13
3rd Quartile 1,34 1,51 2,08 1,11 1,46
Delta's Beta 2020 WACC S hare Price Premium/ (Discount) Expected 1,06 6,61% $ 112,34 0,0% 1st Quartile 1,05 6,67% $ 110,60 (1,5)% Median 1,19 7,09% $ 99,08 (11,8)% 3rd Quartile 1,34 8,30% $ 73,82 (34,3)%
Annex
Since Begging 1Y 3Y 5Y Since Delta Began trading
Tt Ret. Ann. Ret. St. Deviation Sharpe Ratio Tt Ret. St. Deviation Sharpe Ratio Tt Ret. Ann. Ret. St. Deviation Sharpe Ratio Tt Ret. Ann. Ret. St. Deviation Sharpe Ratio Tt Ret. Ann. Ret. St. Deviation Sharpe Ratio DAL US Equity 206,42% 8,85% 7,24% 0,98 -3,04% 3,65% -1,32 27,51% 8,44% 3,42% 1,95 33,73% 5,99% 3,73% 1,13 206,42% 9,25% 7,24% 1,03 MXWO Index 2192,26% 6,45% 2,01% 2,32 12,29% 1,77% 5,94 34,13% 10,28% 1,59% 5,34 31,85% 5,69% 1,69% 2,31 44,71% 2,96% 2,47% 0,48 SPX Index 17685,84% 5,78% 2,47% 1,62 13,80% 2,07% 5,80 43,30% 12,74% 1,78% 6,14 51,35% 8,64% 1,81% 3,79 110,23% 6,05% 2,46% 1,74 DJUSAR Index 169,04% 3,60% 4,95% 0,37 -6,34% 3,26% -2,49 5,28% 1,73% 3,15% -0,01 9,05% 1,75% 3,54% -0,01 124,85% 6,61% 5,44% 0,89 AXGAL Index 142,77% 4,82% 4,90% 0,62 -4,68% 3,02% -2,14 17,35% 5,48% 2,88% 1,28 28,90% 5,21% 2,99% 1,15 126,37% 6,67% 4,76% 1,03 AAL US Equity 15,80% 2,47% 5,28% 0,13 -27,55% 5,49% -5,35 -35,72% -13,70% 4,96% -3,12 -40,76% -9,94% 5,13% -2,28 15,80% 2,47% 5,28% 0,13 UAL US Equity 130,78% 6,20% 9,08% 0,49 -4,03% 3,39% -1,71 33,97% 10,24% 4,00% 2,11 47,23% 8,04% 4,37% 1,43 191,78% 8,83% 9,23% 0,76 LUV US Equity 17684,63% 14,02% 4,79% 2,56 6,96% 3,48% 1,49 24,15% 7,48% 3,43% 1,66 46,85% 7,99% 3,92% 1,58 333,94% 12,30% 4,38% 2,40 AC CN Equity 120,32% 6,22% 8,74% 0,51 72,87% 3,75% 18,97 257,33% 52,88% 4,39% 11,65 258,93% 29,12% 4,81% 5,69 154,76% 7,67% 8,83% 0,67 ALK US Equity 2217,02% 8,89% 5,39% 1,32 -3,73% 3,75% -1,47 -13,90% -4,87% 3,66% -1,82 31,08% 5,56% 3,90% 0,97 857,44% 19,55% 5,50% 3,23 SKYW US Equity 5111,31% 12,50% 7,01% 1,53 9,54% 4,33% 1,79 75,42% 20,60% 4,09% 4,60 429,50% 39,56% 4,72% 8,01 160,12% 7,85% 5,79% 1,05 JBLU US Equity 44,53% 2,10% 6,43% 0,05 -1,28% 3,92% -0,78 -7,93% -2,72% 3,67% -1,22 26,86% 4,87% 4,14% 0,75 92,70% 5,32% 6,51% 0,54 HA US Equity 131,91% 3,49% 8,83% 0,19 -23,23% 6,86% -3,65 -38,85% -15,12% 5,89% -2,87 36,06% 6,35% 6,03% 0,76 826,27% 19,23% 7,24% 2,41 IAG LN Equity 540,04% 6,10% 5,64% 0,77 1,40% 4,23% -0,09 65,35% 18,25% 3,62% 4,55 21,83% 4,03% 4,21% 0,54 -6,37% -0,52% 5,93% -0,39 THYAO TI Equity 156,96% 3,85% 8,54% 0,24 -26,78% 5,66% -5,05 74,47% 20,39% 5,85% 3,18 -43,46% -10,78% 5,81% -2,16 199,94% 9,07% 6,73% 1,08 LHA GR Equity 346,53% 5,08% 4,90% 0,67 -18,96% 4,79% -4,33 62,41% 17,54% 4,27% 3,70 20,12% 3,74% 4,29% 0,46 -8,29% -0,68% 4,91% -0,50 9202 JT Equity -33,50% -0,89% 6,24% -0,43 -2,64% 1,45% -3,06 31,41% 9,53% 2,25% 3,44 47,67% 8,11% 2,62% 2,42 1,82% 0,14% 3,15% -0,52 9201 JT Equity 66,30% 7,29% 3,10% 1,78 -11,02% 1,58% -8,10 17,51% 5,53% 2,26% 1,66 15,19% 2,87% 2,91% 0,38 66,30% 7,29% 3,10% 1,78 AF FP Equity -54,39% -2,76% 7,71% -0,59 2,14% 5,62% 0,06 124,05% 30,85% 5,63% 5,16 8,29% 1,61% 5,38% -0,03 -75,76% -10,59% 6,41% -1,93 Company
S &P 500 MS CI DJUS AR AXGAL DAL YOY Return YOY Return YOY Return YOY Return YOY Return
2000 NA NA NA NA NA 2001 (12,0)% (9,9)% 45,0% NA NA 2002 (15,5)% (9,7)% (33,1)% NA NA 2003 (20,5)% (22,5)% (45,0)% (40,5)% NA 2004 27,5% 22,0% 24,2% 52,1% NA 2005 9,8% 7,0% (14,9)% (12,6)% NA 2006 14,8% 8,4% 22,4% 37,0% NA 2007 12,4% 9,7% 16,5% 30,8% NA 2008 5,0% 0,1% (43,8)% (34,8)% NA 2009 (38,7)% (34,0)% (17,7)% (21,7)% (9,3)% 2010 23,5% 19,7% 0,6% 6,3% (6,2)% 2011 9,7% 14,0% 28,3% 37,9% 14,2% 2012 (7,0)% 0,5% (35,8)% (34,5)% (36,0)% 2013 15,0% 14,8% 40,8% 40,9% 56,0% 2014 20,1% 24,9% 85,6% 58,7% 126,3% 2015 3,6% 12,4% 75,6% 51,5% 69,6% 2016 (2,5)% (0,7)% (6,2)% (1,2)% 4,1% 2017 7,2% 11,4% 9,0% 11,2% (0,4)% 2018 20,9% 20,5% 9,7% 24,7% 15,0% 2019 (11,7)% (7,7)% (17,3)% (18,5)% (12,5)% Dec 2019 20,4% 24,1% 13,0% 12,0% 23,2% Year
Figure 2 – Past 2 decades YOY return Figure 3 – Historic Betas
Figure 4 – Sensitivity analysis using historic betas
Note: In order to calculate the Sharpe Ratio, the same Risk Free was used as in the group report, i.e. a Risk Free of 1.8%.
Figure 5 – Sharpe Ratio formula
𝑆ℎ𝑎𝑟𝑝𝑒 𝑅𝑎𝑡𝑖𝑜 =𝐴𝑛𝑛𝑢𝑎𝑙𝑖𝑧𝑒𝑑 𝑅𝑒𝑡𝑢𝑟𝑛 − 𝑅𝑖𝑠𝑘 𝐹𝑟𝑒𝑒