ESSDD
7, 243–270, 2014GPCC Drought Index
M. Ziese et al.
Title Page
Abstract Instruments
Data Provenance & Structure
Tables Figures
◭ ◮
◭ ◮
Back Close
Full Screen / Esc
Printer-friendly Version Interactive Discussion
Discussion
P
a
per
|
D
iscussion
P
a
per
|
Discussion
P
a
per
|
Discuss
ion
P
a
per
|
Earth Syst. Sci. Data Discuss., 7, 243–270, 2014 www.earth-syst-sci-data-discuss.net/7/243/2014/ doi:10.5194/essdd-7-243-2014
© Author(s) 2014. CC Attribution 3.0 License.
Open
Access
Earth System
Science
Data
D
iscussions
This discussion paper is/has been under review for the journal Earth System Science Data (ESSD). Please refer to the corresponding final paper in ESSD if available.
GPCC Drought Index – a new, combined,
and gridded global drought index
M. Ziese1, U. Schneider1, A. Meyer-Christoffer1, K. Schamm1, J. Vido1, P. Finger1, P. Bissolli2, S. Pietzsch3, and A. Becker1
1
Deutscher Wetterdienst, Global Precipitation Climatology Centre, 63067 Offenbach/M.,
Germany 2
Deutscher Wetterdienst, Regionale Klimaüberwachung, 63067 Offenbach/M., Germany
3
Deutscher Wetterdienst, Agrarmeteorologische Beratung, 63067 Offenbach/M., Germany
Received: 27 March 2014 – Accepted: 15 April 2014 – Published: 29 April 2014
Correspondence to: M. Ziese ([email protected])
ESSDD
7, 243–270, 2014GPCC Drought Index
M. Ziese et al.
Title Page
Abstract Instruments
Data Provenance & Structure
Tables Figures
◭ ◮
◭ ◮
Back Close
Full Screen / Esc
Printer-friendly Version Interactive Discussion
Discussion
P
a
per
|
D
iscussion
P
a
per
|
Discussion
P
a
per
|
Discuss
ion
P
a
per
Abstract
The Global Precipitation Climatology Centre Drought Index (GPCC-DI) provides es-timations of precipitation anomalies with respect to long term statistics. It is a com-bination of the Standardized Precipitation Index with adaptations from Deutscher Wetterdienst (SPI-DWD) and the Standardized Precipitation Evapotranspiration Index 5
(SPEI). Precipitation data were taken from the Global Precipitation Climatology Centre (GPCC) and temperature data from NOAA’s Climate Prediction Center (CPC). The GPCC-DI is available with several averaging periods of 1, 3, 6, 9, 12, 24 and 48
months for different applications. Since spring 2013, the GPCC-DI is calculated
op-erationally and available back to January 2013. Typically it is released at the 10th 10
day of the following month, depending on the availability of the input data. It is
calcu-lated on a regular grid with 1◦spatial resolution. All averaging periods are integrated
into one netCDF-file for each month. This dataset can be referenced by the DOI: 10.5676/DWD_GPCC/DI_M_100 and is available free of charge from the GPCC web-site ftp://ftp.dwd.de/pub/data/gpcc/html/gpcc_di_doi_download.html.
15
1 Introduction
Drought indices are a measure of anomalies of available water with respect to long term statistics. They can be based on station as well as on grid data like precipitation, temperature, wind speed, radiation, evaporation but also non-meteorological data like soil type, soil moisture or ground water level. It is common to classify three main con-20
ditions: drought, normal and wet. Drought conditions are refined to moderate, severe and extreme drought (Palmer, 1965).
Drought indices allow to distinguish easily between the different conditions. They
provide information on the onset and end, their length and severity of droughts. There are several types and definitions of droughts. Usually, droughts are defined 25
er-ESSDD
7, 243–270, 2014GPCC Drought Index
M. Ziese et al.
Title Page
Abstract Instruments
Data Provenance & Structure
Tables Figures
◭ ◮
◭ ◮
Back Close
Full Screen / Esc
Printer-friendly Version Interactive Discussion
Discussion
P
a
per
|
D
iscussion
P
a
per
|
Discussion
P
a
per
|
Discuss
ion
P
a
per
|
ences between aridity and drought have to be kept in mind. For example, droughts are categorized as meteorological, agricultural or hydrological droughts, with a variety of definitions (Anderson et al., 2010; Heim, 2002; McKee et al., 1993; Wilhite and Glantz,
1985) for each category. They can also differ in the time span of the water deficit.
A precipitation deficit of one or two consecutive months has usually an impact on the 5
agricultural yield whereas longer lasting deficits have an impact on ground water levels
and river runoffs (e.g. Sustek and Vido, 2013).
2 Some existing drought indices
Depending on the available data and the target application specific drought indices were developed. Some of the most common are discussed in this section. A thorough 10
review of drought indices is given in Heim (2002).
One frequently utilized drought index is the Palmer Drought Severity Index (PDSI, Palmer, 1965). It is based on several empirical relationships. The PDSI uses
precipita-tion, evapotranspiraprecipita-tion, soil water recharge, runoff, water loss from soil and an
empir-ical weighting factor (Lloyd-Hughes and Saunders, 2002). Also the soil water storage 15
capacitiy is needed. The evapotranspiration can be measured or calculated using sev-eral parameterizations. A strength of the PDSI lies in its high level of standardization. On the other hand it is build on empirical relationships and comes with a high de-mand on input data that can be hardly addresed on the global scale (Lloyd-Hughes and Saunders, 2002).
20
Another drought index is the Reconnaissance Drought Index (RDI, Tsakiris and Van-gelis, 2005). It is based on the ratio of precipitation and potential evapotranspiration (PET). Again, the potential evapotranspiration can be calculated applying several pa-rameterizations or measured (see Sect. 5). It is possible to standardize the RDI. How-ever, the RDI is not defined, if the PET is zero.
25
ESSDD
7, 243–270, 2014GPCC Drought Index
M. Ziese et al.
Title Page
Abstract Instruments
Data Provenance & Structure
Tables Figures
◭ ◮
◭ ◮
Back Close
Full Screen / Esc
Printer-friendly Version Interactive Discussion
Discussion
P
a
per
|
D
iscussion
P
a
per
|
Discussion
P
a
per
|
Discuss
ion
P
a
per
of precipitation for this time span (e.g. one month). Only precipitation data are needed, which is a big advantage. On the other hand, if the temperature changes due to cli-mate change, the SPI has not the ability to take the increased evapotranspiration into account. This leads also to misleading values in arid areas (Lloyd-Hughes and Saun-ders, 2002). An adjustment of the SPI by DWD, called SPI-DWD, fixed this problem 5
(Pietzsch and Bissolli, 2011). Nevertheless, the usage of the SPI was recommended by WMO (WMO, 2009). A user guide of the SPI is also given in WMO (2012).
A recently developed drought index is the Standardized Precipitation
Evapotranspi-ration Index (SPEI, Vicente-Serrano et al., 2009). It is based on the difference between
precipitation and PET. As for RDI and PDSI, the calculation or measurement of the 10
PET is the main challenge. The calculation of the SPEI is similar to the calculation of the SPI. As an alternative to the SPI, the SPEI was suggested by WMO (WMO, 2009).
3 Some existing drought index data sets and monitoring tools
There are a number of regional and global drought index data sets and monitoring
tools. They differ in target region, input data, processing of input data (like regridding),
15
utilized drought index, timeliness and scope of provided information and data (e.g., figures, bulletins or data files). Some of them are briefly described below, but it is not a comprehensive review!
For instance, the “Drought Management Centre for Southeastern Europe” (DMC-SEE) provides figures and bulletins based on SPI for Southeastern Europe (http: 20
//www.dmcsee.org/en/drought_monitor/, last access: 9 December 2013). Precipitation
data are taken from the GPCC and downscaled to a higer resolution of 0.01◦. The data
are available back to 1986.
Another European drought data set is produced by the “Pilot Regional Climate Cen-tre on Climate Monitoring” (RCC-CM) for the WMO-region RA VI (Europe and the Mid-25
ESSDD
7, 243–270, 2014GPCC Drought Index
M. Ziese et al.
Title Page
Abstract Instruments
Data Provenance & Structure
Tables Figures
◭ ◮
◭ ◮
Back Close
Full Screen / Esc
Printer-friendly Version Interactive Discussion
Discussion
P
a
per
|
D
iscussion
P
a
per
|
Discussion
P
a
per
|
Discuss
ion
P
a
per
|
provided with 1◦ spatial resolution. Precipitation products of the GPCC were utilized
(Pietzsch and Bissolli, 2011).
The European Drought Observatory (http://edo.jrc.ec.europa.eu/edov2/php/index.
php?id=1000, last access: 26 March 2014) provides drought related information based
on precipitation, temperature, soil moisture and vegetation response data for Europe. 5
The analyses can be visualized as maps and time series for user choosen locations. The time series can also be downloaded as text files, whereas the maps can only be downloaded as graphs. A comparison of several indicators is also possible at this website.
On the other hand, the North American Drought Monitor (Lawrimore et al., 10
2002, http://www.ncdc.noaa.gov/temp-and-precip/drought/nadm/index.php, last ac-cess: 26 March 2014) provide information on droughts for Mexico, USA and Canada based on SPI, PDSI and precipitation anomalies. Data can be downloaded as text files incuding station related data or maps.
The US Drought Monitor provides drought information for the USA (Svoboda et al., 15
2002, http://droughtmonitor.unl.edu/Home.aspx, last access: 9 December 2013). It is based on meteorological observations as well as reports from observers.
The “SPEI Global Drought Monitor” provides global maps and gridded data of the
SPEI with 0.5◦ spatial resolution (http://sac.csic.es/spei/, last access: 5 March 2014).
There is a monitoring tool based on precipitation data from the GPCC and tempera-20
ture data from the NOAA NCEP CPC GHCN_CAMS gridded dataset (Fan and van den Dool, 2008). The estimation of the PET is based on the parameterization from Thorn-thwaite (1948). Additionally, an improved version for climatological applications is pro-vided from 1901 to 2011 based on the version 3.2 of the CRU dataset (Jones and Harris, 2013) with an enhanced estimation of the PET.
25
One global drought monitor based on SPI is provided by the International Re-search Institute for Climate and Society (http://iridl.ldeo.columbia.edu/SOURCES/.IRI/ .Analyses/.SPI/SOURCES/.IRI/.Analyses/.SPI/, last access: 25 March 2014). The
spa-tial resolution is 2.5◦
ESSDD
7, 243–270, 2014GPCC Drought Index
M. Ziese et al.
Title Page
Abstract Instruments
Data Provenance & Structure
Tables Figures
◭ ◮
◭ ◮
Back Close
Full Screen / Esc
Printer-friendly Version Interactive Discussion
Discussion
P
a
per
|
D
iscussion
P
a
per
|
Discussion
P
a
per
|
Discuss
ion
P
a
per
4 Used data
The GPCC-DI is based on gridded precititation data and gridded monthly mean tem-peratures. Because of the necessary high timeliness only a limited number of data sets are currently available in such a timely fashion.
The “First Guess Product” of the GPCC (Ziese et al., 2011, doi:
5
10.5676/DWD_GPCC/FG_M_100) is available three to five days after the end of each month and used as precipitation input data. It is based on monthly totals calculated from SYNOP-reports, interpolated to a regular grid using a modified SPHEREMAP scheme (Willmott et al., 1985) and a background climatology. A detailed desription of the data set, data base and interpolation is given in Becker et al. (2013). 10
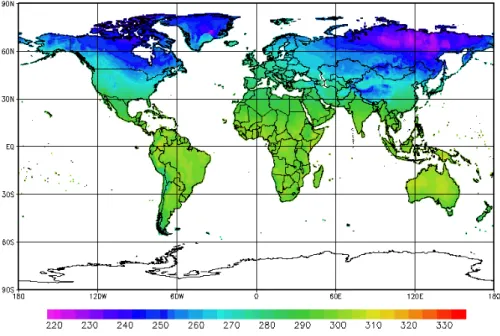
On the other hand monthly mean temperatures were applied from the NOAA NCEP CPC GHCN_CAMS gridded data set (Fan and van den Dool, 2008), where the tem-perature data are taken from GHCN version 2 (Peterson and Vose, 1997) and CAMS (Ropelewski et al., 1984). Due to the higher timeliness of the CAMS data set, CAMS is more important for the drought index calculation. The station data are interpolated by 15
means of a Cressman based objective analysis scheme and a background climatology.
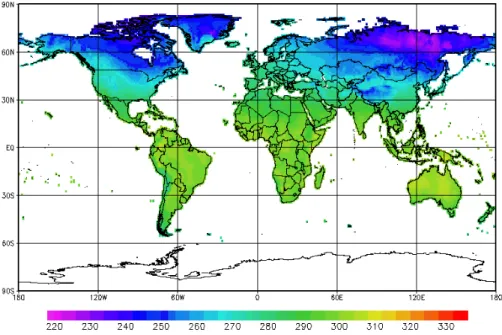
The temperature data are delivered orginally with 0.5◦
spatial resolution (see Fig. 1). To
match the GPCC grid the data are regridded to 1◦spatial resolution taking land portion
and area-average into account (see Fig. 2).
5 How to calculate the GPCC-DI
20
The calculation of the GPCC-DI is based on the above mentioned gridded data sets. We decided to use gridded data as input data and not station data, because both data
sets have spent a lot of efforts to reach a high quality level. Also, we think an
interpo-lation of station based drought indices is more error-prone than the calcuinterpo-lation based
on gridded data. Additionally, station data suffers from gaps in time series, relocation,
25
ESSDD
7, 243–270, 2014GPCC Drought Index
M. Ziese et al.
Title Page
Abstract Instruments
Data Provenance & Structure
Tables Figures
◭ ◮
◭ ◮
Back Close
Full Screen / Esc
Printer-friendly Version Interactive Discussion
Discussion
P
a
per
|
D
iscussion
P
a
per
|
Discussion
P
a
per
|
Discuss
ion
P
a
per
|
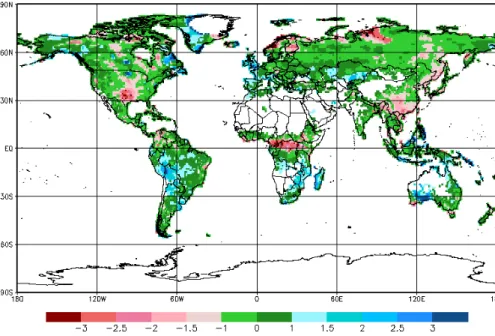
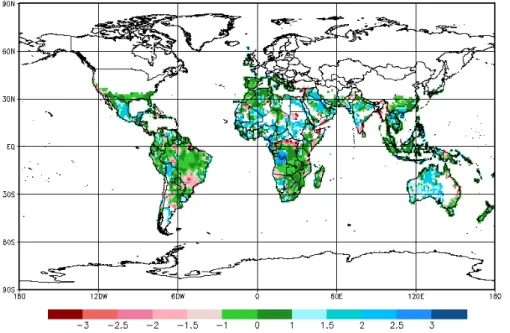
The calculation of the GPCC-DI takes place in two steps. First, the SPI-DWD and SPEI are calculated independently on the grids where possible. Afterwards, the GPCC-DI is computed using the mean of both indices for each grid cell, where both indices are valid. For the other grid cells the index that is still possible to be calculated is taken. Although the DWD-adaptation of the SPI (Pietzsch and Bissolli, 2011) was taken 5
into account, the SPI-DWD cannot be computed in very arid regions. This is because the applied gamma distribution to describe the distribution of the precipitation amounts has not a shape with a maximum above zero, which is neccessary to calculate the SPI (see also Wu et al., 2007). Examples of the SPI-DWD with averaging intervals of one, three and six months are depicted in Figs. 3, 4 and 5. Green indicates precipitation 10
around normal and blue precipitation above normal. Droughts occure in red areas, where precipitation is below normal. Grids without data are white. These areas are the oceans, Antarctica as well as areas where the SPI-DWD cannot be calculated due to the above mentioned limitations of the applied gamma function (see also Sect. 5.1).
The PET is computed according to the algorithm from Thornthwaite (1948). This 15
algorithm fails in areas where the mean temperature is near or below 0◦C (see Fig. 6
and Figs. 1 and 2). Even if other parameterizations for the computation of the PET exist, they need more input data than temperature and astronomical data. To our knowledge, no data sets exist that provide for example wind speed, radiation or humidity (dew point) with the high timeliness, global coverage and spatial resolution like the applied 20
temperature data set. Also existing PET data sets are not applicable, because they are provided as figures or files unemployable for further automated usage (e.g. http: //earlywarning.usgs.gov/fews/global/index.php, last access: 9 December 2013).
To estimate the SPEI, the above described PET data and precipitation data are uti-lized. In areas, where the PET cannot be computed, the calculation of the SPEI is also 25
impossible. This occurs north of roughly 30◦N and south of about 50◦S. Examples of
ESSDD
7, 243–270, 2014GPCC Drought Index
M. Ziese et al.
Title Page
Abstract Instruments
Data Provenance & Structure
Tables Figures
◭ ◮
◭ ◮
Back Close
Full Screen / Esc
Printer-friendly Version Interactive Discussion
Discussion
P
a
per
|
D
iscussion
P
a
per
|
Discussion
P
a
per
|
Discuss
ion
P
a
per
As mentioned above, the gridwise combination of SPI-DWD and SPEI yields the GPCC-DI. Examples of the GPCC-DI with averaging periods of 1, 3 and 6 months are shown in Figs. 10, 11 and 12. The combination is possible due to the comparable indicating of both indices (see for example Figs. 3, 7 and 10). A nearly global coverage is possible by the combination of both drought indices. Otherwise the one which can be 5
computed is applied. Only cold arid areas cannot be covered with this approach (e.g. Tibet).
5.1 How to calculate the parameters for the SPI-DWD and SPEI
To estimate the parameters of the distribution function of the SPI-DWD and SPEI, data from the reference period 1961 to 1990 were used. Temperature data were 10
taken from the above mentioned temperature data set, regridded to the GPCC grid
with 1◦
spatial resolution. Due to its higher data coverage and the more rigorous
quality control applied, the Full Data Reanalysis Version 6 with 1◦ spatial
resolu-tion was utilized for the precipitaresolu-tion parameterizaresolu-tion (Schneider et al., 2011, doi: 10.5676/DWD_GPCC/FD_M_V6_100). The parameters for precipitation and PET were 15
calculated for each grid box and averaging intervall seperately.
Depending on the parameters of the gamma distribution used, the distribution has a maximum at zero or above zero. Parameter sets leading to a maximum of the distribu-tion at zero are not applicable to compute SPI-DWD values. This occures in areas with monthly mean precipitation at about zero millimeters. Due to the averaging of several 20
months for the longer averaging periods, the mean precipitation total for this period can result in a maximum of the distribution above zero, even if some months of this period have monthly totals of zero millimeter. Therefore, the SPI-DWD could be calculated for some grid cells only for the longer sampling intervals, for instance in arid regions in India, China, Mongolia, Southern and Central Africa or Southern and Central America 25
ESSDD
7, 243–270, 2014GPCC Drought Index
M. Ziese et al.
Title Page
Abstract Instruments
Data Provenance & Structure
Tables Figures
◭ ◮
◭ ◮
Back Close
Full Screen / Esc
Printer-friendly Version Interactive Discussion
Discussion
P
a
per
|
D
iscussion
P
a
per
|
Discussion
P
a
per
|
Discuss
ion
P
a
per
|
6 How to interpret the index
The provided drought index is a standardized precipitation anomaly. The value of the
index corresponds with the σ-value of a standardized normal distribution and can be
interpreted as the SPI (see Table 1, Lloyd-Hughes and Saunders, 2002). Negative
val-ues correspond with precipitation totals less than normal−drought – whereas positive
5
values conform with precipitation totals wetter than normal. Values between−1 and 1
match to the 1σ-environment and are defined as normal conditions or mild drought/wet.
7 Access to the GPCC-DI
The GPCC-DI can be downloaded as netCDF-files (net, 2014) from the DOI-referenced website ftp://ftp.dwd.de/pub/data/gpcc/html/gpcc_di_doi_download.html. No registra-10
tion is required to download the data.
The file for each month contains seven sets of GPCC-DI data for the different
aver-aging intervals. These averaver-aging intervals are 1, 3, 6, 9, 12, 24 and 48 months. The
GPCC-DI is provided at a regular global grid (−180◦to 180◦longitude and−90◦to 90◦
latitude) with 1◦latitude by longitude grid size. This grid has no projection! One zipped
15
netCDF-file has about 235 KB.
netCDF is a standardized, self describing binary file formate (net, 2014). In the header of each netCDF-file the coordinates of each grid cell and missing values are encoded. We reference the coordinates to the center of each grid cell. The missing
value is−99 999.99, but can be visualized with other values by visualizing software.
20
Suitable software to analyse and convert netCDF-files is listed at the GPCC-DI web-site ftp://ftp.dwd.de/pub/data/gpcc/html/gpcc_di_doi_download.html. Table 2 summa-rizes the applied grid and Table 3 the variables in the netCDF-file. The release of the DOI references implies that ISO 19115 compliant metadata are provided under web addresses constructed from the DOI proceeded by http://data.datacite.org. In addition, 25
Cen-ESSDD
7, 243–270, 2014GPCC Drought Index
M. Ziese et al.
Title Page
Abstract Instruments
Data Provenance & Structure
Tables Figures
◭ ◮
◭ ◮
Back Close
Full Screen / Esc
Printer-friendly Version Interactive Discussion
Discussion
P
a
per
|
D
iscussion
P
a
per
|
Discussion
P
a
per
|
Discuss
ion
P
a
per
tre (CDC) of Deutscher Wetterdienst (DWD), which disseminates ISO 19139 compliant metadata on its data sets through the Geo-Network software application.
The data set is regulary updated at the tenth day of each month. It can be delayed, if input data are not available in time. In this case, it will be delivered upon availability of the missing data.
5
8 Conclusions
The Global Precipitation Climatology Centre Drought Index (GPCC-DI) is a new grid-ded drought index with nearly global coverage. It is a combination of the SPI-DWD and SPEI and based on precipitation analyses from the Global Precipitation Climatology Centre (GPCC) and temperature data from the NOAA NCEP CPC. The spatial resolu-10
tion is 1◦
latitude by longitude. Seven averaging intervals are provided: 1, 3, 6, 9, 12, 24 and 48 months to cover several applications from meteorological droughts to hydro-logical droughts. All averaging intervals are summarized to one downloadable netCDF-file (ftp://ftp.dwd.de/pub/data/gpcc/html/gpcc_di_doi_download.html). The download is free of charge and no registration is required. Due to limitations in the validity range 15
of the underlying drought indices, the GPCC-DI cannot be provided for cold arid areas like the Southern Andes and the Himalayan, so in areas where it would not be of use anyway given the hostile conditions there.
The GPCC-DI is available back to January 2013. If the input data are available, the data set is updated regulary at the tenth of each month. It should only be used for 20
monitoring purposes because the input data are not homogenized. Therefore we don’t recalculate the data set for earlier years.
Acknowledgements. First of all we are most appreciative to the data suppliers who are to the largest extent the worldwide spread National Meteorological and/or Hydrological Services, but also other institutes. These data contributions have put GPCC into the position to provide the
25
look-ESSDD
7, 243–270, 2014GPCC Drought Index
M. Ziese et al.
Title Page
Abstract Instruments
Data Provenance & Structure
Tables Figures
◭ ◮
◭ ◮
Back Close
Full Screen / Esc
Printer-friendly Version Interactive Discussion
Discussion
P
a
per
|
D
iscussion
P
a
per
|
Discussion
P
a
per
|
Discuss
ion
P
a
per
|
ing forward to their further contributions, which are crucial in order to maintain and enhance GPCC’s level of products in terms of scope and quality.
We would like to thank also NOAA NCEP CPC for providing the NOAA NCEP CPC GHCN_CAMS gridded data set and their permission to use these data.
References
5
Anderson, M. C., Hain, C., Wardlow, B., Pimstein, A., Mecikalski, J. R., and Kustas, W. P.: Eval-uation of Drought Indices based on thermal remote sensing of evapotranspiration over the Continental United States, J. Climate, 24, 2025–2044, doi:10.1175/2010JCLI3812.1, 2010. 245
Becker, A., Finger, P., Meyer-Christoffer, A., Rudolf, B., Schamm, K., Schneider, U., and
10
Ziese, M.: A description of the global land-surface precipitation data products of the Global Precipitation Climatology Centre with sample applications including centennial (trend) analy-sis from 1901–present, Earth Syst. Sci. Data, 5, 71–99, doi:10.5194/essd-5-71-2013, 2013. 248
NetCDF Overview, available at: http://www.unidata.ucar.edu/software/netcdf/, last access: 25
15
March 2014. 251
Fan, Y. and van den Dool, H.: A global monthly land surface air temperature analysis for 1948– present, J. Geophys. Res., 113, D01103, doi:10.1029/2007JD008470, 2008. 247, 248
Heim, R. R.: A review of twentieth-century Drought Indices used in the
United States, B. Am. Meteorol. Soc., 83, 1149–1165,
doi:10.1175/1520-20
0477(2002)083<1149:AROTDI>2.3.CO;2, 2002. 244, 245
Jones, P. and Harris, I.: University of East Anglia Climatic Research Unit (CRU), CRU TS3.20: Climatic Research Unit (CRU) Time-Series (TS) Version 3.20 of High Resolution Gridded Data of Month-by-Month Variation in Climate (January 1901–December 2011), available at: http://badc.nerc.ac.uk/view/badc.nerc.ac.uk__ATOM_
25
_ACTIVITY_3ec0d1c6-4616-11e2-89a3-00163e251233, last access: 1 November 2013. 247
Lawrimore, J., Heim, R. R., Svoboda, M., Swail, V., and Englehart, P. J.: Beginning a new era of drought monitoring across North America, B. Am. Meteorol. Soc., 83, 1191–1192, doi:10.1175/1520-0477(2002)083<1191:BANEOD>2.3.CO;2, 2002. 247
ESSDD
7, 243–270, 2014GPCC Drought Index
M. Ziese et al.
Title Page
Abstract Instruments
Data Provenance & Structure
Tables Figures
◭ ◮
◭ ◮
Back Close
Full Screen / Esc
Printer-friendly Version Interactive Discussion
Discussion
P
a
per
|
D
iscussion
P
a
per
|
Discussion
P
a
per
|
Discuss
ion
P
a
per
Lloyd-Hughes, B. and Saunders, M. A.: A drought climatology for Europe, Int. J. Climatol., 22, 1571–1592, doi:10.1002/joc.846, 2002. 245, 246, 251, 256
McKee, T., Doesken, N., and Kleist, J.: The Relationship of Drought Frequency and Duration to Time Scales, Eighth Conference on Applied Climatology, available at: http://ccc.atmos. colostate.edu/relationshipofdroughtfrequency.pdf (last access: 11 May 2012), 1993. 245
5
Palmer, W. C.: Meteorological Drought, Research paper no. 45, available at: http://www.ncdc. noaa.gov/temp-and-precip/drought/docs/palmer.pdf (last access: 14 February 2012), 1965. 244, 245
Peterson, T. C. and Vose, R. S.: An overview of the Global Historical Climatology Net-work Temperature Database, B. Am. Meteorol. Soc., 78, 2837–2849,
doi:10.1175/1520-10
0477(1997)078<2837:AOOTGH>2.0.CO;2, 1997. 248
Pietzsch, S. and Bissolli, P.: A modified drought index for WMO RA VI, Adv. Sci. Res., 6, 275– 279, doi:10.5194/asr-6-275-2011, 2011. 246, 247, 249
Ropelewski, C. F., Janowiak, J. E., and Halpert, M. S.: The Climate Anomaly Monitoring System (CAMS), Climate Analysis Center, NWS, NOAA, 1984. 248
15
Schneider, U., Becker, A., Finger, P., Meyer-Christoffer, A., Rudolf, B., and Ziese, M.: GPCC
Full Data Reanalysis Version 6.0 at 1.0◦: Monthly Land-Surface Precipitation from
Rain-Gauges built on GTS-based and Historic Data, doi:10.5676/DWD_GPCC/FD_M_V6_100, ftp://ftp.dwd.de/pub/data/gpcc/html/fulldata_v6_doi_download.html (last access: 20 March 2014), 2011. 250
20
Sustek, Z. and Vido, J.: Vegetation state and extreme drought as factors determining diff
eren-tiation and succession of Carabidae communities in forests damaged by a windstorm in the High Tatra Mts, Biologia, 68, 1198–1210, doi:10.2478/s11756-013-0268-1, 2013. 245 Svoboda, M., LeComte, D., Hayes, M., Heim, R., Gleason, K., Angel, J., Rippey, B., Tinker, R.,
Palecki, M., Stooksbury, D., Miskus, D., and Stephens, S.: The Drought Monitor, B. Am.
25
Meteorol. Soc., 83, 1181–1190, 2002. 247
Thornthwaite, C.: An approach towards a rational classification of climate, Geogr. Rev., 38, 55–94, 1948. 247, 249, 264
Tsakiris, G. and Vangelis, H.: Establishing a Drought Index Incorporating Evapotranspiration, European Water, 9/10, 3–11, http://ewra.net/ew/pdf/EW_2005_9-10_01.pdf (last access: 10
30
ESSDD
7, 243–270, 2014GPCC Drought Index
M. Ziese et al.
Title Page
Abstract Instruments
Data Provenance & Structure
Tables Figures
◭ ◮
◭ ◮
Back Close
Full Screen / Esc
Printer-friendly Version Interactive Discussion
Discussion
P
a
per
|
D
iscussion
P
a
per
|
Discussion
P
a
per
|
Discuss
ion
P
a
per
|
Vicente-Serrano, S. M., Begueria, S. A. S., and Lopez-Moreno, J. I.: A multiscalar Drought Index sensitive to global warming: the standardized precipitation evapotranspiration index, J. Climate, 23, 1696–1718, doi:10.1175/2009JCLI2909.1, 2009. 246
Wilhite, D. A. and Glantz, M. H.: Understanding: the drought phenomenon: the role of defini-tions, Water Int., 10, 111–120, doi:10.1080/02508068508686328, 1985. 244, 245
5
Willmott, C., Rowe, C., and Philpot, W.: Small-scale climate maps: a sensitivity analysis of some common assumptions associated with grid-point interpolation and contouring, Am. Carthographer, 12, 5–16, 1985. 248
WMO: Lincoln Declaration on Drought Indices, available at: http://www.wmo.int/pages/ prog/wcp/agm/meetings/wies09/documents/Lincoln_Declaration_Drought_Indices.pdf (last
10
access: 1 November 2013), 2009. 246
WMO: Guide to Meteorological Instruments and Methods of Observation, 8, World Meteoro-logical Organization, available at: http://library.wmo.int/pmb_ged/wmo_8_en-2012.pdf (last access: 1 November 2013), 2012. 246
Wu, H., Svoboda, M. D., Hayes, M. J., Wilhite, D. A., and Wen, F.: Appropriate application of
15
the standardized precipitation index in arid locations and dry seasons, Int. J. Climatol., 27, 65–79, doi:10.1002/joc.1371, 2007. 249
Ziese, M., Becker, A., Finger, P., Meyer-Christoffer, A., Rudolf, B., and Schneider, U.: GPCC
First Guess Product at 1.0◦: Near Real-Time First Guess monthly Land-Surface Precipitation
from Rain-Gauges based on SYNOP Data, doi:10.5676/DWD_GPCC/FG_M_100, available
20
ESSDD
7, 243–270, 2014GPCC Drought Index
M. Ziese et al.
Title Page
Abstract Instruments
Data Provenance & Structure
Tables Figures
◭ ◮
◭ ◮
Back Close
Full Screen / Esc
Printer-friendly Version Interactive Discussion
Discussion
P
a
per
|
D
iscussion
P
a
per
|
Discussion
P
a
per
|
Discuss
ion
P
a
per
Table 1.Interpretation of GPCC-DI values, adapted from Lloyd-Hughes and Saunders (2002).
GPCC-DI value Category
2.00 or more extremely wet
1.50 to 1.99 severly wet
1.00 to 1.49 moderatly wet
0.00 to 0.99 mildly wet
−0.99 to 0.00 mild drought
−1.00 to−1.49 moderate drought
−1.50 to−1.99 serve drought
ESSDD
7, 243–270, 2014GPCC Drought Index
M. Ziese et al.
Title Page
Abstract Instruments
Data Provenance & Structure
Tables Figures
◭ ◮
◭ ◮
Back Close
Full Screen / Esc
Printer-friendly Version Interactive Discussion
Discussion
P
a
per
|
D
iscussion
P
a
per
|
Discussion
P
a
per
|
Discuss
ion
P
a
per
|
Table 2.Properties of the used grid.
property value
gridtype lonlat
gridsize 64 800
xname lon
xlongname longitude
xunits degrees east
yname lat
ylongname latitude
yunits degrees north
xsize 360
ysize 180
xfirst −179.50
xinc 1.0
yfirst −89.50
ESSDD
7, 243–270, 2014GPCC Drought Index
M. Ziese et al.
Title Page
Abstract Instruments
Data Provenance & Structure
Tables Figures
◭ ◮
◭ ◮
Back Close
Full Screen / Esc
Printer-friendly Version Interactive Discussion
Discussion
P
a
per
|
D
iscussion
P
a
per
|
Discussion
P
a
per
|
Discuss
ion
P
a
per
Table 3.Description of the used variables in the netCDF-files.
name description
ESSDD
7, 243–270, 2014GPCC Drought Index
M. Ziese et al.
Title Page
Abstract Instruments
Data Provenance & Structure
Tables Figures
◭ ◮
◭ ◮
Back Close
Full Screen / Esc
Printer-friendly Version Interactive Discussion
Discussion
P
a
per
|
D
iscussion
P
a
per
|
Discussion
P
a
per
|
Discuss
ion
P
a
per
|
Fig. 1. Monthly mean temperature in Kelvin for January 2014 from the NOAA NCEP CPC
ESSDD
7, 243–270, 2014GPCC Drought Index
M. Ziese et al.
Title Page
Abstract Instruments
Data Provenance & Structure
Tables Figures
◭ ◮
◭ ◮
Back Close
Full Screen / Esc
Printer-friendly Version Interactive Discussion
Discussion
P
a
per
|
D
iscussion
P
a
per
|
Discussion
P
a
per
|
Discuss
ion
P
a
per
|
ESSDD
7, 243–270, 2014GPCC Drought Index
M. Ziese et al.
Title Page
Abstract Instruments
Data Provenance & Structure
Tables Figures
◭ ◮
◭ ◮
Back Close
Full Screen / Esc
Printer-friendly Version Interactive Discussion
Discussion
P
a
per
|
D
iscussion
P
a
per
|
Discussion
P
a
per
|
Discuss
ion
P
a
per
|
ESSDD
7, 243–270, 2014GPCC Drought Index
M. Ziese et al.
Title Page
Abstract Instruments
Data Provenance & Structure
Tables Figures
◭ ◮
◭ ◮
Back Close
Full Screen / Esc
Printer-friendly Version Interactive Discussion
Discussion
P
a
per
|
D
iscussion
P
a
per
|
Discussion
P
a
per
|
Discuss
ion
P
a
per
|
ESSDD
7, 243–270, 2014GPCC Drought Index
M. Ziese et al.
Title Page
Abstract Instruments
Data Provenance & Structure
Tables Figures
◭ ◮
◭ ◮
Back Close
Full Screen / Esc
Printer-friendly Version Interactive Discussion
Discussion
P
a
per
|
D
iscussion
P
a
per
|
Discussion
P
a
per
|
Discuss
ion
P
a
per
|
ESSDD
7, 243–270, 2014GPCC Drought Index
M. Ziese et al.
Title Page
Abstract Instruments
Data Provenance & Structure
Tables Figures
◭ ◮
◭ ◮
Back Close
Full Screen / Esc
Printer-friendly Version Interactive Discussion
Discussion
P
a
per
|
D
iscussion
P
a
per
|
Discussion
P
a
per
|
Discuss
ion
P
a
per
|
ESSDD
7, 243–270, 2014GPCC Drought Index
M. Ziese et al.
Title Page
Abstract Instruments
Data Provenance & Structure
Tables Figures
◭ ◮
◭ ◮
Back Close
Full Screen / Esc
Printer-friendly Version Interactive Discussion
Discussion
P
a
per
|
D
iscussion
P
a
per
|
Discussion
P
a
per
|
Discuss
ion
P
a
per