Measuring risk-taking incentives in the
U.S. retailing industry
The evolution of executive compensation schemes and how asset tangibility
and digitalisation significantly affect the relationship of managerial incentives
and risk-taking policy for retailers
Author: José Jorge Alves de Almeida
Advisers: Dr. Zoltan Novotny-Farkas and Prof. Geraldo Cerqueiro
Dissertation submitted to the department of Católica Lisbon School of Business and Economics in partial fulfilment of the requirements for the double degree in MSc Finance
I hereby declare that this is my own work and the use of all material from other sources has been properly referenced and fully acknowledged.
I
Abstract
This paper reveals the relationship between managerial compensation and firm risk-taking for retailers. Theory suggests that stock-option base payments produce incentives for managers to take on risky projects and adopt a risky investment policy, decreasing their risk aversion effect of delta. However, a change relatively to the nature of business or in the firm’s asset tangibility may affect the meaning of investment’s riskiness and consequently take an effect on managers’ risk-taking decisions. Over time, retailers have become more technological and therefore less tangible compared to traditional retailers that operate both online and offline. This paper extends previous literature by providing a more tractable understanding between the managerial incentives and risk-taking decisions across levels of asset tangibility by thoroughly analysing the evolution of technological versus traditional retailers in the U.S.
Key Words: Executive Compensation, Managerial Incentives, Risk-taking incentives, Asset tangibility, Retail industry, Digital retailing, CEOs, Top 5 Executives, US, UK
II
Contents
Abstract ... I Figures ... III Tables ... IV 1. Introduction ... 1 2. Literature ... 22.1. Stock option incentives ... 2
2.2. Causality in managerial incentives and risk-taking decisions ... 4
2.3. Asset tangibility ... 6
3. Hypotheses development ... 7
4. Sample collection and construction of variables ... 9
4.1. Summary statistics of compensation ... 10
4.2. Firm characteristics ... 13
4.3. Summary statistics of firm characteristics ... 14
5. Regression analysis ... 15
5.1. Investment policy and managerial risk-taking incentives ... 15
5.1.1. CAPEX and managerial incentives ... 15
5.1.2. R&D and managerial incentives ... 19
5.2. Financial policy and managerial risk-taking incentives ... 23
6. Small sample ... 26
6.1. Objectives and sample description ... 26
6.2. Compensation schemes of U.S. and UK digital retailers ... 27
6.3. Adoption of investment policy and stock awards to top executives ... 30
7. Conclusion ... 32 References ... V Appendix ... IX
III
Figures
Figure 1: Retail asset hierarchy... 7
Figure 2: Development of compensation structure 1992-2011 ... 13
Figure 3: Total Executive Compensation U.S. and UK ... 27
Figure 4: Performance versus Non-performance remuneration, N Brown Group ... 30
Figure 5: CAPEX and equity award offerings (1) ... 31
Figure 6: CAPEX and equity award offerings (2)... 31
IV
Tables
Table 1: Classification of U.S. retailers by level of asset tangibility ... 8
Table 2: Summary statistics of firm characteristics for all U.S. retailers ... 10
Table 3: Summary statistics for compensation (all firms) ... 11
Table 4: Summary statistics for compensation (split according to asset tangibility) ... 12
Table 5: Regression on CAPEX ... 17
Table 6: Regression on CAPEX (split according to digital and non-digital) ... 19
Table 7: Regression on R&D ... 21
Table 8: Regression on R&D (split according to digital and non-digital) ... 22
Table 9: Regression on book leverage ... 24
Table 10: Regression on book leverage (split according to digital and non-digital) ... 25
Table 11: Sample firms ... 27
Table 12: Executive directors' compensation (2010-2014) ... 28
Table 13: Executive directors' compensation (2010-2014), split according to CEO and executive managers ... 29
Table 14: Spearman’s Correlation Coefficient Test for regression (CAPEX) ... IX Table 15: Spearman's Correlation Coefficient Test for regression (R&D) ... IX Table 16: Spearman's Correlation Coefficient Test for regression (book leverage) ... IX Table 17: Exchange rates USD - GBP ... IX Table 18: List of proxy statements and annual reports used for Section 6 ... X Table 19: Compensation plan for top executives of selected U.S. digital retailers (2010 to 2014) ... X Table 20: Compensation plan for top executives of selected UK digital retailers (2010 to 2014) ... XI Table 21: Definition of variables used in the study (part I) ... XI Table 22: Definition of variables used in the study (part II) ... XII
1
1. Introduction
Given the recent growing usage of equity-based compensation in the form of stocks or options, the sensitivity of an executive’s wealth has significantly increased with this. It resulted in implications for the firm and its shareholders. This paper analyses the sensitivity of firm executives’ portfolios (wealth) to changes in the firm’s stock price (delta) and to changes in the stock return volatility (vega). By controlling for CEO pay-performance sensitivity, it is shown that a high vega is associated with riskier policy choices. Although theory shows that investment in research and development as well as leverage is seen as risky, whereas investments in capital expenditure, such as property and plant, are seen as less risky. Some findings in this paper show that depending on the nature of business (and respective asset tangibility), in retailing, some of these relationships may have a contrary significant meaning, as a result of a change in sense of riskiness. This is the case for digital retailers and retailers with a low asset tangibility ratio.
The sensitivity of a CEO’s wealth to the stock price can be seen as aligning manager incentives with shareholder interests. It is assumed that stockholders combine delta and vega to maximise their investment but control for risk. This combination can be applied dependant on the nature of the firm, to expose executives to more or less sensitivity and lead them in the direction of the right investment policy choice. Therefore, when delta increases, the executive will try harder as he will gain more and suffer more loss, in line with shareholders which eliminates agency costs. Increased risk exposure will affect the firm, and its shareholders, as well as the executives if their wealth is linked to the firm’s. Hence, this tends to lead to a risk averse approach by firm management.
On the other hand, extending option-based compensation increases the executives’ wealth sensitivity to the stock return volatility which provides a convex payoff. The higher the stock return volatility, the higher the wealth. This incentivises executives to take on risky projects and adopt a risky investment policy, decreasing the risk aversion effect of delta.
Following Coles et al. (2006), this paper extends their work by analysing which effect vega and delta have on investment as well as firm risk. The association across firm characteristics, investment policies and executive compensation is examined for U.S. retailers. It is found that a higher vega in digital retailers relates to more investment in CAPEX, less R&D expenditure and an increase on the leverage firm policy.
The rest of the paper is organised as follows. The next section discusses the most relevant literature to provide a background on executive compensation and bring retailers into context. Section 3 describes the development of the main hypotheses of this paper, while Section 4 describes the construction of the sample and outlines the empirical methods used to control for endogeneity and to isolate causation. Section 5 presents evidence on the relationship of investment and finance policies to delta and vega.
2
Section 6 provides additional research to the empirical findings found in previous section, by analysing the compensation structure in detail, as well as the relation to investment firm’s policy and benefits from it. This analysis is based on a comparison of U.S. retailers to UK low tangible digital retailers. Section 7 concludes the paper.
2. Literature
Over the past two decades, managerial incentives have been subject to a long debate in the academic literature. The literature on agency theory supports that shareholders should link CEOs’ compensation and wealth to changes in firm performance. By linking their pay, it is possible to align managers’ and investors’ risk preferences. Therefore, undiversified risk-averse managers can be incentivised to pursue riskier NPV opportunities (Jensen and Meckling, 1976; Guay, 1999; Core and Guay, 1999).
The link between shareholders and top executive directors (including the CEO) can be direct or indirect, based on the nature of pay schemes. Pay-for-performance is identified as a direct link, such as in the form of stock options, restricted stock (RS) or long-term incentives awards (LTIAs). On the other hand, indirect incentives are made as a result of adjustments through accounting-based bonuses, sporadic adjustments on salary levels and option grant sizes, among others. The focus of this paper is on the effects of equity incentives, which have been well-discussed in academia, due to their substantial representation in compensation schemes of top management executives (including the CEO). Hall and Murphy (2002) document the exponential growth of stock offerings in executive compensation over time. This reaches a high of 40 percent of total compensation for the S&P 500 CEO’s in 1998. Therefore, it should be reviewed why and when stock options are to be used as there are several examples as to when this can go wrong, as Ju et al. (2014) show.
2.1.
Stock option incentives
The literature around the effects of equity incentives for risk-taking decisions’ can be segmented into two major groups: (1) Researchers have given their contribution on the relationship between a firm’s characteristics and its compensation scheme. Results show that corporate characteristics, such as value, performance, profitability, board composition and legal internal corporative code, aligned with equity-based pay take a significant impact on the firm’s strategic policy. (2) On the other hand, several papers contributed with evidence on the relation between compensation structure and firm performance. These results show that shareholders regulate the managerial risk preferences of their executives in order to achieve beneficial results for themselves1.
Across researchers, Jensen and Murphy (1990) are suggested to be one of the major references in the current literature for this topic. They examined the agency prediction that CEOs are only incentivised
3
to act on the behalf of their shareholders’ and in their best interest if they are offered an incentive scheme, like pay-for-performance. To reach this conclusion, the authors analysed the magnitude of several incentive tools in the compensation scheme. It is suggested that a dollar-for-dollar measure for option delta is closely associated to managerial percentage ownership. Later on, Hall and Liebman (1998) present a contradictory argument to Jensen and Murphy’s findings. Hall and Liebman show an alternative method for stock option valuation based on option delta. This takes into consideration a dollar change in option value with respect to a one percent change in the stock price. With this, the authors intend to avoid high dependency on a time horizon and the exclusive focus on CEOs’ wealth movements relative to the company’s value, which is what Jensen and Murphy do. In addition, Hall and Liebmann present evidence that there was a significant increase of the pay-for-performance sensitivity2 for 1980 to 1994. This is mainly due to an increment of 33 percentage points (from 57% to 90%) in the amount of options held by CEOs, during the respective time range.
However, Smith and Stulz (1985) and May (1995) give a great contribution by introducing the two sided effect from an overexposure to delta by risk-averse managers on additional firm risk. In their analysis, the authors argue that risk-averse managers can reduce firm risk or even reject risky, positive net present value (NPV) projects, as excessive management stock holding (wealth tied to the firm’s performance) can represent a potential cost. May (1995) supports this view by showing evidence that managers with very large stock holdings tend to prefer risk-reducing acquisitions.
Moreover, convexity starts to play an essential role in mitigating risk, as it provides a balance in the effort of choice versus volatility. Hemmer et al. (1999) underline the benefit that arises by increasing convexity in executive compensation when there is a relation between managerial incentives and firm risk.
The option vega measures this convexity and can be obtained as the Black-Scholes partial derivative of option value with respect to a 0.01 change in stock return volatility. By looking at the effects of CEOs’ wealth convexity on the stock price in detail, Guay (1999) initiates a literature debate on the causal relation between vega and corporate policy. He shows that the relation between vega and stock volatility is positive, and documents that compensation incentives take an impact on managerial decisions, which in turn has consequences on the firm’s risk profile. However, literature also supports that excessive incentives on pursuing riskier projects (with an objective on higher returns) can produce a negative effect on vega. This is shown by Lambert et al. (1991), who show that a convex payoff structure of options may not be sufficient to compensate for the exposure to such a high level of risk.
2To sustain their point, they segment firms into percentiles according to their stock performance. They explain that median of total compensation for the CEO is $1 million if the companies’ stock has a “thirtieth percentile annual return (-7.0 percent) and is $5 million if the firm’s stock has a seventieth percentile annual return (20.5 percent)” (Hall and Liebman, 1998, p. 6). This shows a great difference in pay between poorly performing and well performing companies, indicating great sensitivity in the pay-for-performance relation.
4
Although manager ownership can resemble alignment between shareholders and managers, approaches by Demsetz and Lehn (1985) and Morck et al. (1988) show that at extremely high levels of manager ownership, the firm may experience an inverted U-shaped relationship between managerial ownership and firm performance. These findings show a negative relation between high levels of ownership and firm performance (referred as managerial entrenchment). This is verified in practical terms when managers gain so much power that they authorise themselves to use the firm in their own interest instead of acting in the best interest of shareholders. On the other hand, the empirical results by Himmelberg et al. (1999) suggest that managerial ownership is used as a tool to minimise agency costs.
2.2.
Causality in managerial incentives and risk-taking decisions
Causality on the vega-firm relation has been a much debated subject among researchers, mainly due to problems of potential underlying and omitted primitive factors when determining the relation between vega and equity risk. In order to control endogenous issues, and using a more refined empirical method with control on CEOs’ option delta, Coles et al. (2006) extend the literature by documenting the causality relationship between vega and corporate policies. Their findings support the view that a high vega (higher sensitivity to the firm’s stock price volatility) encourages risk-taking. The empirical results denote a significant relation between managerial incentives and the degree of risky policy implementations, with the following relationship: firms with higher values for vega end up with higher leverage, more R&D spending, lower capital expenditure and a reduction of diversification.
A different stream of research suggests the divergent reactions for exposure to other risk-taking incentives. Chava and Purnanandam (2010) make the effort to expand literature in the risk-taking causality to other executive roles. They focus on the different managerial choices taken by CEOs vs. CFOs when exposed to different levels of risk-taking incentives. The results demonstrate that CFOs’ risk-taking incentives lead to less risky debt-maturity choices and less accruals management, while CEOs’ incentives are related to leverage and cash balances. However, none of these studies were sufficient to provide significant evidence on the potential influence of CEOs on CFOs’ accounting decisions. Nevertheless, along these lines, prior studies that use vega as the independent variable show a positive relation of vega and debt (Cohen et al, 2000) and stock return volatility (Cohen et all, 2000; Guay, 1999).
By using a relatively similar monitoring governance approach, Core et al. (1999), defend that a potential method to identify governance problems is to compare the firm’s managerial stock ownership to the firm’s peers group. Therefore, researchers argue that the board should regulate ownership levels through target ownership plans, which can be used as a tool to mitigate actual or potential governance problems by requiring managers to detain a certain minimum level of ownership. This would avoid poor performance from low managerial ownership levels which has been evidenced. The authors also identify the influence of CEOs’ decisions on the board of directors as an inefficiency factor that can
5
influence shareholders. CEO compensation may not be regulated in a way that supports the maximization of shareholders returns. Therefore, target compensation plans should be adopted as a solution when the board of directors identifies governance problems, in order to move the company to a more appropriate governance structure.
In addition, Hayes et al. (2012) provide evidence on how exogenous shocks from the adoption of a new accounting standard can have an impact on the causal relation between option-based compensation and risk-taking decisions. This is shown on the basis of FAS 123R in 2005, which is a revised standard that required the use of fair value instead of the cost-base method when measuring compensation. Compliance with the new regulation led firms to reduce their level of stock option offerings due to a change the valuation method of options as this became more costly, and therefore a less attractive remuneration tool for shareholders. Nonetheless, this study provides great support for the impact of options on convexity levels in the executive compensation scheme.
Moreover, Ju et al. (2002) argue that corporate risk-taking can be led by call options due to the causal relation between managerial risk aversion and the firm’s investment policy, mainly for technological investment. In the effort to provide continuity, Lewellen (2003) shows results on the decrease of the managerial risk-taking for stock options that are in the money. Similarly, she argues that stock options dishearten leverage several times.
Other researchers focus on analysing the level and structure of CEOs’ compensation scheme in the banking sector, and how this differs to non-bank firms. Houston and James (1995) present a positive relation between CEO ownership and market-to-book ratio, however, such evidence is significantly lower in the banking sectors. The authors believe that it can be explained by highly regulatory limitations imposed by the banking regulatory agencies. These impose restrictive and limitative regulations on the sector in order to prevent bankers from taking advantage of short-term benefits to the detriment of long-term sustainability. The fact that banks as financial institutions are highly regulated, leveraged and secured by deposit insurance mechanisms, leads researchers to conclude that regulation, debt ratio3 and securitization of banks takes a significant effect on the pay-for-performance of CEOs in the banking sector.
Guay (1999) uses vega as the dependent variable, finding a positive relationship to firm dimension, investment opportunities and R&D intensity. Similarly, several researchers analyse the relation of delta and policy choices. Using delta as the dependent variable (Bizjak et al., 1993; Core and Guay, 1999), authors analyse delta being composed of firm attributes, whereas others see delta as the independent variable, such as Aggarwal and Samwick (2002a) who regress capital expenditure on delta. It becomes
6
clear that the causality can be perceived from both sides for vega and delta, as dependant and independent variables.
In general, it can be said that these parallel but independent findings of the literature suggest that it is critical to account for policy choices and firm characteristics jointly when determining managerial compensation.
2.3.
Asset tangibility
Over the last century the retailing industry has experienced a constant evolution due to continuous adjustments from technology to product and service innovation which retailers were forced to take on to stay competitive. In 2014, the retailing industry represented two thirds of the U.S. GDP and worldwide recorded total sales of $22 trillion (Farfan, 2015). Considering this development, this paper links the evolution of executive compensation with managerial risk preferences in the retail industry. The retail sector is influenced by several trends and forces, globally and locally. Regulation has a significant influence on retail, now more than ever, especially the adoption of international accounting standards. The revision of FAS 123, which introduced accounting for stock-based compensation, caused a change in how firms compensated their employees as the standard complicated accounting rules. Economic impacts as well as social or demographic changes effect customers’ behaviour fundamentally and therefore, retailers. One of the reason for these shifts is an increased usage of technology which makes retail more accessible and transparent for customers. Technology has a much stronger influence than offline advertising or shopping. This leads more traditional retailers to higher investments on research and development to be the first of technological innovations. At the same time, this means that retailers are reducing their asset tangibility as the need for digitalisation increases, being forced to adjust operations in the new face of technology. It is a vicious circle of customers changing behaviour and consumption habits simultaneously with retailers going offline and digitalising4.
Following the main purpose of this paper, a general review on asset tangibility is relevant in order to assist in understanding the implications and effects that tangibility can have on retailers’ performance and risk-taking decisions made by their management team.
Nowadays, the retail sector faces a variety of external and internal challenges that continue to test the ability of retailing firms to create future value. This can be indicated by how widely spread out performance across the retail sector is. The different levels of performance are due to divergent utilisation of tangible assets. These are used in more, or less, effective and efficient ways. To illustrate this, retail asset hierarchy can be looked at Figure 1 which shows the asset hierarchy model developed by Williams and Acito (2007).
7
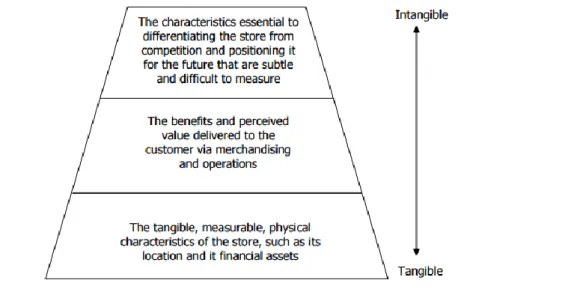
Figure 1: Retail asset hierarchy
The asset hierarchy model is a conceptual model presented by Williams and Acito (2007) to recognise the value of (in)tangible assets based on each hierarchic level in the context of retailing.
Tangible assets are shown at the most basic level, forming the foundation of all operations for any retailer. At the bottom level, the store (layouts, location, equipment, etc.), financial assets and inventory can be found. There are the less tangible assets at the middle level. These include information system, software for an accurate and efficient pricing and merchandising strategy as well as all the remaining mechanisms to support a strong relationship with all respective stakeholders (suppliers, customers, etc.). At the top of the pyramid, the most intangible assets are found. These are inherent in visionary leadership, the innovation procurement and in the differentiation of the firm functional areas.
At last, asset tangibility is also a major determinant of the firm’s ability to finance its investments externally (Almeida and Campello, 2007). The asset tangibility ratio shows to be an interesting metric of analysis, in order to examine how the causality between managerial incentives and risk-taking policy differs across retailers for different levels of asset tangibility. Moreover, it is important to study how these results can be associated with the business operations of the firm. No relevant literature that describes the effect of asset tangibility on executive compensation incentives can be found which makes this paper one of the first to examine the relationship.
3. Hypotheses development
This study extends the existing literature on causal relationship between managerial compensation and investment and financial policy. It shows a more tractable look into the retail industry and how pre-determined asset tangibility takes a major impact on either firm policy or managerial incentives in order to promote continuous development on a more effective and satisfying response to shareholders’ needs. As argued in the literature, the implementation of “value-maximizing investment and financial policy” involves mutual causality between shareholders’ regulation of vega, along with delta, and
pre-8
determined firm characteristics (Coles et al. 2006). This can be in the form of general and firm-specific human capital, production technology, asset tangibility, growth opportunities, industry and segmentation and ability to preserve firm’s intellectual property (meaning service, operation or product).
Considering digitalisation as a major source of innovation, retailers have made constant adjustments responding to changes in the consumption habits of shoppers over the last decade. As a result, riskier investments were made, mainly because of a superior investment in R&D as a guarantee of a more reliable and reactive response to market needs. Due to the nature of retailing, a consistent observation is made that more digital and online present retailers have a generally lower asset tangibility, compared to more traditional and offline retailers, which record the highest level of tangibility. The latter include for example stores and restaurants. As a result, retailers were split in three main layers based on a match between their asset tangibility ratio and the level of digitalisation of their operations as Table 1 shows.
Table 1: Classification of U.S. retailers by level of asset tangibility
The split of a total of 2,747 U.S. retailers listed on the Compustat Execucomp Database, for 1992 to 2011, with SIC codes ranging from 5200 to 5990. Low asset tangibility is classed as a tangibility ratio up to 24 percent. Medium groups the retailers with a ratio between 24 and 53 percent, whereas a high asset tangibility stands for ratios above 53 percent.
As a consequence of digitalisation, shareholders and the management team faced new challenges as the asset structure of firms changed. Statistics show an increased investment in R&D which resulted in retailers becoming less tangible due to a more growing and present technological component in the asset structure of the firms (Hagberg et al., 2004).
To address this change in the core business of retailing firms, shareholders play a key role in the regulation of optimal levels of compensation, and in particular of stock options, which are broadly considered as the main drivers of convexity in compensation plans. Convexity is affecting managers daily as it gives the right incentives to maintain firm risk when deciding on financial and investment policies. Thus, by offering options to managers, shareholders try to mitigate the wealth-firm risk agency problem, incentivising management to pursue positive, but risky, NPV projects. In other words, “convexity in compensation makes risk more valuable to managers, higher vega should implement riskier investment and financial policies and higher return volatility” (Coles et al., 2004, p. 8). However, this fact gains even more relevance if we consider that opposing to shareholders, managers are risk-averse undiversified individuals, who have the possibility of changing firm risk with their investment policy choices. It is empirically shown that management teams might be willing to forgo positive NPV projects as the costs to increase firm risk seems higher than the potential benefits arising from firm value. As Amihud and Lev (1981) state, risk-averse managers are likely to pursue less than optimal
9
firm risk. This is to the objective of protecting their own firm-specific human capital which does not have any value other than in the company the manager is currently at.
In terms of investment policy, an increase in vega can produce a stronger incentives for a CEO to invest the firm’s capital in riskier assets. For instance, R&D expenditure is normally seen as a risky investment compared to CAPEX as it is more intangible (Bhagat and Welch, 1995; Kothari et al., 2001). This is mainly driven by moving investment away from tangible assets, such as PPE (property, plant and equipment). Finally the financial policy is affected by a change in vega, in the sense that higher vega will incentivise managers to increase the firm’s leverage, and therefore increases the overall risk of the firm.
Consequently, it seems relevant to understand the impact of managerial incentives and suitable firm characteristics in the strategic policy of retailing firms across the different levels of asset tangibility. Therefore, the following hypothesis has been developed:
Hypothesis A: An increase on vega should lead to more investment in R&D expenditure, lower
investment in CAPEX and increase total leverage.
To support the empirical analysis, the effects of delta are tested too. This is based on the empirical evidence shown across existing literature and in particular on policy choices and firm risk-taking decisions. However, as stated by John and John (1993) there are no clear conclusions with regards to the sign of the effect that a higher delta can have on a change in risk to debtholders. Complementary to this, Guay (1999) argues that an increase in option delta can lead to an overexposure of managers to even more risk, causing managers to opt for less risky projects. Hence, a second hypothesis is formulated:
Hypothesis B: An increase on delta should decrease R&D expenditure, leverage and increase CAPEX.
4. Sample collection and construction of variables
The data sample consists of all U.S. firms listed on the Compustat Execucomp Database and the Compustat annual industrial files for 1992 to 2011, inclusive. The total compensation for the top management executives are obtained from Execucomp. This includes salary, bonus, total value of restricted stock granted, total value of stock options granted (using Black-Scholes), long term incentive awards (LTIAs), and total cash compensation (TCC). The top management executives are annually ranked by TCC which is made up of salary and bonus. As this study focuses on retailers, only these are used. Firms outside of the SIC range 5200 to 5990 are eliminated.
10
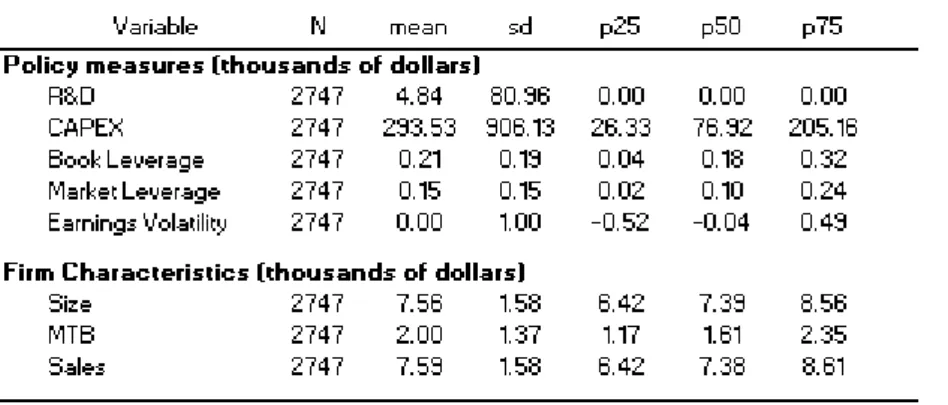
Table 2: Summary statistics of firm characteristics for all U.S. retailers
The data includes the firm specific characteristics of 2,747 US retailers listed on the Compustat annual industrial Database, for 1992 to 2011, with SIC codes ranging from 5200 to 5990. The details about the formulation of each variable is presented in Table 21 and 22 (appendix).
Table 2 shows firm-specific data obtained from the Fundamentals Annual tab of Compustat. After data requirements, the observations differ between 12,573, for R&D, and a maximum of 16,213, for Sales. It was not possible to obtain the required information for all retailers which is why the number of observations varies for the analysed policy measure. Firms that have no investment in R&D, capital expenditure and leverage are eliminated.
To support the hypotheses of this paper, a comparison between retailers to firms of other industries is drawn in section five. Excluded are financial institutions and utilities as these can lead biased results. The information for these firms is obtained from Compustat Execucomp Database. Similarly, number of observations varies as information is not provided for all firms.
As a measure of management incentives, delta is defined as the ‘change in the dollar value of the executive’s wealth for a one percentage point change in the stock price’ (Coles et al., 2006, p. 439). Vega is the ‘change in the dollar value of the executive’s wealth for a 0.01 change in the annualized standard deviation of the stock returns’ (Coles et al., 2006, p. 439). Both metrics were computed and provided by Dr. Novotny-Farkas, Lancaster University Management School.
4.1.
Summary statistics of compensation
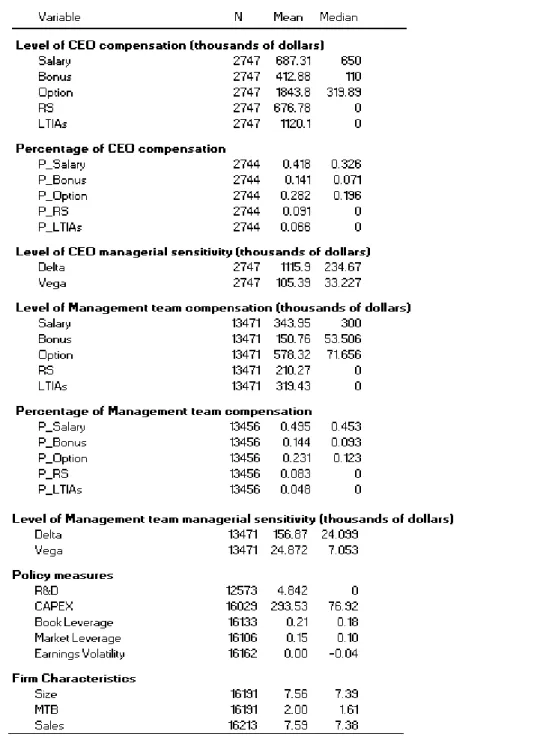
Table 3 presents summary statistics for the full period 1992 to 2011 on annual compensation variables of the top management executives and CEOs. There are 2,747 CEOs and 13,472 management executives. The CEO is separated from other executives for these statistics to obtain more observations. The variables are categorised under CEO characteristics, firm characteristics and investment and financial policies. The total annual compensation across the top management executives sums up to $1,602.73 thousand on average. On the other hand, the average CEO earns $4,740.93 thousand dollars as total compensation. His salary, bonus and options are higher than for management executives, whereas the latter have more LTIAs and RS. Salary is the largest component of the remuneration plan for both CEO and top executives. Options form the second largest component on average.
11
Table 3: Summary statistics for compensation (all firms)
Summary statistics on the compensation structure and the firms and their respective policy measures for overall sample, for the full period 1992 to 2011. Annual compensation variables are split by top management team and CEO position. The details about the formulation of each variable is presented in Table 21 and 22 (appendix).
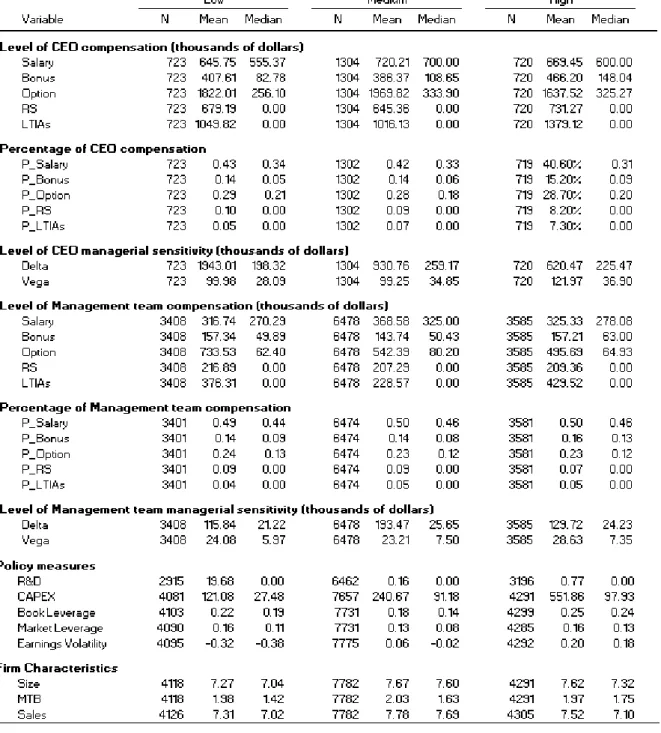
Table 4 presents summary statistics on compensation for firms at different asset tangibility levels. The firms are divided into high, medium and low tangibility to compare whether there is a difference in compensation for executives and different tangibility levels. It can be underlined that retailers with a more hybrid operational activity, i.e. digital and traditional which is seen as operating as a medium asset tangibility firm, offer the highest compensation package. It is five percent above the overall average. Salary seems to be highest in medium tangible firms, whereas RS, LTIAs and bonuses are lowest. Therefore, these are highest in highly tangible firms which offer a lower salary. This applies for CEOs and top management executives.
12
Table 4: Summary statistics for compensation (split according to asset tangibility)
Summary statistics on the compensation structure and the firms and their respective policy measures across three distinct asset tangibility layers, for 1992 to 2011. Annual compensation variables are split by top management team and CEO position. The details about the formulation of each variable is presented in Table 21 and 22 (appendix).
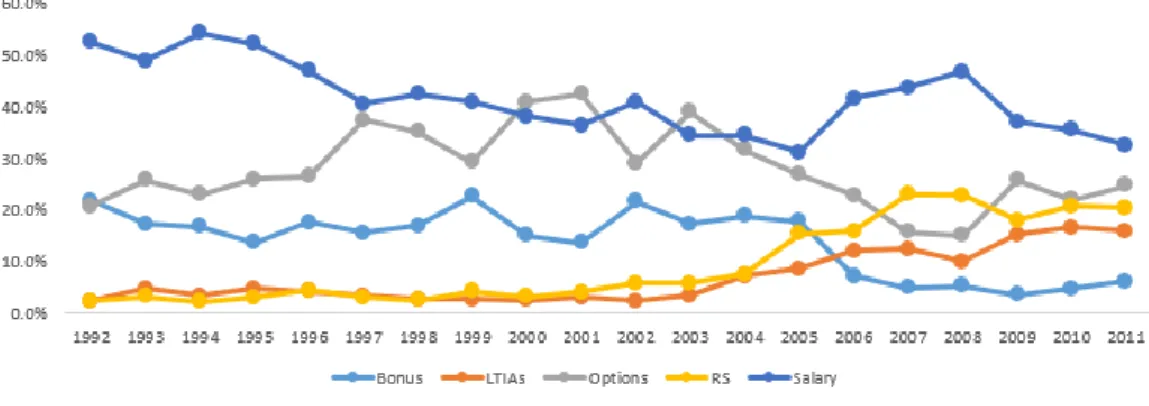
Figure 2 shows the evolution of each component of the compensation plan. This includes salary, bonus, stock options, RS and LTIAs. It can be seen that salaries decreased substantially over time, both in dollar terms and as a percentage of compensation, and was consequently substituted by other pay components. This might be an indication of the development of aligning incentives between the management team (including the CEO) and shareholders. However, a temporary rebound is recorded between 2006 and 2008, due to a reduction in the number of options offered as part of top executive remuneration. Following this transition momentum, salary is partly replaced by a higher fraction of pay
13
coming from options, RS and LTIAs, as these increased after the adoption of FAS 123R. Moreover, vega (delta) tend to be superior (inferior) in firms with higher asset tangibility. Overall, the mean (median) vega is 105.39 (33.23). The mean (median) delta is 1,115.85 (235.67). For both vega and delta, the mean is significantly higher than the median which means that the data is positively skewed as a large amount is on the left side. Moreover, the mean is sensitive to extreme values but no outliers were excluded to not diminish the sample size.
Figure 2: Development of compensation structure 1992-2011
The chart shows the development of each pay components and their weight on the overall compensation structure, for all executive directors of the total of 2,747 U.S. retailers considered in the sample data. The details about the formulation of each variable is presented in Table 21 and 22 (appendix).
It can be underlined that salary continues to represent the main form of pay component. Looking at CEOs’ remuneration across overall retailers, salary and stock options weight the most of the total compensation plan, with 41.80 percent and 28.20 percent, respectively. In accordance to the average in retailing, high tangible firms prefer salary as compensation form as it sums up to 41.60 percent. While and still analysing the same layer of tangibility, options, RS and LTIAs show a fairly equal weight in the executive compensation of CEOs with 7.30 to 8.20 percent. Over time, median vega has decreased for CEOs in retailing for 2000 to 2008. It decreased by 26 percentage points on average from $3,340.22 to $634.86 as for a 0.01 change in stock return volatility. A significant drop can be noticed during 2006 and 2007. This is the period during which a majority of U.S. firms start to comply with the new accounting standard FAS 123R. A lower median vega for low tangible firms is related to an inferior monetary remuneration due to more volatile results, such as cash flows, recorded by highly digital retailers. Considering that options are the major component in compensation that increases convexity, measured by vega, the literature shows that in general, vega decreases with the reduction of option usage.
4.2.
Firm characteristics
The policy measures considered for investment and financial purposes are: (1) R&D, treated as research and development expenditure; (2) CAPEX, seen as net capital expenditure (capital expenditure less sales of PPE); (3) Book Leverage, defined as total book value of long-term debt, including the current portion, deflated by total book value of assets, (4) ROA, defined as EBITDA divided by total book
14
value of assets (5) Market-to-Book, defined as the market value of equity plus the book value of total liabilities deflated by total assets, (6) Sales, treated as logarithm of sales to proxy for firm size, and Asset Tangibility, defined as the book value of PPE deflated by book value of total assets.
In addition, and consistent with the existing literature, total cash compensation (salary plus bonus) is considered as a proxy of risk aversion of the top executive management team. However, a paradox in existing literature can be found where two opposite perspectives are plausible. Berger et al. (1997) explains that longer tenure and higher cash compensation are associated to CEOs with superior level of both embeddedness and risk aversion. Contrary to that, Guay (1999) states that CEOs with greater total cash compensation rather invest outside the firm towards optimal portfolio levels to achieve a better diversification. The higher the cash compensation, the more likely their diversification which consequently leads to less risk aversion in their decision making process as they themselves are diversified and will not suffer much if the firm values decreases, hence, they take on additional risk.
4.3.
Summary statistics of firm characteristics
The lower part of Table 3 and 4 provides summary statistics of the firm characteristics, including a deeper analysis of the sample by splitting it based on the firms’ tangibility levels. Results are in line with related studies about asset tangibility and capital structure. The literature implies that tangibility matters as it allows creditors to more easily repossess assets of a firm that goes bankrupt. Therefore, it increases potential borrowing capacity. Consistently, from the view of credit supply of capital structure, the data shows that the tangibility level of a firm is an important driver of leverage (financing policy) and CAPEX (investment policy). Just like tangibility helps a firm to raise new debt, redeployability of assets has the same function. The more different tasks an asset can fulfil, the more popular and the more liquid it is (Campello and Giambona, 2013).
In contrast, low tangible firms show to concentrate their focus on R&D when it comes to investment decisions. A plausible explanation is related to the fact that low tangible retailers operate in a more digital environment, in which firms have superior needs for regular updates on their source of innovation in order to stay competitive in the market. Retailers today have a new sense of urgency when it comes to harnessing technology, and it is not just about having a great complementary website or online store. Therefore, more digital and less tangible firms tend to compete in an accelerated pace, with digital innovation dictating the success or failure at the end of the day. A stronger focus on R&D is justified as a source of innovation for retailers to solidify links with customers. With regards to remaining policy variables, obtained results in this paper are similar to values reported in related studies, such as Barclay et al. (2003) and Queiroga (2014).
Overall, there is sufficient evidence to underline that asset tangibility has an influence on the structure of compensation contracts. This might indicate that firms adjust their corporate policies in order to
15
promote growth with limited risk exposure. Additionally, the CEO is not the only one who suffers from the impact of these changes. The top management executives are undergoing a change of their compensation as well. Moreover, regarding firm characteristics it appears that no major changes occurred due to changes in asset tangibility. Firms with lower tangibility invest mainly in R&D to promote more efficiency towards digital retailing while more tangible retailers opt to invest the double in PPE in comparison to other layers of tangibility.
5. Regression analysis
The hypotheses developed in section 3 are taken into consideration on the following empirical tests, presented in the following sub sections. To explain the causality between management incentives and the firm policy based on asset tangibility for the U.S. retail sector, I apply a random-effects model on regressions performed. This is the best choice of regression due to the lack of need for any in-time control of heterogeneity across firms and respective variables. This empirical method deviates from Coles et al. (2006), who applies a fixed effect regression approach for the empirical analysis. Moreover, the use of control variables in my regression analysis intends to identify their explanatory meaning on the dependent variable and to check whether the effect of these control variables is in fact significant. Thus, by holding a set of variables constant, I isolate the effect of asset tangibility in three distinct levels (low, medium and high) in an attempt to attribute meaningful results to my study.
5.1.
Investment policy and managerial risk-taking incentives
This section describes how risk-taking forms incentives for CEOs and top executives managers to implement a riskier investment policy. Literature argues that firms that have a higher vega, will have more debt, spend more on R&D, but less on CAPEX and are inclined to be less diversified. Therefore, due to the dynamic development in the retail sector, I analyse the effects of managerial risk-taking incentives set by shareholders on retailers’ investment policy. Comparable results are based on (1) their asset tangibility ratio (low, medium or high), (2) the technological development of their core operations (digital versus non-digital retailers).
At last, all the regressions performed follow the assumption that investment policy and the structure of compensation are jointly set up and not at different points in time. Therefore, contemporaneous values of vega and delta are used in the regressions presented in the following sub sections, rather than lagged variables.
5.1.1. CAPEX and managerial incentives
While controlling for vega and delta as the primary explanatory variables, this and subsequent sections will include several firm specific explanatory variables, classified accordingly to the following categories: valuation, solvency, operating efficiency, operating profitability, financial risk and price behaviour. It is underlined that these variables are selected in the intention to maximise the explanatory
16
power of the model without losing consistency to relative literature on this subject, as the model follows Coles et al. (2006), Guay (1999), Servaes (1994), Bhagat and Welch (1995), and Opler et al. (1999), among others.
The component cash compensation is included as an explanatory variable due to significant weight on top executives’ remuneration plan, especially in retailing (accounting an average of 55.9 percent). Besides the fact that pay-in-cash is a standard practice, total cash compensation, as salary and bonus, represents an excellent managerial motivation to accomplish high goals in the short-term. Consistent with literature the sign of the relation between investment policy and cash compensation is positive, which is compatible with the view that cash compensation is still built around profit targets and therefore, meeting these targets can lead to lucrative bonuses.
Operating income before depreciation (OIBD) is commonly referred to as operating profit. This component will provide the right enforcement to the explanatory power of the regressions that are performed. Higher probability may be associated with the adoption of suitable incentive compensation plans, such as stock options plans, which consequently increases vega values. It is also plausible to support the view that a stronger operating income favours business growth and therefore higher investment policy. Drivers of firm performance and financial health are gathered from the intersection of several papers written on the topic and are combined in order to achieve better empirical results. The considered variables are the following: surplus cash, Return on Assets (ROA), market-to-book and cash. Due to a secondary focus on asset tangibility as a condition to the optimal compensation scheme, overall tangibility and book leverage were included as well. Directly related to each other, they will provide the main basis of analysis and explanatory meaning to this study. The empirical regression is formally stated as follows:
CAPEX = α + β1∗ delta + β2∗ vega + β3∗ cash compensation + β4∗ OIBD + β5∗ surplus cash + β6
∗ ROA + β7∗ market − to − book + β8∗ book leverage + β9∗ overall tangibility Table 5 shows regression results for CAPEX given for CEO and the top management executives, respectively. As a result of similar outcomes from both panel A and B, the following empirical interpretation will agglomerate the CEO and top executive positions as top managerial team.
17
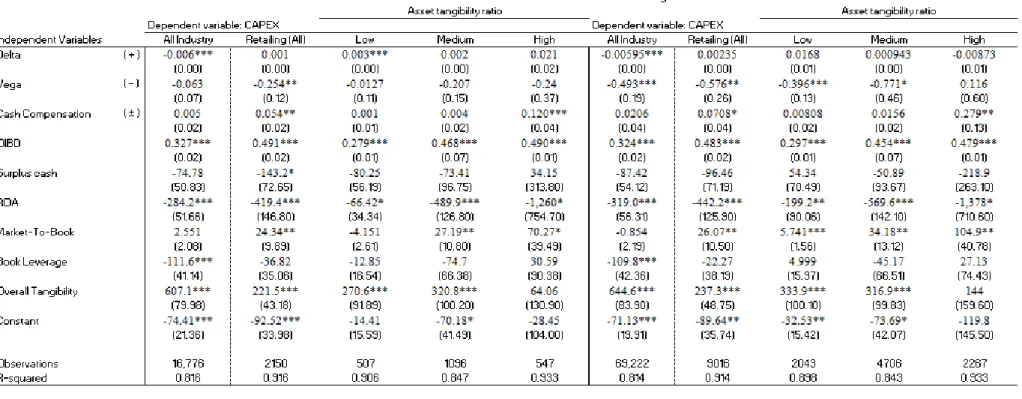
Table 5: Regression on CAPEX
The table shows the regression results for CAPEX as a dependant variable, given for CEO and the top management executives. The statistics are shown for all industries, the whole retailing sector and for retailers split across the three distinct asset tangibility layers. The period covers 1992 to 2011. The all industry column is included as benchmark for the entire market system, in which I excluded financial institutions and utilities. The details about the formulation of each variable is presented in Table 21 and 22 (appendix).
18
The sign behind the independent variables indicates which relationship has been supported by the literature for vega, delta and cash compensation. In the left column, coefficient results are shown for firms from all industries, except financial institutions and utilities, to provide a comparison between retailers and non-retailing firms. In accordance to existing literature, the coefficient of vega is negative and statistically significant for the sample of all retailers. This implies that riskier incentives are associated to lower capital expenditure, such as investments in property, industrial buildings or equipment to increase the scope of their operations. However, this relationship could also be a result of either a transitory change in the scope of the business (for instance, to upgrade the firm’s physical assets) that harmed the ability to track perfectly normal levels of managerial incentives or even a short-term decision taken by the board of directors to alter the investment policy, with negative constraints on top executives’ incentives. Analytically, an increase of one standard deviation in vega translates into a decrease of five percent in investment in CAPEX (from the mean CAPEX of $4,842 to $4,588 thousand).
Cash compensation and OIBD show a positive influence on CAPEX, at statistical significance of one percent. Both variables have a positive link to firm performance. Therefore, an increment in CAPEX as a result of such increase on either one of these control variables could represent a permanent or temporary superior investment on expanding the scale of business and hence, will improve operating results.
Tangibility appears to have a positive effect and is significant at one percent for the all industries. However, it seems to have a lower explanatory power when this is reduced to only retailers. Nevertheless, it is interesting to verify the decreasing effect of stock-based incentives when retailers become less tangible. This fact supports the proposition that the more tangible the retail operational service is, the higher the riskier incentives on investing on complementary business service, such as digital retailing.
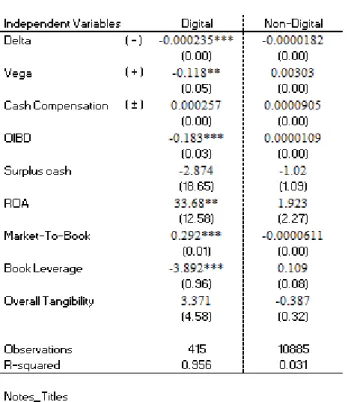
As previously mentioned, the ongoing changes due to digitalisation in retailing have resulted in several new opportunities for businesses (Quelch & Klein, 1996), new firms (Mols, 2000), business and firm models (Sorescu et al., 2011) and forms of trading and selling (Gloor, 2000). Therefore, I perform a second regression in order to further understand the differences between managerial incentives and investment policy on digital retailers. The corresponding results are shown in Table 6. It distinguishes between digital and non-digital retailers which shows the contradictory effects by retailers who are already digitalised versus the ones who are still modernising and upgrading their retailing process.
19
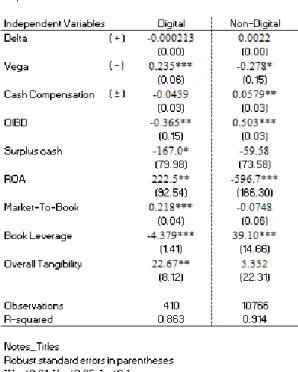
Table 6: Regression on CAPEX (split according to digital and non-digital)
The table shows the regression results for CAPEX given for the top management executives (including CEO), with division according to digital versus non-digital retailers. Time range is from 1992 to 2011. The details about the formulation of each variable is presented in Table 21 and 22 (appendix).
The convexity of the top managerial team with CAPEX is positive at a significance of one percent. This effect supports the prediction that CAPEX is treated as a risky investment for already digital retailers. The only way for these to further grow the business is to take on additional risk by expanding with CAPEX. This is contradicting literature. An example for this is Amazon, a low tangible digital retailer, which invested in three new distribution centres in Poland to expand its logistics capacity and solidify growth in Eastern Europe in 2013 (Bryan, 2013).
Spearman’s correlation coefficient tests presented in Table 14 (appendix) do not show much correlation between the variables. It indicates how an independent and a dependent variable are associated. Therefore, a negative coefficient indicates the dependent variable moves in the opposite direction when the independent variable moves. A coefficient of zero indicates that there is no correlation between the variables at all. A coefficient of one indicates that the variables are perfectly related.
5.1.2. R&D and managerial incentives
An OLS estimation is carried out. R&D forms the dependent variable that will serve as a proxy for a better understanding about how stop-based incentives can have an effect on investments in innovation in the retail sector. Following the same approach, I perform several analyses with the intention to provide empirical evidence on this topic from the perspective of retailers as a whole, across asset tangibility and finally between digital retailers and non-digital retailers. Following the same approach as taken in the last section, similar independent variables expressed in the previous analysis were kept
20
in order to have mostly comparable results within the investment policy section. One additional variable is included with short-term investments. This being said, the regression is empirically expressed as:
R&D = α + β1∗ delta + β2∗ vega + β3∗ cash compensation + β4∗ OIBD + β5∗ surplus cash + β6∗ ROA
+ β7∗ cash and ST investments + β8∗ market − to − book + β9∗ book leverage + β10
∗ overall tangibility
Table 7 presents the regression results for both the CEO (Panel A) and top management executives (Panel B) on R&D. Contradicting the literature, vega presents a negative relation with investment in R&D at ten percent significance. In contrast to all U.S. listed firms, retailing firms (and in particular low tangible firms) reduce their investment in R&D by $22.4 when they experience a raise in CEO convexity by one percent. The contradiction, that retailers move in an opposite direction to all other industries, might be explained by attempting to generate future growth by moving a partial investment from innovation to working capital investments, and/or capital expenditure, and therefore substituting the investment focus found in section 5.1.1.
Even though there is a slight lack of significance across all asset tangibility levels, the obtained evidence should lead to an extended discussion, with the intention to conclude further empirical tests in the future. Other investment alternatives (such as M&A and working capital) should be included to obtain more tractable conclusions on the effects of managerial stock-based incentives. Moreover, with the exception of ROA, all the remaining control variables seem to present the expected coefficient sign. The positive coefficient from ROA can be explained by low tangible retailers. Their cash flows are more dependable on innovation and intangible assets, supporting the foundation that positive returns generated from assets in place can incentivise an increment in R&D in order to achieve competitive advantage and support further growth. Apart from that, Table 15 (appendix) shows with the Spearman’s correlation coefficient that there is no major correlation among variables of the regressions.
Panel B of Table 7 shows that the observed results are consistent with results for the risk-taking incentives from CEOs on R&D. The top management team of medium and highly tangible retailers have a positive, but not significant, convexity with R&D. Although strong not statistically, this provides further support on the view that R&D can be taken as a riskier investment when the management team is incentivised to go beyond market expectations. Market-to-book also has a contradictory meaning for the risk incentives of the top management team, which supports the assumption that overvalued retailed invest more on R&D. The remaining control variables present the expected signs and are predominantly significant. Correlation tests for the regression are expressed in Table 15 (appendix). It presents lower levels of correlation among variables.
21
Table 7: Regression on R&D
The table shows the regression results for R&D as a dependant variable, given for CEO and the top management executives. The statistics are shown for all industries, the whole retailing sector and for retailers split across the three distinct asset tangibility layers. The period covers 1992 to 2011. The all industry column is included as benchmark for the entire market system, in which I excluded financial institutions and utilities. The details about the formulation of each variable is presented in Table 21 and 22 (appendix).
22
R&D expenditure has been increasingly presented in retailers’ financial statements. For instance, the integration of the internet in all forms of retailing and the impact of digitalization goes far beyond the phenomena of e-commerce. With this in mind, Table 8 shows a split in the obtained results from digital versus non-digital retailers.
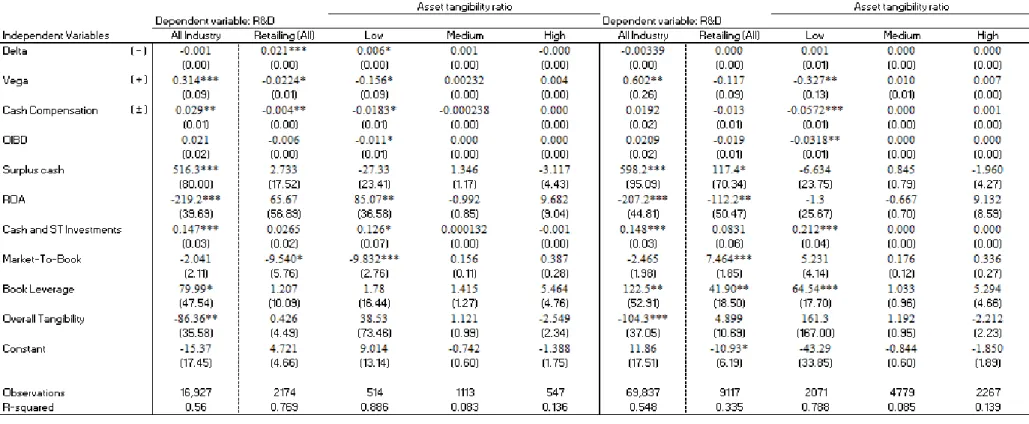
Table 8: Regression on R&D (split according to digital and non-digital)
The table shows the regression results for R&D given for the top management executives (including CEO), with division according to digital versus non-digital retailers. Time range is from 1992 to 2011. The details about the formulation of each variable is presented in Table 21 and 22 (appendix).
Even though there is a lack of significance for non-digital firms, the digitalised retailers show an inverse investment policy in comparison to the policy that Coles et al. (2006) argue. It is therefore aligned to the evidence demonstrated for low tangible retailers. These results were primarily explained due to the opposite behaviour by digital retailers. Looking at the results, the top executive team shows a negative convexity when it comes to an investment commitment in R&D. In other words, too much innovation can cloud the effect of profitable results due to a mismatch between what retail is offering and what the customer really needs in that exact moment – or clients/customers are simply not ready to recognise the value of an increment in innovation supplied by digitalized retailers. Therefore, this culminates in a mismatch between the state of technology and consumer preferences. Bearing this in mind, the top management team shows a movement of investment preferences away from R&D, to potentially allocate it to capital expenditure or alternatively any other form of investment (such as, through merger and acquisition or working capital) that is not empirically represented in this analysis.
23
5.2.
Financial policy and managerial risk-taking incentives
In this section, I address the relationship between risk-taking incentives and the financial policy in the retailing sector. By looking at the marginal effects of options, literature sets expectations on a positive relation between vega and leverage, implying that an increment on leverage will increase firm risk. In addition, shareholders set both capital structure and compensation contracts to discipline managers, where debt is important in aligning shareholders and managers interests (Garvey, 1997). Hence, a negative relation between delta and book leverage is expected for the overall retail industry.
To keep consistency with the previous analysis, I again assume that financial policy and compensation scheme are jointly determined. This implies the inclusion of current values of vega and delta in the following empirical tests instead of lagged variables. The regression is run as follows.
𝐵𝑜𝑜𝑘 𝑙𝑒𝑣𝑒𝑟𝑎𝑔𝑒 = 𝛼 + 𝛽1∗ 𝑑𝑒𝑙𝑡𝑎 + 𝛽2∗ 𝑣𝑒𝑔𝑎 + 𝛽3∗ 𝑐𝑎𝑠ℎ 𝑐𝑜𝑚𝑝𝑒𝑛𝑠𝑎𝑡𝑖𝑜𝑛 + 𝛽4∗ 𝑂𝐵𝐼𝐷 + 𝛽5∗ 𝑚𝑎𝑟𝑘𝑒𝑡 − 𝑡𝑜
− 𝑏𝑜𝑜𝑘 + 𝛽6∗ 𝑐𝑎𝑠ℎ 𝑎𝑛𝑑 𝑆𝑇 𝑖𝑛𝑣𝑒𝑠𝑡𝑚𝑒𝑛𝑡𝑠 + 𝛽7∗ 𝑅&𝐷 + 𝛽8∗ 𝐶𝐴𝑃𝐸𝑋 + 𝛽9∗ 𝑃𝑃𝐸(𝑛𝑒𝑡)
+ 𝛽10∗ 𝑠𝑖𝑧𝑒
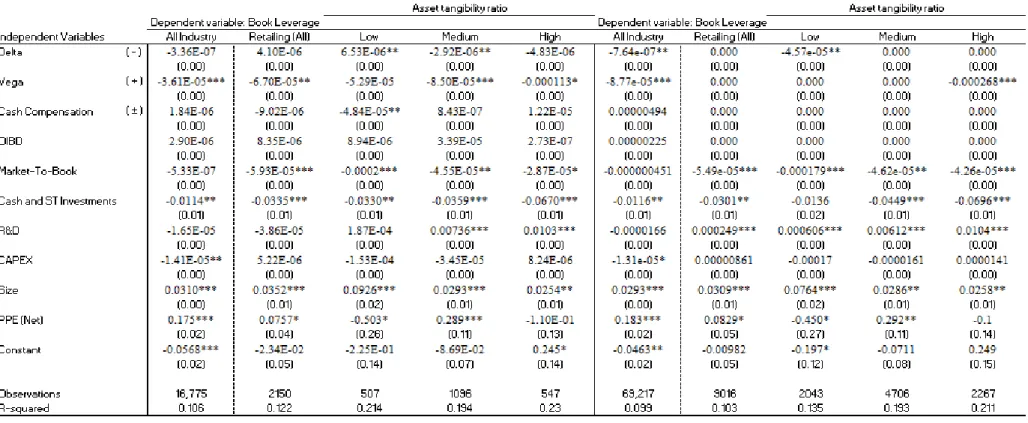
The financial policy is measured as book leverage as market leverage can be volatile. The regression results obtained in Table 9 show the effects from managerial incentives on the financial policy. These are contradictory to the existing literature. Looking at incentives to riskier policy adoption, convexity of CEOs and top management executives has a negative relationship with book leverage. Vega presents a contradictory coefficient and is significant, across three of the four specifications for retailing firms (overall retail sector, low and highly tangible retailers). This supports literature which defends the opinion that firms with high earnings volatility, have shareholders that normally reduce risk-incentives to constrain managers on their preference for riskier projects. Consequently, the firms should be better off in terms of risk of financial distress (John and John, 1993). In addition, Coles et al. (2006) also explain that firms with more growth opportunities have lower debt in their capital structure. However, firms’ CEOs, with a higher vega, are incentivised to undertake on riskier projects (Guay, 1999). This evidence supports once again that leverage and vega should be negatively related, contradicting what is shown by Coles et al. (2006). Although vega’s coefficient presents statistical significance, economically the effect from a change in vega would have a minor impact on medium and high tangible retailers. Complementary to the vega analysis, the results also show a contradictory relationship between delta and book value of debt, only for low tangible retailers. The obtained coefficients for delta are generally similar to those estimated in similar empirical studies where Coles et al. (2006) argue that leverage and delta are substitute incentives for the firm’s financial policy, whereas higher delta implies lower leverage. However, for retailers with low asset tangibility, delta shows a positive coefficient at five percent significance. A plausible interpretation for this could be derived from the fact that firms with high growth results (such as, young retailers with volatile results) could possibly miss their optimal combination of tangible and non-tangible assets in a firm’s production process.
24
Table 9: Regression on book leverage
The table shows the regression results for book leverage as a dependant variable, given for CEO and the top management executives. The statistics are shown for all industries, the whole retailing sector and for retailers split across the three distinct asset tangibility layers. The period covers 1992 to 2011. The all industry column is included as benchmark for the entire market system, in which I excluded financial institutions and utilities. The details about the formulation of each variable is presented in Table 21 and 22 (appendix).
25
Additionally, existing literature still lacks on issues associated to the endogeneity between leverage and tangibility. Managers’ decisions on when opting for leverage in their financial decisions are not clearly explained. An example can be related to credit risk concerns, or any other factor from outside the firm that may affect access to debt.
Table 10 shows the regression results of book leverage split into digital and non-digital firms. Delta is insignificant at ten percent for both columns, therefore, no conclusion can be drawn. Vega is statistically significant at one percent for non-digital retailers, however, with a coefficient of -0.0000664, the economic significance is not very high. Again, cash compensation is not statistically significant for either digital or non-digital firms. Even though the R-squared, which describes how much of a movement in book leverage can be explained by the independent variables, is at 60.3 percent for digital firms, it could be that the number of observations is not large enough to raise the statistical significance of the coefficients. The coefficient of firm size is statistically significant for both digital and non-digital retailers which supports that dependant on the size of firm, a different finance policy will be chosen and therefore, most likely a different compensation structure.
Table 10: Regression on book leverage (split according to digital and non-digital)
The table shows the regression results for book leverage given for the top management executives (including CEO), with division according to digital versus non-digital retailers. Time range is from 1992 to 2011. The details about the formulation of each variable is presented in Table 21 and 22 (appendix).
26
Again, the Spearman’s correlation coefficient test was conducted. The results are shown in Table 16 (appendix). It shows no high correlation between variables.
6. Small sample
This section provides a closer look at the compensation structure offered by digital retailers to their executive directors, including CEOs. In doing this, a further understanding of the several relationships between managerial incentives and risk-taking decisions can be developed. Therefore, I suggest that this section should be analysed in conjunction with section 5, in order to fully understand the overall picture across different analyses.
6.1.
Objectives and sample description
Based on the general results of the large sample analysis that digital retailers show a contradictory relationship between vega and respective investment policies, this section has been developed. According to results, vega has a positive influence on CAPEX and a negative influence on R&D. Considering the importance of such findings, it seems logical to try and understand if any changes occurred in the compensation structure and how remuneration differs between digital retailers in the U.S. and the UK. In this analysis, the state of paid remuneration and the amount of payment is looked at. As currencies differ between the firms, all monetary values are converted into USD. This is done to the exchange rate of the date of the reported value. Exchange rates are obtained from Yahoo Finance as shown in Table 17 (appendix).
There are six sample firms, three are British and three chosen to be from the U.S. All company information is extracted from the firms’ annual reports for each analysed year and referenced in Table 18 (appendix). Due to this, it is difficult to calculate share-based remuneration as some firms do not disclose this in such detailed way. Therefore, the payment components in this section are limited to salary, bonus, equity awards and other awards, which includes defined contribution plans such as pension. The analysis is done for each of the sample firms for a period of five years, which is 2010 until 2014, inclusive, in order to provide a more practical explanation of developments in the two countries, based on possible structural similarities, differences and common trends.
Table 11 indicates the list of firms treated as peer group with fairly similar characteristics and interests. In comparing ‘apples to apples’, it will benefit this study as constituents of a peer group should be fairly similar between each other. .It enables me to achieve a more accurate analysis of the values found in each subsection. The selection criteria for the firms are as follows: SIC code, asset tangibility, size5 and country.
27
Table 11: Sample firms
Peer groups selected from Fundamentals Annual tab of Compustat Database, for 2010 to 2014. The presented tangibility is defined as the five year median of the firm’s asset tangibility, treated as the book value of PPE deflated by book value of total assets. Size shows the book value of total assets in $ million.
At last, and by determining the practical implications of this matter, I set out what I perceive to be the challenges for digital retailers for the next five years as far as executive remuneration is concerned.
6.2.
Compensation schemes of U.S. and UK digital retailers
In the digital retailing segment, firms’ executive compensation scheme has changed immensely over the last five years. According to PwC (2012), firms in the retail sector had to face some challenges. Issues produced by price deflation versus rising costs is one of the main factor. Greater sourcing from overseas, improved technology and the growth of discount stores stand again rising levels of cost inflation which resulted in squeezed profits. Additionally, a lack of consumer confidence has become visible. Consumers are pressured by inflation with simultaneous decreasing salaries and rising concerns of losing jobs as a consequence of further cuts of public spending in 2012. This has serious impacts on how digital firms positioned themselves in the market. Firms were forced to continuously readjust managerial incentives and strategic policies in order to support growth and competitiveness in the more digitalised retailing industry.
An indication of this can be observed by looking at the total compensation levels from top executive directors, which are CEO and top management team. This is displayed in Figure 3. It shows that these differences among the selected firms across the two countries have increased considerably since 2011, which was the year when retailers were hit hard by the economic downturn. As a reaction to this, the three UK digital firms introduced equity awards into their compensation package. Options and LTIAs were added as an important motivator of performance and alignment of interests among the management team and respective firms.
Figure 3: Total Executive Compensation U.S. and UK
The chart shows the development of total executive compensation package across the two geographies (the US versus the UK). Presented figures were previously converted to USD for comparison purposes.