Licenciatura em Ciências de Engenharia de Micro e Nanotecnologias
Paper as a Colorimetric Biosensing
Platform for Tetracyclines Detection in
Milk
Dissertação para obtenção do Grau de Mestre em Engenharia de Micro e Nanotecnologias
Orientador: Elvira Maria Correia Fortunato, Prof. Doutora,
FCT-UNL
Júri:
Presidente: Prof. Doutor Hugo Manuel Brito Águas Arguente: Prof. Doutor Pedro Fernandes Antunes
Vogal: Prof. Doutora Elvira Maria Correia Fortunato
ii
Paper as a Colorimetric Biosensing Platform for Tetracyclines Detection in Milk
Copyright © Beatriz Condeço Pinto Pagará, Faculdade de Ciências e Tecnologia, Universidade Nova de Lisboa.
A Faculdade de Ciências e Tecnologia e a Universidade Nova de Lisboa têm o direito, perpétuo e sem limites geográficos, de arquivar e publicar esta dissertação através de exemplares impressos reproduzidos em papel ou de forma digital, ou por qualquer outro meio conhecido ou que venha a ser inventado, e de a divulgar através de repositórios científicos e de admitir a sua cópia e distribuição com objetivos educacionais ou de investigação, não comerciais, desde que seja dado crédito ao autor e editor.
iv
vi
Acknowledgment
Chegou ao fim uma etapa bastante importante na minha vida. O que parecia tão distante há cinco anos atrás, está agora a chegar ao fim, dando abertura a novas oportunidades e a novos conhecimentos. Foram anos que me fizeram crescer, e que acima de tudo me deram uma outra perspetiva da vida e dos outros. Durante estes anos fui acompanhada por pessoas bastante importantes sem as quais não seria possível ter chegado onde cheguei.
Antes de mais gostaria de agradecer à minha instituição de ensino, a Faculdade de Ciências e Tecnologia da Universidade Nova de Lisboa e ao Departamento de Ciências dos Materiais, por me terem integrado da melhor forma e por me permitirem desenvolver os meus conhecimentos.
Gostaria também de agradecer à minha orientadora, Professora Elvira Fortunato pela transmissão de conhecimentos e por todo o acompanhamento ao longo deste trabalho.
Um especial agradecimento à Carolina Marques pela disponibilidade que sempre teve em ajudar-me e por toda a paciência que demonstrou de forma a esclarecer sempre as minhas dúvidas. Obrigada por toda a ajuda incansável, pela motivação e pela confiança que sempre me transmitiu.
Ao João Ferrão pela ajuda sempre disponível e por todas as opiniões e críticas que também contribuíram para a realização deste trabalho.
A toda a equipa do CENIMAT, pelo bom ambiente, boa disposição e espírito de entreajuda. Aos meus colegas de laboratório, pela companhia das longas horas no laboratório, pelas conversas e bom ambiente.
Aos grandes amigos que criei nestes cinco anos de faculdade, foi um prazer ter-vos conhecido. Sem vocês, não seria a mesma coisa. Obrigada pelos jantares, festas, pelos serões de estudo e de desespero. Fizeram com que valesse a pena. Espero que a vida nos continue a proporcionar mais momentos juntos e que a nossa amizade perdure.
Às minhas amigas de longa data, que apesar de longe estão sempre presentes. Obrigada por todo o apoio e amizade. Sei que são amizades que tenho para a vida.
Ao Cristóvão, obrigada por me aturares estes anos todos. Obrigada pelo apoio, amor e sobretudo pela amizade.
Obrigada à minha família e em especial aos meus pais. São a minha maior motivação e o meu maior exemplo. Sem vocês sem dúvida que não teria conseguido chegar onde cheguei. Vocês são a razão disto tudo. Obrigada pelo apoio incondicional, pelo amor e educação. Estarei em dívida para convosco por todo o esforço que realizaram por forma a permitir a minha integração, o meu crescimento e a minha continuação nos estudos. Obrigada por sempre acreditarem em mim. Espero que se sintam orgulhosos.
Por fim, um agradecimento muito especial às minhas avós que sempre sonharam em presencear este momento, mas que infelizmente não conseguiram realizar esse sonho. Espero que estejam a olhar por mim.
viii
Abstract
Tetracyclines are a type of antibiotic that exhibits activity against most gram-positive and gram-negative bacteria. These antibiotics are often added at subtherapeutic levels to feed to act as growth promoters. Due to its low bioavailability, only a fraction of the antibiotic is metabolized in animals, causing waste. These residues can enter human bodies through the food chain and lead to increased antimicrobial resistance, causing allergic or toxic reactions, which led several countries to implement a maximum level of residues for this type of antibiotic. Most methods of detecting TCs are time consuming or inadequate for field analysis. In this way, an inexpensive, easy-to-execute and fast analytical method is required.
In this sense, in the present work a colorimetric biosensor was developed in paper for the detection of four type of tetracyclines, presenting an alternative in the performance of point-of-care tests. Paper is low-cost, abundant, biodegradable and easy to dispose of by incineration.
The construction of the sensors was performed using Lab-on-Paper technology and is based on the synthesis of gold nanoparticles by reducing a gold salt in which tetracyclines constitute the reducing agent itself. Different concentrations of TCs result in the formation of different colour intensities.
Different concentrations of tetracyclines were tested and analysed using ImageJ software, allowing linear calibration lines to be obtained, that relate the concentration of antibiotics in a range between 0.1 and 10 μg/mL and the arithmetic mean of the RGB channels.
Validation tests of the sensors developed with TC in milk were also performed. It was observed that it is possible to detect this type of antibiotic in pre-treated milk, and four forms of milk treatment were studied.
KEYWORDS: Tetracycline antibiotics; colorimetric assay; gold nanoparticles;
x
Resumo
As tetraciclinas são um tipo de antibiótico que exibe atividade contra a maioria das bactérias gram-positivas e gram-negativas. Estes antibióticos são muitas vezes adicionados em níveis subterapêuticos aos alimentos para animais de modo a atuar como promotores de crescimento. Devido à sua baixa biodisponibilidade, apenas uma fração do antibiótico é metabolizada nos animais, causando resíduos. Esses resíduos podem entrar nos corpos humanos através da cadeia alimentar e levar ao aumento da resistência antimicrobiana, causando reações alérgicas ou tóxicas, o que levou vários países a implementarem um nível máximo de resíduos para este tipo de antibiótico. A maioria dos métodos de deteção de TCs é demorada ou inadequada para análise de campo. Desta forma, é solicitado um método analítico barato, fácil de executar e rápido.
Neste sentido, no presente trabalho desenvolveu-se um biossensor colorimétrico em papel para a deteção de quatro tipo de tetraciclinas, apresentando uma alternativa na realização de testes point-of-care. O papel é de baixo custo, existe em abundância, é biodegradável e é de fácil eliminação por incineração.
A construção dos sensores foi efetuada recorrendo à tecnologia Lab-on-Paper e baseia-se na síntese de nanopartículas de ouro por redução de um sal de ouro em que as tetraciclinas constituem o próprio agente redutor. Diferentes concentrações de TCs resultam na formação de diferentes intensidades de cor.
Foram testadas e analisadas diferentes concentrações de tetraciclinas através do
software ImageJ, permitindo obter as retas de calibração lineares que relacionam a
concentração dos antibióticos num intervalo entre 0.1 e 10 µg/mL, e a média aritmética dos canais RGB.
Testes de validação dos sensores desenvolvidos com TC em leite foram realizados. Observou-se que é possível detetar este tipo de antibiótico no leite pré-tratado, e quatro formas de tratamento do leite foram estudadas.
PALAVRAS-CHAVE: Tetraciclinas; ensaio colorimétrico; nanopartículas de ouro;
xii
Abbreviations
a.u. – Arbitrary Units
AuNPs – Gold nanoparticles
CTAC – Cetyltrimethylammonium chloride
CENIMAT – Centro de Investigação de Materiais CTC – Chlortetracycline
CV – Coefficient of Variation DC – Doxycycline
EDS – Energy Dispersive X-ray Spectroscopy ELISA – Enzyme-linked Immunosorbent Assays FPT – Four Plate Test
FTIR – Fourier-Transform Infrared Spectroscopy LOD – Limit of Detection
LOQ – Limit of Quantitation MRL – Maximum Residual Level OTC – Oxytetracycline
RGB – Red Green Blue
SD – Standard Deviation
SEM – Scanning Electron Microscopy
SPFIA – Solid-phase Fluorescence Immunoassays SPR – Surface Plasmon Ressonance
TC – Tetracycline
TCs – Groupe of tetracyclines antibiotics UV-Vis – Visible and Ultraviolet radiation XRD – X-ray Diffraction
xiv
Symbols
Au – Gold
AuCl4- - Tetrachlorogold (1-)
C – Carbon
CaCO3 – Calcium carbonate
CH2 – Methylene
𝑪𝒍 – Chloride
𝑪𝑯𝟑(𝑪𝑯𝟐)𝟏𝟓N(𝑪𝒍)(𝑪𝑯𝟑)𝟑) – Cetyltrimethylammonium chloride 𝑪𝟐𝟐𝑯𝟐𝟒𝑵𝟐𝑶𝟖•H𝑪𝒍 – Tetracycline hydrochloride
𝑪𝟐𝟐𝑯𝟐𝟒𝑵𝟐𝑶𝟖•H𝑪𝒍•0,5𝑯𝟐O•0,5𝑪𝟐𝑯𝟔O – Doxycycline hyclate
𝑪𝟐𝟐𝑯𝟐𝟒𝑵𝟐𝑶𝟗•H𝑪𝒍 – Oxytetracycline hydrochloride
𝑪𝟐𝟐𝑯𝟐𝟑𝑪𝒍𝑵𝟐𝑶𝟖•H𝑪𝒍 – Chlortetracycline hydrochloride H – Hydrogen
H+ - Hydrogen (1+)
HAuCl4 – Chloroauric acid tetrahydrate
HAu𝑪𝒍𝟒•3𝑯𝟐O – Tetrachloroaurate tri-hydrate
Na – Sodium
𝑵𝒂𝟐𝑩𝟒𝑶𝟕 – Sodium tetraborate buffer
O – Oxygen OH – Hydroxide g – Grams mg – Milligrams mL – Millilitres kg – Kilograms µm – Micrometer µL – Microliter µg – Microgram cm2 – Centimeter squared
cm-1 – Centimeter high to minus 1
m2 – Square meter
m3 – Cubic meter
mM – Millimolar M – Molar
keV – Kilo electron-volt º - Angle
ºC – Degrees Celsius % - Percentage
θ - Bragg Angle
ρfiber – Fiber density
ρpaper – Paper density
IAM – Intensity for amorphous material
I200 – Intensity for 200 peak
𝒃 – Slope
Sa – Standard deviation
xv
xvi
Table of Contents
Introduction 1 1.1 Paper 1 1.2 Biosensors 1 1.2.1 Paper-based biosensors ... 2 1.3 Lab-on-paper Technology 2 1.4 Gold Nanoparticles 2 1.5 Tetracycline antibiotics 3 1.6 State of the art of TCs detection 4 1.6.1 Detection in Milk ... 5Materials and Methods 7 2.1Production Techniques 7 2.1.1 Synthesis of AuNPs in solution ... 7
2.1.2 Construction of paper microplates ... 7
2.1.3 Colorimetric test on paper ... 7
2.1.4 Detection of TCs in milk samples... 8
2.1.5 Paper-based Biosensor Development ... 8
2.2 Characterization Techniques 8 2.2.1 UV-Vis Spectrophotometry... 8
2.2.2 Paper Characterization ... 8
2.2.3 Characterization of AuNPs synthesized on paper ... 9
2.2.4 Digital Analysis ... 9
Results and Analysis 11 3.1Paper Characterization 11 3.1.1 Scanning Electron Microscopy... 11
3.1.2 Energy Dispersive X-ray Spectroscopy ... 12
3.1.3 X-ray Diffraction... 14
3.1.4 Fourier-Transform Infrared Spectroscopy ... 15
3.2 Optimization of the colorimetric test 16 3.2.1 Synthesis of AuNPs in solution ... 16
3.2.2 Synthesis of AuNPs on paper and TCs quantitation ... 18
3.3 Characterization of AuNPs synthesized on paper 24 3.3.1 Scanning Electron Microscopy... 24
3.3.2 Energy Dispersive X-ray Spectroscopy ... 25
3.3.3 X-ray Diffraction... 27
3.4 Detection of TCs in milk samples 28
3.5 Development of the final device 30
Conclusion and Perspectives 31
References 33
Appendix 37
A – UV–vis spectra of AuNPs upon addition of TCs 37
B - Absorbance changes at 526 nm in the presence of different concentrations of TCs 39 C - Influence of the addition of CTAC to the reaction on Whatman paper 41 D - Colour change of the well microplates after 24h of TC deposition 43
xvii
E – Influence of the volume of solutions placed on the wells of the 384-well microplates
in Whatman paper 45
F - RGB analysis for optimization of reagent concentrations used in the process of AuNP synthesis on paper with TC reduction using 384-well microplates on Whatman nº1 paper
47 G - Normalized calibration lines for each TC and their Sensitivity, LOD and LOQ
determination 51
H – Forms of milk sample treatment and solution results 53
xviii
List of Figures
Figure 1.1- Schematic of paper manufacturing...1 Figure 1.2- Surface plasmon absorption bands for AuNPs in the visible light region.
The red and blue curves correspond to dispersed and aggregated AuNPs, respectively. Adapted from [19]. ...3
Figure 1.3- Some examples of tests that are used in antibiotics residues detection in
milk available on the market, and their prices...5
Figure 2.1- Scheme of the experimental procedure of colorimetric tests in paper...8 Figure 3.1- Morphology of the paper substrates used. (A) SEM image of Whatman
paper; (B) SEM image of office paper. ... 12
Figure 3.2- EDS analysis of photocopying paper. (A) SEM image, (B) Cumulative
spectrum of EDS analysis of office paper. ... 13
Figure 3.3- EDS map of office paper. The images were artificially coloured in order to
facilitate their analysis... 14
Figure 3.4- Whatman and office paper XRD patterns and crystalline structures
identification... 14
Figure 3.5- Chemical analysis of paper substrates considered. (A) FTIR-ATR spectra
and identification of the chemical bonds corresponding to the characteristic peaks, (B) Chemical structure of cellulose. ... 15
Figure 3.6- Colorimetric differences observed in solutions containing AuNPs
synthesized from: A) TC, B) DC, C) OTC and D) CTC. E) Reaction mechanism between TC and HAuCl4, adapted from [31]. ... 17
Figure 3.7- (A) Absorbance changes at 526 nm in the presence of different
concentrations of TC. (B) UV–vis spectra of AuNPs upon addition of TC. ... 18
Figure 3.8- Synthesis of AuNPs on paper by reduction with TC, performed on a 96-well
microplate on Whatman and Office papers. ... 19
Figure 3.9- Synthesis of AuNPs on paper by reduction with TC, performed on a
384-well microplate on (A) Whatman paper and (B) Photocopying paper. (a) and (b) columns represents the control. ... 19
Figure 3.10- Synthesis of AuNPs on Whatman paper by reduction with TC, performed
on a 384-well microplate and with deposition of all reagents with a volume of 3 µl. Columns 1 and 2 represent the control... 20
Figure 3.11- RGB analysis of the colorimetric results obtained in the test zones of the
microplate of paper of 384 wells. The results presented correspond to a Buffer concentration of 0.125 M with four different concentrations of HAuCl4. ... 21
Figure 3.12- Colorimetric results were obtained for all TCs under study with addition of
3 µL of 34 mM HAuCl4, 3 µL Buffer with concentration of 0.125 M, and addition of 3 µL of
various concentrations of the different antibiotics. Tests obtained on a 384-well microplate on Whatman paper... 22
Figure 3.13- (A) Calibration ratios of the paper sensor considered for the various TCs. (B) Normalization of the calibration lines. ... 23
Figure 3.14- Absorbance spectra corresponding to the different wells of the 384 well
xix
Figure 3.15- SEM images of AuNPs synthesized in Whatman paper by reduction with
20 µg/ml of TC. (A) Image obtained shortly after TC drying, (B) Image obtained after 24h
of TC deposition... 25
Figure 3.16- Cumulative spectrum for EDS analysis of Whatman paper. (A) EDS obtained shortly after TC drying, (B) EDS obtained after 24h of TC deposition. The chemical elements present in the sample are identified in the spectrum... 26
Figure 3.17- SEM image and distribution maps of elements detected in Whatman paper with addition of TC. The images were artificially coloured in order to facilitate their analysis. ... 26
Figure 3.18- SEM image and distribution maps of elements detected on Whatman paper, 24h after addition of TC. The images were artificially coloured in order to facilitate their analysis. ... 27
Figure 3.19- Comparison between Whatman paper diffractograms with and without AuNPs formed... 28
Figure 3.20- Comparison of the colorimetric results after deposition of milk samples with different concentrations of TC, after different milk sample treatments. Tests obtained on a 384-well microplate on Whatman paper. All the milk sample treatments are described in Appendix H. ... 29
Figure 0.1- UV–vis spectra of AuNPs upon addition of DC. ... 37
Figure 0.2- UV–vis spectra of AuNPs upon addition of OTC... 37
Figure 0.3- UV–vis spectra of AuNPs upon addition of CTC. ... 38
Figure 0.4- Absorbance changes at 526 nm in the presence of different concentrations of DC... 39
Figure 0.5- Absorbance changes at 526 nm in the presence of different concentrations of OTC. ... 39
Figure 0.6- Absorbance changes at 526 nm in the presence of different concentrations of CTC. ... 40
Figure 0.7- Influence of the addition of CTAC to the reaction, in Whatman paper. Line A represents the addition of 2 mM of CTAC and Line C represents the addition of 4 mM of the same reagent. ... 41
Figure 0.8- Colour change (grey to red) of the well microplates after 24h of TC deposition... 43
Figure 0.9- Influence of the volume of solutions placed on the wells of the 384-well microplates in Whatman paper. Columns 1 and 2 are the control. ... 45
Figure 0.10- RGB analysis of the colorimetric results obtained in the test zones of the microplates, corresponding to a concentration of HAuCl4 of 12 mM and the sodium tetraborate buffer concentration of 0.1 M. ... 47
Figure 0.11- RGB analysis of the colorimetric results obtained in the test zones of the microplates, corresponding to a concentration of HAuCl4 of 12 mM and the sodium tetraborate buffer concentration of 0.125 M. ... 47
Figure 0.12- RGB analysis of the colorimetric results obtained in the test zones of the microplates, corresponding to a concentration of HAuCl4 of 24 mM and the sodium tetraborate buffer concentration of 0.1 M. ... 48
Figure 0.13- RGB analysis of the colorimetric results obtained in the test zones of the microplates, corresponding to a concentration of HAuCl4 of 24 mM and the sodium tetraborate buffer concentration of 0.125 M. ... 48
xx
Figure 0.14- RGB analysis of the colorimetric results obtained in the test zones of the
microplates, corresponding to a concentration of HAuCl4 of 34 mM and the sodium
tetraborate buffer concentration of 0.1 M. ... 49
Figure 0.15- RGB analysis of the colorimetric results obtained in the test zones of the microplates, corresponding to a concentration of HAuCl4 of 34 mM and the sodium tetraborate buffer concentration of 0.125 M. ... 49
Figure 0.16- Normalized calibration line of TC... 51
Figure 0.17- Normalized calibration line of DC. ... 51
Figure 0.18- Normalized calibration line of OTC. ... 52
Figure 0.19- Normalized calibration line of CTC... 52
xxii
List of Tables
Table 1.1- Structures of the tetracycline antibiotics studied in this work. Adapted from
[27]. ...4
Table 1.2- MRLs for tetracycline group according to Codex Alimentarius. [31]–[33] ....4 Table 1.3- Main characteristics of screening tests for detection of antibiotic residues in
milk. Adapted From [45]. ...5
Table 3.1- Macroscopic properties of Whatman paper and office paper. [3]... 11 Table 3.2- Sensitivity, LOD and LOQ of each calibration line for all TCs in study. .... 23 Table 3.3- Determination of TC in the pre-treated milk samples. The milk sample
treatments are described in Appendix H. ... 29
Table 3.4- Paper sensor production costs developed for the detection of TCs. ... 30 Table 0.1- Forms of milk sample treatment and results... 53
xxiv
Motivation and Objectives
Tetracyclines are low cost and broad-spectrum antibiotics commonly used for the prevention and treatment of dairy cattle for several bacterial infections or as additives to promote growth in farm animals. The extensive use of this type of antibiotics in veterinary medicine has led to their accumulation indiary food products, such as milk.
In this way, their monitoring is very important in controlling the safety of milk for human consumption because the presence of these drug residues can trigger potential adverse side effects in humans such as allergic reactions in hypersensitive individuals and other long-term health effects, or they can be potential carcinogenic. In fact, at present, up to 10% of people have already been diagnosed to be hypersensitive or allergic to antibiotics. Strict legislative regulations have been imposed for the treatment of animals with antibiotics and maximum residue limits (MRLs) in foods of animal origin, established for residues of antibiotics or their metabolites. Thus, to ensure food safety and protect the health of consumers, there have been lots of efforts to develop various strategies for the detection and quantification of tetracycline in food products. However, most methods of detecting this type of antibiotic are complex, expensive, time consuming or not suitable for field analysis.
Paper has emerged in recent years as a suitable material to be used as support in biological and chemical tests offering several advantages such as low cost, easy handling, disposability, biocompatibility, biodegradability and even ease of disposal by incineration. In this sense, the main purpose of this dissertation is to enhance the properties and advantages offered by paper through Lab-on-Paper technology, developing a colorimetric biosensor to determine the concentration of four types of tetracyclines in milk.
The main steps of this work included:
i. Analysis and characterization of two different types of paper from the structural, chemical and morphological point of view;
ii. Synthesis and characterization of gold nanoparticles obtained by reduction with the tetracyclines under study, in order to obtain a colorimetric detection of the same;
iii. Use of Lab-on-Paper technology in the production of paper sensors for subsequent application to determine the concentration of tetracyclines;
iv. Calibration of the sensors through digital analysis, using aqueous solutions with different tetracyclines concentrations;
v. Optimization of the sensor for the detection of tetracyclines in milk samples. Therefore, this works aims to obtain an innovative, simple and inexpensive method for the detection of tetracyclines in milk samples, thus contributing to the control and reduction of potential adverse side effects in human’s health.
1
Chapter 1
1.
Introduction
1.1 Paper
Paper consists predominantly of a network of cellulose fibers, a polymer composed of glucose monomers bound linearly and covalently by β-1,4-glycosidic bonds. This network is chemically bonded by hydrogen bonds and is organized in the form of microfibrils, forming the crystalline unit of cellulose. Cellulose is one of the main constituents of plant cell walls. Two other major components of plant cell walls are hemicellulose and lignin. Hemicellulose is composed of pentoses and monomers, and forms a strong matrix surrounding the cellulose fibers from hydrogen and Van der Waals bonds. Lignin has a complex and photosensitive structure and is therefore normally removed during the papermaking process. [1], [2]
The material most used as a source of cellulose is the wood of trees, due to its low cost and easy to obtain. Cellulose fibers can also be extracted from bamboo, jute, hemp, flax, cotton and some grasses (wheat, barley or rice). [3]
The manufacture of a paper sheet involves several steps which are summarized in
Figure 1.1. It should be noted that prior to the production of paper the reduction of the
raw material to a fibrous pulp is necessary. The processes of formation of this paste are called pulping processes and can be divided into two types: chemical (removal of the lignin from chemical agents, heat and pressure) or mechanical (grinding of the wood). [2], [3]
Figure 1.1- Schematic of paper manufacturing.
1.2 Biosensors
A biosensor is an instrument that always depends on a transducer and a recognition element with a carrier material. The transducer can detect any interaction between two elements whose affinity is high (antibodies/antigens, enzymes/substrates, receptors and ligands or living cells and analyte that specifically binds to them). This i nteraction is converted into a measurable signal for interpretation by the processor, which then converts it into a measurable output. [4], [5]
They are mainly used for control in the clinical and environmental areas, with the main objective being the development of rapid diagnostic tests for point-of-care. [6]
Stock preparation
Approach flow system
Paper
machine Finnishing/ coating Mechanical
pulp Chemical
pulp
Fillers / additives Coating
Paper
White w ater system
2
1.2.1 Paper-based biosensors
Paper can be hydrophilic and porous, thus providing a natural platform for fabricating microfluidic channels for multiplex analyte detection, making it a good alternative to conventional microfluidics. [7], [8]
The paper biosensors can be divided into 3 categories: Lateral flow assay, that is performed over a strip divided in four different parts (sample application pad, conjugate pad, nitrocellulose membrane that is divided into test and control lines, and adsorption pad). The deposited sample moves easily through capillary forces of the material through a lateral flow in a predefined path in the porous membrane; [9], [10] Dipstick paper, based on immersion in the sample of a strip of paper with pre-deposited reagents; [6], [11], [12]
Microfluidic Paper, based analysis devices which require a relatively lower sample
volume compared to the previous devices. This type of paper biosensor, also called µPADs, can also be constructed in 3D format and usually use a type of colorimetric detection where results can be observed with the naked eye or with the aid of a mobile phone or a portable digitizer. [13], [14]
1.3 Lab-on-paper Technology
Lab-on-paper technology was introduced in 2007 by the need for a platform that uses small volumes of sample and that is sufficiently inexpensive to be widely used, making possible to run multiple diagnostic assays. [15], [16]
This technology can be described as a group of microchannel that provide spatial control of fluid sand and enable fluid transport by capillarity on hydrophilic paper. [15], [16] This microchannel can be created via patterning fabricated by various techniques like photolithography, inkjet printing, stamping, cutting, screen-printing and wax printing. Wax printing is the fastest and simplest fabrication. A solid ink printer and the solid wax is melted before being ejected from the print head, printing in this way the desired design. Then the printed paper is heated in a hot plate, allowing the wax to diffuse vertically through the porous paper. In this way, a hydrophobic barrier is created with the wax, enabling spatial control fluid transport. The device can be encapsulated preventing contamination, degradation and reducing fluid evaporation. [15], [17]The most commonly used paper as a support is chromatography paper Whatman, that has a lower cost comparing with nitrocellulose, used in lateral flow assays or microfluidics. [15]
1.4 Gold Nanoparticles
Gold nanoparticles (AuNPs) properties were probably first described by the year of 1600, when Parcelsus reported a red mixture formed by condensations of a gold colloid. Also Faraday, over 150 years ago, observed that colloidal gold solutions have properties that differ from bulk gold. [18]
Bulk gold has a familiar yellow colour, caused by a reduction in reflectivity for light at the end of the spectrum. But AuNPs, they are capable of absorbing green light at about 520 nm of the visible spectrum, appearing in ruby red. The physical origin of this phenomenon is associated with the coherent oscillation of AuNP surface electrons (localized surface plasmon) induced by the incident electromagnetic field. An absorption band results when the incident photon frequency is resonant with the collective oscillation of the conduction band electrons and is known as the surface plasmon resonance (SPR).
3
The resonance frequency of this SPR is strongly dependent upon the size, shape, interparticle interactions, dielectric properties, and local environment of the nanoparticle.
Also, the aggregation of AuNPs can change their colour from red to blue because of the shift of the surface plasmon band to longer wavelength, where the aggregate could be considered as a single large particle. [18], [19]
Figure 1.2- Surface plasmon absorption bands for AuNPs in the visible light region. The red and blue curves
correspond to dispersed and aggregated AuNPs, respectively. Adapted from [19].
The use of noble metal nanoparticles (such as AuNPs) in biosensing has grown enormously in recent years, mainly due to detection that can often be carried out with the naked eye, yielding rapid, inexpensive and portable detection. [18], [20]
AuNPs features like particle size, shape, composition and surface coating can be manipulated for specific applications such as molecular recognition, chemical sensing and imaging. Furthermore, AuNPs have high surface-to-volume ratio and high surface energy to provide a stable immobilization of a large amount of biomolecules. [21]–[23]
1.5 Tetracycline antibiotics
Tetracycline antibiotics (TCs) were discovered more than 50 years ago, and they have the capacity to prevent the attachment of aminoacyl-tRNA to the ribosomal acceptor (A) site, inhibiting protein synthesis. The first members of the tetracycline group to be described were chlortetracycline and oxytetracycline, discovered in 1940. [24], [25]
TCs are strong chelating agents and both their antimicrobial and pharmacokinetic properties are influenced by chelation of metal ions. TCs molecules contains a linear fused tetracyclic nucleus as a basic skeleton, to which a variety of functional groups are attached. These antibiotics only differ from each other chemically by substituent variations at carbons 5, 6 and 7. [24], [26] In Table 1.1, one can observe the chemical structures of four different tetracyclines.
This type of antibiotics has been widely used in human therapy and animal infections treatment due to their antimicrobial properties, exhibiting activity against most of gram-positive and gram-negative bacteria. Furthermore, in some countries, TCs are added at subtherapeutic levels to animal feeds to act as growth promoters. TCs have low bioavailability so only a fraction of the antibiotic is metabolized in the animals, causing residues. These residues can enter human bodies through the food chain and can lead to increased drug resistance of microbial strains in humans, causing allergic or toxic reactions and leads to a decrease in the efficacy of TCs in the treatment of various diseases. [24], [27]–[29]
4
Table 1.1- Structures of the tetracycline antibiotics studied in this work. Adapted from [30].
Compounds Structure
Chlortetracycline (CTC)
Tetracycline (TC)
Oxytetracycline (OTC)
Doxycycline (DC)
The dramatic increase in the number of species and genera (especially in humans) that have acquired tetracycline resistance as lead to several countries implementing a maximum residue level for this type of antibiotic (Table 1.2). [29], [30]
Table 1.2- MRLs for tetracycline group according to Codex Alimentarius. [31]–[33]
1.6 State of the art of TCs detection
Traditionally, antibiotic residues are detected with inhibition tests, mostly agar diffusion tests, such as the Four Plate Test (FPT), but also fast inhibition tests using an indicator for growth. Immunological tests such as enzyme-linked immunosorbent assays (ELISA), solid-phase fluorescence immunoassays (SPFIA) are also used, as well as other analytical methods like liquid chromatography, photoluminescence detection, surface plasmon resonance spectroscopy, voltammetric analysis and electrochemical immunosensors. [27], [29], [31], [34], [35] Most of the mentioned methods are complex, expensive, time consuming or not suitable for field analysis. In this way, it is requested a cheap, easy to perform and rapid analytical method. [36], [37]
Recently was described a colorimetric assay in solution that uses gold nanoparticles plasmon absorption to realize quick detection of TCs at elevated temperature, based on the reaction mechanism of β-Agonists with HAuCl4. TCs showed the capability of directly
reducing HAuCl4 into atomic gold, which involved oxidation of the phenol group on the
benzene ring, where a quinone-like molecule is formed. [29], [38] Maximum Residual Levels- MRLs (µg/mL)
Milk (cattle and ship)
Muscle (cattle) Liver (cattle) Kidney (cattle) 0.1 0.2 0.6 1.2
5
1.6.1 Detection in Milk
TCs are used at the treatment of clinical mastitis and metritis in cow therapy. Failure to discard milk in an appropriate time following lactating cow treatment could result in the presence of this antibiotics in milk, causing harmful effects on consumers. [39]–[43]
As it was said previously, the most used tests for antibiotics are known as microbial inhibitor tests and immune receptor tests. The same applies to its detection in milk. However, they are not specific for antibiotics and there are reports of positive reactions associated with other inhibitors (lactoferrin, lysozyme or sanitisers), leading to increasing demand in the development of new tests for detection of this type of antibiotics in milk. [36], [37], [40], [44]. Table 1.3 summarizes some tests that are used in antibiotics residues detection in milk (and which are available on the market) and their main characteristics.
The best known test for antibiotics detection in milk is Delvotest, whose first version was developed in the 1970s. [40]
Table 1.3- Main characteristics of screening tests for detection of antibiotic residues in milk . Adapted From [45].
Characteristics
Inhibition of bacterial growth
(Delvotest, Charm Cowside, Copan)
Enzyme immunoassays
(Charm ROSA, SNAP, BetaStar)
Analysis time 1 to 3.5 hours 2 to 10 min
Specificity Nonspecific; broad-spectrum Specific for one or more antibiotics of a class
Advantages Broad-spectrum; good
beta-lactam detection; low cost
Fast detection; specific for one type of antibiotic Disadvantages Nonspecific; slow detection;
inhibitor interference Risk of false negatives
False Positive Presence of other inhibitors in milk
Cross-reaction with other antibiotics within the same
class
Figure 1.3- Some examples of tests that are used in antibiotics residues detection in milk available on the
market, and their prices.
Charm Cowside 25.92 € Delvotest 39.66 € BetaStar 108.20 €
7
Chapter 2
2.
Materials and Methods
2.1 Production Techniques
2.1.1 Synthesis of AuNPs in solution
The experimental method used was based on the study conducted by Shen and his co-workers. [29] The procedure was carried out with hydrogen tetrachloroaurate tri-hydrate (HAu𝐶𝑙4) 0.2 mM and cetyltrimethylammonium chloride (CTAC) at 2 mM, that was used as a stabilizer.
To a 2 mL eppendorf, it was added 0.5 mL of the above solution, sodium tetraborate buffer (pH 9.2) with a concentration of 0.01 M, and different concentrations (between 1-50 μg/mL) of tetracycline hydrochloride. The eppendorf’s were placed in a 70°C water bath for about 15 minutes, thus ensuring the completion of the reaction.
The same procedure was performed for doxycycline hyclate, oxytetracycline hydrochloride and chlortetracycline hydrochloride.
Detailed information about reagents: All reagents are of analytical grade and were used
without further purifications. Tetrachloroaurate tri-hydrate from Acros Organics (HAu𝐶𝑙4•3𝐻2O), Cetyltrimethylammonium chloride from Sigma-Aldrich
(𝐶𝐻3(𝐶𝐻2)15N(𝐶𝑙)(𝐶𝐻3)3), Sodium tetraborate buffer from Sigma-Aldrich (𝑁𝑎2𝐵4𝑂7, 99%), Tetracycline hydrochloride from Sigma-Aldrich (𝐶22𝐻24𝑁2𝑂8•H𝐶𝑙), Doxycycline hyclate
from Sigma-Aldrich (𝐶22𝐻24𝑁2𝑂8•H𝐶𝑙•0,5𝐻2O•0,5𝐶2𝐻6O, ≥98%), Oxytetracycli ne hydrochloride from Sigma-Aldrich (𝐶22𝐻24𝑁2𝑂9•H𝐶𝑙, ≥95%) and Chlortetracycline hydrochloride from Sigma-Aldrich (𝐶22𝐻23𝐶𝑙𝑁2𝑂8•H𝐶𝑙, ≥75%).
2.1.2 Construction of paper microplates
The construction of paper microplates was made by using the technology Lab-on-Paper and had the following steps: Preparation of paper substrates by cutting Whatman nº1 paper sheets and office paper (80 g/cm2 from Naviflator) with the standard size A5 (210 x
148 mm); Drawing of microplate geometry using Adobe Illustrator. Paper microplates were produced with 96 (diameter of 7 mm) and 384 (diameter of 3.38 mm) wells, with a line width of 0.5 mm and a distance of 1 mm from each other; Wax printing, through a
Xerox ColorQube 8570 printer, whose ink reservoirs have blocks of solid Xerox wax.
Finally, diffusion of wax patterns on paper using a hot plate, heating the paper at 120°C for about 2 minutes.
2.1.3 Colorimetric test on paper
Different series of all reagents were tested on different paper microplates in order to achieve optimization of the process. All reagents used in this stage are the same as in
2.1.1, except CTAC, which was discarded in this step, since its addition caused a
decrease in the intensity of the colour in the paper (Appendix C). The procedure with better results was with paper microplate with 384 wells, and has the following steps:
8
Figure 2.1- Scheme of the experimental procedure of colorimetric tests in paper.
2.1.4 Detection of TCs in milk samples
Various forms of milk treatment were analysed, summarized in table 0.4 in Appendix
J. Samples from commercially available Mimosa UHT milk, (stored at 4°C) were used.
The procedure consisted in repeating sections 1. and 2. of section 2.1.3. At the end, 3 μL of the pre-treated milk was deposited with spiked TC concentrations between 0.05 and 20 μg/ml.
2.1.5 Paper-based Biosensor Development
The development of the biosensor essentially involved 3 steps: Wax printing of the
wells and their diffusion on paper, similar to that referred in section 2.1.2; Deposition of the reagents and their drying, and finally, the wax printing of the encapsulation layers (front and back), without their diffusion.
2.2 Characterization Techniques
2.2.1 UV-Vis Spectrophotometry
With the objective of analysing the response of the AuNPs to different concentrations of TCs, the analysis of the solutions by UV-Vis spectrophotometry was performed using TECAN SPARK 10M, incorporated with a High-Speed Monochromater and SparkControl software, for reader control and reduction of data. The AuNPs synthesized on paper were also analysed by UV-Vis spectrophotometry to compare the absorbance spectra of the different wells.
2.2.2 Paper Characterization
To confirm the effectiveness of the paper chosen (Whatman nº1- GE Healthcare) for the developed biosensor, several characterization techniques were used, such as: Scanning Electron Microscopy (SEM), Energy Dispersive ray Spectroscopy (EDS), X-ray Diffraction (XRD) and Fourier-Transform Infrared Spectroscopy (FTIR).
1.
3 µL of gold solution at 0.34 mM was deposited in each well of the paper microplates. Then allowed to dry atroom temperature.
2.
Was added to each well, 3 µL of sodium tetraborate buffer at 0.125 M.Again, was allowed to dry at room temperature.
3.
3 µL of each of the four different TCs solutions in concentrations between0.05 and 100 µg/mL was then deposited, leaving to dry again.
9
2.2.3 Characterization of AuNPs synthesized on paper
The AuNPs synthesized in paper were observed and characterized (morphology, chemistry and structure) using Scanning Electron Microscopy (SEM), Energy Dispersive X-ray Spectroscopy (EDS) and X-ray Diffraction (XRD).
2.2.4 Digital Analysis
The results were analysed from a desktop scanner (Cannon MG5250) and subsequently subjected to an RGB (Red Green Blue) analysis through the ImageJ software. In this way it was possible to correlate, in a calibration curve, the analyte’s concentration and the intensity of the colour of each well.
11
Chapter 3
3.
Results and Analysis
3.1 Paper Characterization
In the present work, two types of paper were used as support for colorimetric assays: office paper and Whatman nº1 paper. In this way, it is important to obtain information about the two structural, chemical and morphological properties, thus characterizing the paper types used in the development of the paper sensor.
In addition, in order to show the differences between these supports, it is also important to know some of their macroscopic properties, referred to in Table 3.1.
Table 3.1- Macroscopic properties of Whatman paper and office paper. [3]
It is possible to observe that office paper presents, in relation to Whatman paper, a smaller thickness and a smaller weight. However, it proves to be much denser and consequently less porous.
The greater the density of a given paper, the less space there is between its fibers. The density is then obtained from the ratio of the weight to the thickness of the paper. Knowing this density value, it is also possible to estimate the total pore volume by relating the density of the cellulose fibers (ρfiber= 1540 kg/m3) to the paper density, according to
Equation 3.1.
𝑃𝑜𝑟𝑜𝑠𝑖𝑡𝑦 (%) = (1 −𝜌𝑝𝑎𝑝𝑒𝑟
𝜌𝑓𝑖𝑏𝑒𝑟) × 100 (3.1)
3.1.1 Scanning Electron Microscopy
In order to observe the surface morphology of the paper substrates used in this study, it was used Scanning Electron Microscopy (SEM). Figure 3.1 shows SEM images of Whatman paper and office paper.
Macroscopy Feature Whatman nº1 Paper Office Paper
Weight (g/m2) 88.0 81.3
Thickness (µm) 180 102
Density (kg/m3) 489 797
12
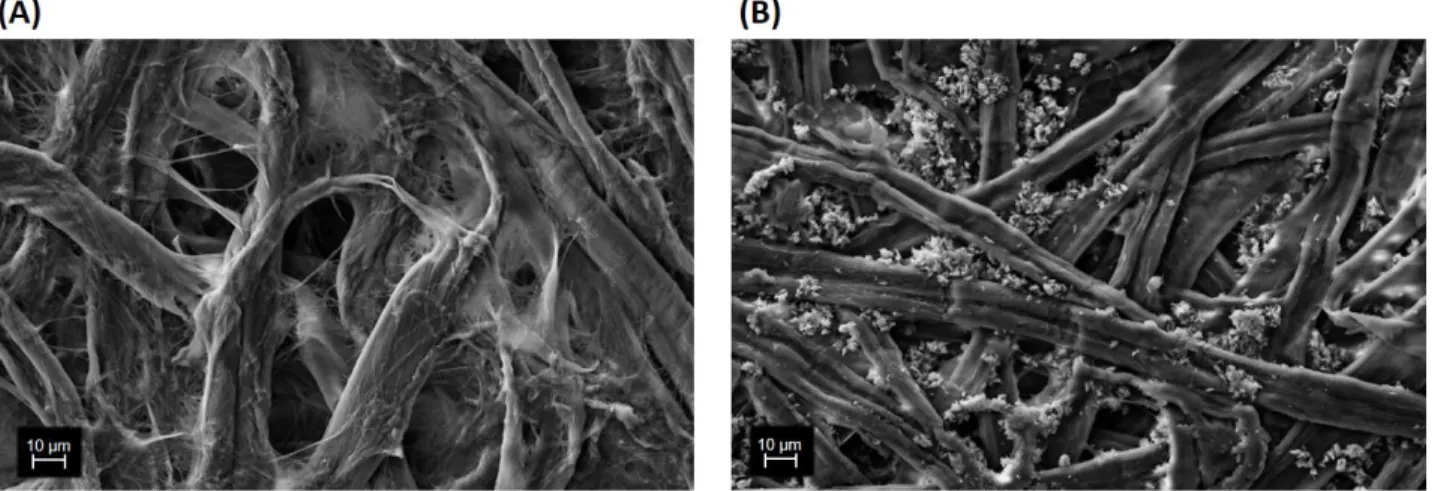
Figure 3.1- Morphology of the paper substrates used. (A) SEM image of Whatman paper; (B) SEM image of office
paper.
Analysing the previous figure, it is possible to observe differences in relation to the morphology of the two paper substrates. In fact, both substrates are mainly composed of a three-dimensional network of cellulose fibers. However, in the SEM image of the office paper, it is observed the presence of small crystalline clusters that possibly correspond to CaCO3, the additive used to give the paper a greater opacity, brightness and whiteness.
In addition, it is found that the cellulose fibers in Whatman paper have a cylindrical structure whereas in the office paper these fibers are flatter. This difference in geometry of cellulose fibers gives the Whatman paper a greater thickness.
Also, as expected, lower porosity of the photocopying paper is observed, since the crystalline agglomerates fill most of the pores between the cellulose fibers, thus making the surface of this paper much more uniform than Whatman paper.
3.1.2 Energy Dispersive X-ray Spectroscopy
In order to complement the results obtained by SEM and thus corroborate the existence of CaCO3 (corresponding to the observed crystalline clusters), an elementary analysis
was performed by Energy Dispersive X-ray Spectroscopy. It is important, however, to note that this analysis is only capable of detecting the relative elements present, so that alone it is not able to provide all the necessary information to identify all the compounds of a sample.
Figure 3.2 shows the SEM image of the office paper and the corresponding cumulative
13
In the EDS spectra it is possible to observe that the highest intensity peaks correspond to carbon (E = 0.26 keV), oxygen (E = 0.52 keV) and calcium (in this case there are two peaks for this element, the one with the highest intensity of 3.7 keV, and the lowest intensity peak with energy of 4.0 keV). As expected, the presence of high intensity peaks for carbon and oxygen, reveals the constitution of the largest component in paper, cellulose. However, it is not possible to observe any hydrogen peak (also constituent element of the cellulose), since the EDS technique does not allow to detect this element.
The existence of the characteristic peaks of calcium together with carbon peaks confirms the existence of CaCO3, which corresponds to the clusters observed in SEM
images. In addition, three other peaks corresponding to elements in residual amounts were detected: sodium (E = 1.04 keV), iridium (E = 1.52 keV) and chlorine (E = 2.62 keV). The presence of iridium is due to the fact that the conductive coating layer used in the analysed paper substrate was made with this element.
The EDS analysis also allows us to know the distribution of the different elements present in the sample, providing a distribution map obtained through thousands of scans of the electron beam in the area limited by the image. When the detectors signal the presence of a certain element, the software coupled to the equipment adds a white pixel in the zone corresponding to that detection. Figure 3.3 shows the distribution maps of the main constituents of the office paper.
Figure 3.2- EDS analysis of office paper. (A) SEM image, (B) Cumulative spectrum of EDS analysis of
14
Figure 3.3- EDS map of office paper. The images were artificially coloured in order to facilitate their analysis.
It can be seen from the distribution maps that the main constituents are carbon and oxygen. The calcium element is present in lesser amounts, but still in a considerable proportion. In this way, its distribution map is then in agreement with the presence of the crystalline agglomerates between the cellulose fibers of the office paper.
3.1.3 X-ray Diffraction
The structural analysis of the paper substrates considered was obtained through X-ray Diffraction. The diffractograms as well as the attribution of the identified crystalline structures are represented in Figure 3.4.
Figure 3.4- Whatman and office paper XRD patterns and crystalline structures identification.
The analysis of the diffractogram allows to verify that both paper substrates have the characteristic peaks of cellulose I. In the case of the Whatman paper diffractogram, two distinct diffraction peaks are observed at 14.92º and 16.46º, while in office paper it can be observed the fusion of these two peaks in only one, at 15.97º. This fusion is because
Whatman Paper Office Paper Calcite Cellulose I
15
office paper has residual amounts of various amorphous materials (such as lignin and hemicellulose) in its fibers. In addition to these peaks, these two substrates have yet another common peak, corresponding also to cellulose I, at 22.90º.
As mentioned above, all these peaks are characteristic of cellulose I which has a crystalline structure, and which can be further divided into two other structures, one monoclinic (Iβ cellulose) and another triclinic (Iα cellulose). The sample crystallinity (𝑥𝐶𝑅) is defined as the ratio of the amount of the monoclinic structure to the total amount of sample material. There are several methods for its calculation, one of them is defined as the Segal's empirical method (Equation 3.2), which relates the height of 200 peak (peak at 22.90º) and the minimum between the 200 and 110 peaks (peak at 18.00º). However, this method requires that the amorphous material diffracts with the same intensity at 18.00º and 22.90º, and that the crystalline cellulose does not contribute to the intensity at 18.00º. [46]
𝑥𝐶𝑅 =𝐼200−𝐼𝐴𝑀
𝐼200 (3.2)
𝐼200 represents both crystalline and amorphous material (peak at 22.90º), while 𝐼𝐴𝑀 represents only amorphous material (2θ= 18º). [46] It was found that the office paper has a lower crystallinity index (0.7796) than Whatman paper (0.8601).
It is also possible to identify another crystalline structure related to the diffractogram of office paper, which corresponds to calcite (CaCO3), as previously suggested by SEM and
EDS results. This crystalline structure has a rhombohedral geometry and is the main additive in the process of making office paper.
3.1.4 Fourier-Transform Infrared Spectroscopy
In order to confirm the presence of the chemical bonds identified by X-ray diffraction, it was used the Fourier-Transform Infrared Spectrocopy (FTIR) technique. The FTIR spectra obtained for the photocopying paper and Whatman paper are in the Figure 3.5 -
(A).
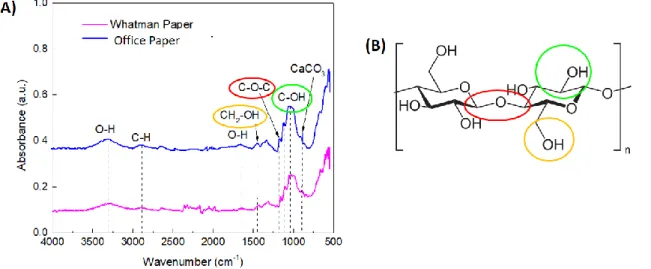
Figure 3.5- Chemical analysis of paper substrates considered. (A) FTIR-ATR spectra and identification of the
16
The range of the 1500-900 cm-1 spectrum corresponds to what is termed the fingerprint
region, the region where it is possible to identify the characteristic peaks of the cellulose. These are the peaks corresponding to the CH2-OH bonds of the 1433.83 cm-1 hydroxyl
groups (Figure 3.5 - (A) and (B) identified with the orange circle), COC at 1103.10 cm-1
(Figure 3.5 - (A ) and (B) identified with the red circle) and C-OH bonds at 1024.03 cm-1
(Figure 3.5 - (A) and (B) identified with the green circle). It is also possible to identify the peak at 2898.53 cm-1 which corresponds to the C-H bonds present also in the cellulose
and a peak at 1155.17 cm-1 which corresponds to the asymmetric ring breathing. [47] In
addition, the band at 3274.59 cm-1 and the peak at 1645.61 cm-1 are associated with the
O-H vibrations of the water molecules absorbed by the cellulose crystal structure.
In the case of office paper, a peak is recorded that is not present in the Whatman paper spectrum at 871.68 cm-1, associated with CaCO3 and correspond to the symmetric C-O
stretching mode. Again, it is possible to confirm the presence of this compound in this
type of substrate. Beyond this peak, CaCO3 produces a band at about 1420 cm-1
(correspond to the asymmetric C-O stretching mode) and another peak at 712 cm-1
(correspond to OCO bending). However, the characteristic cellulose peaks in this zone conceal these regions, preventing their identification. [47]
It is also verified that there is no peak in the region between 1750 and 1500 cm-1, which
suggests that characteristic components of this region (such as hemicellulose and lignin), are not found in these substrates. In addition, several peaks in the region between 2000 and 2500 cm-1 that can be notable, especially for Whatman paper. However, it is assumed
to be noise, probably due to poor sample preparation, since there is no reference for this region to any peak or band associated with cellulose.
3.2 Optimization of the colorimetric test
3.2.1 Synthesis of AuNPs in solution
AuNPs in solution were synthetized by direct reducing of HAuCl4 with TCs, without
mediator or seed NPs. This is due to the presence of reducing groups on the benzene ring of this antibiotics group. These reducing groups are phenolic-related groups that are oxidized to their respective quinones (oxidative product) by Au𝐶𝑙4− with H+ transfer and
AuNPs formation (reaction represented in Figure 3.6- (E)). However, this reaction only occurs at elevated temperature, due to the presence of mono phenolic group that showed to be a weaker reducer than that of the polyphenolic compounds. Furthermore, said synthesis is favoured in the presence of an alkaline medium. This occurs because under basic conditions the protons formed from the oxidation of the phenol group can be quickly neutralized by the buffer, favouring, in this way, the advance of the reaction. [29], [38]
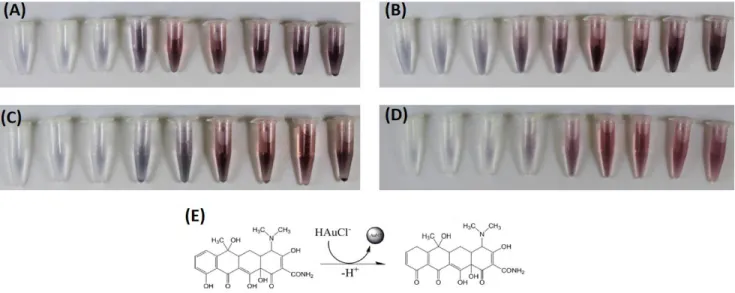
Different concentrations (0.1, 1, 2, 5, 10, 20, 30, 40 and 50 µg/mL) of 4 types of tetracyclines were tested. In Figure 3.6 it is possible to observe the colour changes in AuNPs solutions, for each type of this antibiotic family.
17
From the previous figure it is possible to verify that the colours obtained in the solutions with AuNPs are identical for all TCs, indicating that the four TCs have similar reduction activity and substitute group adjacent to the phenol group have little effect on the reaction.
It is also verified that for lower concentrations of the antibiotic (0.1, 1 and 2 μg/mL) the colour obtained is almost imperceptible, since the existing amount of the reducing agent is minimum as compared to the amount of HAuCl4. However, it is possible to observe a
blue/purple colour for low concentrations and a pink/red colour for higher concentrations. This colour difference is associated with the size of the AuNPs obtained, with the blue colour representing a larger diameter of NPs, and the red colour being associated with a smaller diameter of NPs.
3.2.1.1 UV-Vis Spectrophotometry
A UV-Vis spectrophotometry analysis was performed to compare the absorbance spectra of the different solutions for each tetracycline. Transparent 96-well polystyrene microplates with flat bottom were used and 200 μl of each solution to be analyzed was deposited in each well. The absorbance reading was performed in the visible region of the electromagnetic spectrum.
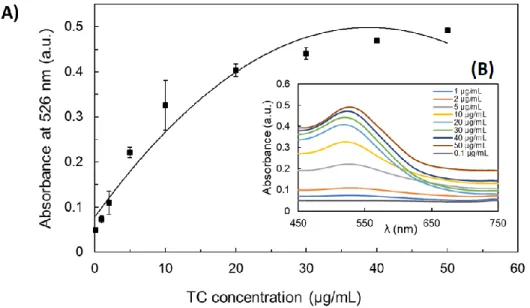
Figure 3.7 shows the evolution of the UV-Vis spectrum of AuNPs and the absorbance
changes at 526 nm in the presence of different concentrations of TC. The spectrums and trend curves at 526 nm corresponding to the remaining TCs are found in Appendix A and
B. Three replicates were performed for each of the different TCs concentrations tested.
In this way, the mean values and standard deviations were later calculated.
Figure 3.6- Colorimetric differences observed in solutions containing AuNPs synthesized from: A) TC, B) DC, C) OTC and D) CTC. E) Reaction mechanism between TC and HAuCl4, adapted from [31].
18
From Figure 3.7 – (B) it can be seen that the absorbance at 526 nm increases as the concentration of tetracycline increases too. In addition, from about 20 μg/mL, a shift of the SPR band to higher wavelengths is notable, evidently associated with the colour change of the solutions and, in turn, with the size of AuNPs.
In Figure 3.7 – (A) the trend curve corresponding to each absorbance point at 526 nm are shown for each concentration of TC under study. It is observable that the absorbance at 526 nm has been shown to have a linear relationship with TC concentrations up until about 10 μg/ml, being that from these concentration values, the curve stabilizes. This behaviour of increasing the absorbance to 526 nm as the concentration of antibiotics increases is called the hyperchromic effect.
3.2.2 Synthesis of AuNPs on paper and TCs quantitation
To guarantee a high signal amplitude, various concentrations of all reactants involved in the reaction were tested. Two types of paper (Whatman and office paper) were also tested, initially from the 96-well microplates. It should be noted that in the initial phase only optimization for tetracycline was carried out. In addition, the use of CTAC was discarded, since its goal is the nanoparticles stabilization in the long term, and the purpose of this sensor is a quick colorimetric analysis at the time of the appearance of the colour. This theory was later tested in an advanced stage of optimization (Appendix C).
In Figure 3.8 it is possible to observe the results obtained for three different concentrations of HAuCl4 and two concentrations of sodium tetraborate buffer, used for
nine different concentrations of TC (between 0.05 and 40 µg/mL) in the 96-well microplates in the Whatman and office papers. Columns 1, 2 and 3 represents the control (columns 1 represent only the addition of HAuCl4, columns 2 represent the addition of
HAuCl4 plus buffer and columns 3 represents the addition of HAuCl4 and TC). Note that
only the wells were filled until line F.
Figure 3.7- (A) Absorbance changes at 526 nm in the presence of different concentrations of TC. (B) UV–vis spectra of AuNPs upon addition of TC.
19
Figure 3.8- Synthesis of AuNPs on paper by reduction with TC, performed on a 96-well microplate on Whatman and
Office papers.
It is visible that it was not possible to obtain colour using the same concentrations of HAuCl4 and buffer used in the solution synthesis (line A), thus indicating that they were
not sufficient for the effectiveness of the paper reaction. Two more concentration were tested for HAuCl4 and one more for buffer. However, in none of the wells in both papers a
colorimetric reaction occurred, again indicating that the chosen concentrations were not sufficient.
The influence of well size was also studied to guarantee the highest sensitivity of the sensor. Thus, 384-well microplates were used, for both papers (Figure 3.9). In this case, 13 concentrations of TC were studied (between 0.05 and 100 µg/mL).
Figure 3.9- Synthesis of AuNPs on paper by reduction with TC, performed on a 384-well microplate on (A) Whatman
paper and (B) Office paper. (a) and (b) columns represents the control.
Analysing the previous figure, it is possible to observe, as before, that the concentrations of HAuCl4 and buffer used in the synthesis in solution, do not allow to
obtain colour in both papers. However, unlike 96-well microplates, a slight colour is observed for the remaining concentrations chosen. This is because the size of the wells is smaller in this type of microplate, causing the colour to become more concentrated. For this reason, preference was given to the optimization of the reaction for the 384-well microplates, thus discarding the use of the 96-well microplates.
It is also verified that the colour obtained is not red/pink as spectacle, but rather a medium-grey colour, possibly indicating an AuNPs aggregation. Curiously, it was found
20
that after about 24h, the colour in the wells changes to red, as can be seen in Appendix
D. This subject will be discussed in detail after observation of SEM images.
The use of office paper as a substrate for this sensor was discarded, since the colour obtained does not fill the well completely, which may make digital analysis difficult and may influence the achievement of non-uniform results. Furthermore, this paper has the disadvantage of being hydrophobic, which makes absorption of the delay solutions longer than would be desirable in a rapid colorimetric test.
As before, there is no colour appearance for control columns (columns (b) in Figure
3.9 represent only the addition of HAuCl4 and columns (a) represent the addition of HAuCl4
plus buffer).
To ensure the appearance of colour for lower TCs concentrations, the concentration of HAuCl4 was further increased up to 34 mM, for 384-well microplate (Figure 3.10). The
concentration of the buffer was not possible to increase because from 0.15 M the saturation of its solution was reached, and it was not possible to achieve a uniformity of results. The colour of the microplates was modified to a greenish colour to help on the colour visualization by naked eye and guarantee a greater enhancement.
The influence of the volume of solution placed on the wells of the 384-well microplates (Appendix E) was also studied, and it was concluded that the volume of solutions that allowed a higher colour intensity was 3 μL.
Figure 3.10- Synthesis of AuNPs on Whatman paper by reduction with TC, performed on a 384-well microplate and
with deposition of all reagents with a volume of 3 µl. Columns 1 and 2 represent the control.
As for the concentration of HAuCl4, it is found that at 3 mM, for whatever buffer
concentration, the colour obtained is always similar, with no increase in colour intensity as the TC concentration increases (lines B, F and J). However, the increase in HAuCl4
concentration corresponds to the increase in colour intensity of the wells. In addition, it is apparent that with increasing HAuCl4 concentration, the wells with lower TC concentration
are less filled, indicating that there is not enough TC to reduce the existing amount of HAuCl4. In relation to the buffer concentration, the increase of the colour intensity in the
21
formation (formation of a ring with more intense staining next to the wax barriers), which is an advantage since the formation of this effect harms the correct reading of the intensity of the RGB channels.
To identify more accurately the colour differences occurring as a function of the TC concentration used in the reaction, a digital analysis of the colorimetric results was performed using the ImageJ analysis software. The RGB (Red Green Blue) channel intensities were measured for each 384-well microplate test zone. In order to evaluate the intensity of the colour obtained, the arithmetic mean of the three channels was calculated for each test zone. [45] In this way, it is possible to quantify the concentration of the antibiotic to later relate it with the intensity of the colour, in a calibration curve. It is important to mention that the relative intensities of each channel vary between 0 and 255, with 0 corresponding to black and 255 to white. [48], [49]
Three concentrations of HAuCl4 (12, 24 and 34 mM) and two of sodium tetraborate
buffer (0.1 and 0.125 M) were used, combined in six different ways, with eight replicates being performed for each combination. This study was performed only for tetracycline . The outliers (values that have a significant distance from the rest of the series to which they belong) were later eliminated in order to reduce the error associated with the measurements. For this purpose, a t-distribution-based method was used, whereby all values that are at a distance from the mean are considered to be greater than 1 standard deviation. In addition, since the number of repetitions is less than 30, this model is the most appropriate to use. [50]
In Figure 3.11 are represented the trend curves, which relates the average of the three channels with TC concentration. The colorimetric results were obtained for a concentration of sodium tetraborate buffer of 0.125 M, with the different concentrations of HAuCl4 tested. The results corresponding to the RGB analysis performed for each of the
combinations tested are presented in Appendix F.
Figure 3.11- RGB analysis of the colorimetric results obtained in the test zones of the microplate of paper of 384
wells. The results presented correspond to a Buffer concen tration of 0.125 M with four different concentrations of HAuCl4.
![Table 1.1- Structures of the tetracycline antibiotics studied in this work. Adapted from [30]](https://thumb-eu.123doks.com/thumbv2/123dok_br/15492197.1042145/30.918.108.803.135.511/table-structures-tetracycline-antibiotics-studied-work-adapted.webp)