MERGERS & ACQUISITIONS:
LUXURY SECTOR
CASE OF A MERGER BETWEEN LVMH AND HERMÈS
Inês Alexandra Mira
Advisor: Peter Tsvetkov
December 2014
Dissertation submitted in partial fulfillment of requirements for the degree of MSc in Business
Administration, at the Universidade Católica Portuguesa, date 2014.A case of a merger between LVMH and Hermès Page 2 | 75 ABSTRACT
The strong competitive environment that nowadays characterizes the Luxury Goods market has led companies to look for new alternatives of value creation. In this sense, Mergers and Acquisitions are found to be an alternative to increase shareholders wealth, since they allow companies to create value. The reasoning behind this deal lies on the cost synergies and efficiency that can arise from the combination of LVMH and Hermès.
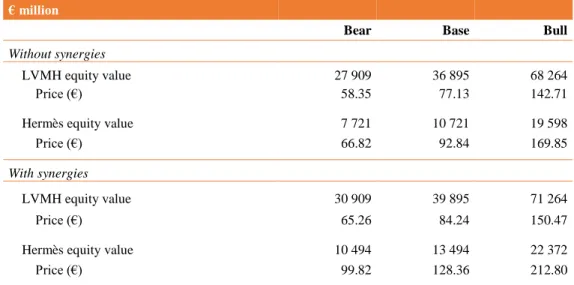
This dissertation focus on the analysis of a possible acquisition involving the two companies mentioned above. The synergies value is found to be € 5 773 million, which results in an equity value for the merged entity of € 53 215 million. As a result, an offer price of € 13 494 million is determined, from which € 5 398 will be paid in cash and € 8 097 with shares issue, resulting in a premium over the market cap of 36.99%.
A case of a merger between LVMH and Hermès Page 3 | 75 TABLE OF CONTENTS 1. Acknowledgments ... 6 2. Introduction ... 7 3. Literature review ... 8 3.1. Valuation approaches ... 8
3.1.1. Weighted average cost of capital... 10
3.1.2. Capital asset pricing model ... 10
3.1.3. Discounted cash-flows approach ... 12
3.1.4. Relative valuation (multiples) ... 16
3.2. M&A related issues ... 17
3.2.1. M&A procedure ... 18
3.2.2. M&A classification ... 18
3.2.3. Motivations for M&A ... 19
3.2.4. Value creation - synergies ... 20
3.2.5. Payment methods ... 20
3.2.6. Mergers and acquisitions premium ... 21
3.2.7. Post-deal returns ... 21
3.3. Conclusion on M&A ... 21
4. Industry and company analysis ... 22
4.1. Overview of the luxury market ... 22
4.2. Company overview –LVMH ... 23
4.2.1. History ... 23
4.2.2. Products offering ... 24
4.2.3. Financial analysis ... 26
4.3. Company overview – Hermès ... 27
4.3.1. History ... 27
4.3.2. Products offering ... 27
4.3.3. Financial analysis ... 29
5. Forecast assumptions ... 30
5.1. Inflation ... 31
5.2. Cost of financial distress ... 31
5.3. LVMH assumptions ... 31
A case of a merger between LVMH and Hermès Page 4 | 75
5.3.2. Operating margin ... 34
5.3.3. Net working capital ... 35
5.3.4. Capital expenditures ... 36
5.3.5. Depreciation ... 36
5.3.6. Debt and financial expenses ... 37
5.3.7. Income tax expenses ... 37
5.3.8. Cash and equivalents and dividends payout ... 37
5.4. Hermès assumptions ... 37
5.4.1. Revenue ... 38
5.4.2. Operating margin ... 40
5.4.3. Net working capital ... 40
5.4.4. Capital expenditures ... 40
5.4.5. Depreciation ... 40
5.4.6. Debt and financial expenses ... 41
5.4.7. Income tax expenses ... 41
5.4.8. Cash and equivalents and dividends payout ... 41
6. Standalone valuation ... 41
6.1. LVMH ... 42
6.1.1. Free cash flow to the firm (FCFF)... 42
6.1.2. Adjusted present value (APV) ... 43
6.1.3. Sensitivity analysis – LVMH ... 43
6.2. Hermès ... 44
6.2.1. Free cash flow to the firm (FCFF)... 44
6.2.2. Adjusted present value (APV) ... 44
6.2.3. Sensitivity analysis – Hermès... 44
6.3. Relative valuation of LVMH and Hermès ... 45
7. Valuation of merged entity ... 46
7.1. Valuation of merged entity without synergies ... 46
7.2. Valuation of merged entity with synergies ... 47
7.2.1. Operating synergies ... 47
7.2.2. Financial synergies ... 50
7.2.3. Integration costs ... 50
A case of a merger between LVMH and Hermès Page 5 | 75
8. The transaction ... 52
8.1. Approaching shareholders ... 52
8.2. Distribution of synergies benefits ... 53
8.3. Method of payment ... 53
9. Conclusion ... 55
10. Appendices ... 56
A case of a merger between LVMH and Hermès Page 6 | 75
1. ACKNOWLEDGMENTS
I would like to express my sincere gratitude to my thesis adviser, Professor Peter Tsvetkov, for the constant support through this process, for being available and giving continuous feedback. I would like also to thank my family and friends for their constant encouragement and understanding. Specially, I would like to thank João Vasconcelos e João Castro, for helping me during the summer and with who I shared useful ideas. To all, thank you for helping me keep focused and confident in order to complete this dissertation.
A case of a merger between LVMH and Hermès Page 7 | 75
2. INTRODUCTION
Conventional business understanding suggests low prices stimulate demand, business size increases competitiveness, and consumers shop for functional use. However, in the luxury market these and many more conventions are turned upside down, since demand can increase with price, a brand’s diffusion has a negative impact on its desirability, and consumers make extraordinary efforts to purchase products that usually do no exceed the functional performance of considerably less expensive and more reasonable alternatives. In this scenario, Groups such as LVMH and Hermès are trying to pursuit their business goals.
I this sense, the objective of this dissertation is to analyse the merger of two companies and present reasonable reasons for their consolidation. The thesis focuses on a possible merger between the two companies mentioned before, arriving at final valuation values and other relevant findings.
This study is divided in the following sections: literature review, industry and companies’ overview, standalone and merged entity’s valuation, and transaction and conclusions of the proposed merger. In the literature review section, it will be provided an analysis of the existing academic literature regarding valuation approaches. Also, for a better understanding, this section will focus, as well, on M&A related issues, such as type of acquisition and method of payment.
In the industry and companies’ analysis section will assess their performance based on present and past information. More specifically, each company will be analysed in the different segment where it operates.
In the standalone and merged entity’s valuation, the expectations about LVMH and Hermès are translated into numbers. To do this, some assumption will be made and some valuation models will be developed. In this sense, this section will define exactly the areas where future benefits are expected to arise.
Finally, after consolidation benefits are defined, it will be possible to design a possible transaction path and detailed acquisition offer. Therefore, the last section focuses in the final conclusion about the potential acquisition of LVMH to Hermès.
A case of a merger between LVMH and Hermès Page 8 | 75
3. LITERATURE REVIEW
“Companies grow in two main ways: either organically or by merging with or acquiring other companies.” (Barbara Petitt and Kenneth Ferris, 2013)
How much is a company worth? What are the ratios used by analysts to determine whether a stock is undervalued or overvalued? How valid is the discounted present value approach? How can one value a company as a going concern, and how does this change in the context of a potential acquisition, or when the company faces financial stress?
Finding a value for a company is not an easy task, but doing it is an essential component of effective management because it's simple to destroy value with ill-judged acquisitions, investments or financing methods.
According to Alfred Rappaport (2006), companies typically create most of their value through day-to-day operations, but a major acquisition can create or destroy value faster than any other corporate activity. With record levels of cash and relatively low debt levels, companies increasingly use mergers and acquisitions to improve their competitive positions: M&A announcements worldwide exceeded $2.7 trillion in 2005. The reasoning behind these strategies is that the two firms combined may be more valuable than the sum of their individual values due to new business opportunities. However, the benefits from M&A are not consensual, as according to Damodaran (2005), the results could be improved considering the fact that firms have not been able to absorb completely the benefits associated with M&A.
Also, the additional value generated by combining two firms - creating opportunities that would not have been available to these firms operating independently - is called synergy and can be difficult to measure accurately. Nonetheless, it’s considered that this value should be the difference between the value of the two combined companies and the sum of the value of each firm independently, as if optimally managed.
To ensure a good explanation about M&A valuations, this literature review is divided in two sections: valuation approaches and M&A related issues.
3.1. VALUATION APPROACHES
“There are those who are disingenuous enough to argue that value is in the eye of the beholder, and that any price can be justified if there are other investors willing to pay that price. Perceptions need to
A case of a merger between LVMH and Hermès Page 9 | 75 be backed up by reality, which implies that the paid for any asset should reflect the cash flows it is expected to generate.” (Damodaran, 2002)
Understanding a firm valuation mechanism is essential for anyone involved in corporate finance sector, not only because of its importance in the allocation of resources and strategies, but also because it helps to identify sources of economic value creation and destruction within the company.
Nowadays, there is a huge variety of valuation frameworks and therefore is necessary to establish some criteria to select them. However, according to Young, et al. (1999), “most valuation approaches are equal under certain assumptions”. If the same information is used in all procedures, the expected results for the company value shall be the same.
According to Fernández (2007), the methods of valuing a company can be classified in six groups:
MAIN VALUATION METHODS
BALANCE SHEET INCOME STATEMENT MIXED (GOODWILL) CASH FLOW DISCOUNTING VALUE CREATION OPTIONS Book value Adjusted Book value Liquidation value Substantial value Multiples PER Sales P/EBITDA Other multiples Classic Union of European Accounting Experts Abbreviated income Others
Equity cash flow Dividends Free cash flow Capital cash flow
Adjusted Present value EVA Economic profit Cash value added CFROI
Black and Scholes Investment option Expand the project Delay the investment
Alternative use
Due to the business nature of the companies considered in this thesis, the Discounted Cash Flows (DCF) methodology will allow to determine the individual and joint values of both companies. Following this line of thought, the Free Cash Flows to the Firm (FCFF) and the Adjusted Present Value (APV) will be used. According to Damodaran (2010), the first provides an estimation of value from an operational point of view, while the second allows distinguishing the contribution of the side effects and financing options. These are the most used techniques, estimating the company’s value as a cash flow generator by discounting to the present the estimated future cash flows at the appropriate discount rate. Nowadays, it is considered the only conceptually correct valuation method and therefore the most used.
Additionally, in order to provide a market perspective, a relative valuation will be performed. In this way, the income statement-based method aims to determine the company’s value through the size of its earnings, sales or other indicators.
A case of a merger between LVMH and Hermès Page 10 | 75 3.1.1. WEIGHTED AVERAGE COST OF CAPITAL
In order to discount the future free cash flows, the weighted average cost of capital (WACC) needs to be estimated. According to Wessels et al. (2010), the WACC blends the rates of return required by the debt holders (Kd) and equity holders (Ke). For a company financed solely with debt and equity, the WACC is defined as the follow:
WACC = D
D + EKd(1 − T) + E D + EKe
where debt (D) and equity (E) are measured using market values. The cost of debt is reduced by the marginal tax rate (T) since the interest tax shield (ITS) has been excluded from free cash flow. Although, since the interest tax shield has value it must be incorporated in the valuation and, therefore, the DCF values the tax shield by reducing the weighted average cost of capital.
The equation above shows three critical components of the WACC: the cost of equity, the after-tax cost of debt, and the target capital structure. To estimate the cost of equity the most used methodology is the Capital Asset Pricing model, requiring the access to some historical data related to the risk-free rate, market risk premium and beta parameters. In order to determine the after-tax cost of debt, the expected return obtained through the yield to maturity on long term debt will be used and it also requires the access to the risk free rate, default spread and marginal tax rate. The capital structure is the proportion of debt and equity to enterprise value.
The problem with using the WACC to discount future cash flows is that, implicitly, it assumes a constant capital structure at a target ratio of debt to equity. Any change to the capital structure will make the current WACC understate/overstate the expected tax shield. Ultimately, the WACC formula could be adjusted every period to make up for changes in capital structure or, in alternative the use of the Adjusted Present Value would be better.
3.1.2. CAPITAL ASSET PRICING MODEL
The most common model used to estimate the cost of equity is the CAPM. This model was introduced by Sharpe (1964) and Lintner (1965) and adjusts to the company-specific risk through the use of beta, which measures a stock’s co-movement with the market and represents the extent to which a stock may diversify the investor’s portfolio.
A case of a merger between LVMH and Hermès Page 11 | 75 This model has been recently criticized, but according to Wessels et al. (2010), CAPM remains the best model for estimating the cost of equity if the WACC can be developed to be used in the company valuation.
The model can be summarized in the following formula:
E(Ri) = rf+ βi [E(Rm) − rf]
where E(Ri) is the expected return of security i, rf is the risk-free rate, βi is the stock’s sensitivity to
the market and E(Rm) is the expected return of the market. The risk-free rate and the market risk
premium will be common to all companies, only the beta parameters will vary across entities. 3.1.2.1. RISK-FREE RATE, RF
According to Oded, J. (2007), the first element of the CAPM model is the expected return on investment without default risk – risk-free rate, meaning β equal to zero. However, Copeland et al. (1996) conclude that the application of the long-term Treasury bond yield, in terms of maturity, for the calculation of the risk-free rate in the cost of capital computation, allows a more reliable and correct valuation on which risk-free rate is less dependent on inflation.
Nonetheless, since financial crisis (2007), the market started to distinguish creditworthiness across countries. Hence, the usual German bonds for the Euro market should be replaced by bonds issued by a company’s home country.
3.1.2.2. MARKET RISK PREMIUM
Mayfield (2004) defines the market risk premium as one of the most important numbers in finance. However, estimating and understanding its value has proven to be difficult. Merton (1980) suggests estimating the risk premium based on the theoretical relationship between expected returns and the contemporaneous variance of returns. Yet, according to Goetzmann et al. (2005), the most popular approach to compute the value of market risk premium is inferring it from past market returns relative to riskless investments.
The markets returns are usually obtained from the most representative equity markets and according to Damodaran (2002), a good index is the one which includes the highest number of securities, assuming they are market weighted. However, an index will never be completely accurate since investments, like bonds or real estate, are part of the market portfolio, though they are not included in equity market
A case of a merger between LVMH and Hermès Page 12 | 75 indices. According to Fama & French (1996), the miscalculation of market portfolio can be one reason for the empirical failures of CAPM. Also, CAPM assumes that investors may borrow or lend any amount of money at the riskless rate. Black (1972), states that this assumption is not a very good approximation for many investors and this would significantly change the model, which should be relaxed.
In alternative to CAPM there are two other models: Arbitrage Pricing Model (APM), which considers that the return on an asset is totally incorporated in a set of factors and a random noise; and Fama & French (1992) Three Factor Model, which develops a regression of a stock’s excess return of high over low book to market stocks.
3.1.2.3. BETA, β
As mentioned before, the beta coefficients will differ across stocks since it measures the exposure to the systematic risk of each stock (non-diversifiable risk). The higher the beta value, the more it amplifies market shocks. According to Damodaran (2002), the beta can be roughly estimated by the regression of an asset’s historical returns against a representative equity market index, for a period of at least three years. To avoid miscalculation, one should look at the betas for similar companies in the same industry. When doing the calculations, the capital structure of each company should also be taken into account, in order to incorporate the leverage effect. Therefore, according with Damodaran (1994), the leverage beta is always higher than the unlevered one because payments of interest to debtholders increases the variability of shareholders return. One can determine the levered beta through the following relation:
βL = βU[1 +
D
E× (1 − T)]
However, Rosenberg and Rudd (1982) stated that the calculation of beta based on historical returns makes the beta value unstable. As a solution, Copeland et al. (2000) suggests a more forward-looking approach, using published estimates of the unlevered beta for the industry.
3.1.3. DISCOUNTED CASH-FLOWS APPROACH
A valuation based on discounted cash flows starts by estimating the value of nominal and real future cash flows. This task carries some difficulties and may lead to several mistakes due the growth rates, returns on invested capital and growth periods expectations.
A case of a merger between LVMH and Hermès Page 13 | 75 In many cases, as Damodaran (2002) shows, for purposes of simplicity, the cash-flows are forecasted for a limited period of time and expected to grow at a constant nominal rate in perpetuity. As a result, all cash flows need to be discounted at a specific rate which will catch the riskiness of those streams. In the next subsections some of the parameters that are necessary to complete the valuation will be explored.
3.1.3.1. FREE CASH FLOW TO THE FIRM (FCFF)
“The most commonly-used DCF approach, is the one on which the value of a leveraged firm can be calculated by discounting the unleveraged cash flows at the firm weighted average cost of capital” (Kaplan & Ruback, 1996). Thus, the enterprise value is estimated according to the following formula:
Enterprise value = ∑ FCFFi (1 + WACC)i+ FCFFn+1/(WACC − TGR) (1 + WACC)n n i=1
This formula can be decomposed into two stages: the first represents the present value of cash-flows up to a predetermined horizon date (n), generally until a company enters into a stable growth rate; the second comprises the present value of future cash-flows beyond the horizon date and is usually referred as terminal value (TGR - terminal value growth rate) (Ohlson &Zhang, 1999).
According to Damodaran (2005), the FCFF is the amount of cash earned by a company after paying all operating expenses, taxes and reinvestment needs, but before paying any interest or dividends to debt holders or equity holders. Therefore can be summarized as:
FCFF= EBIT (1-T) + Depreciation - CAPEX - ∆ NWC ± Other Non-cash items
These cash-flows should be discounted to the present using the corresponding WACC, which is the discount rate that adjusts for the tax effect. The next subsection will analyse the second stage on enterprise value’s formula - the terminal value.
3.1.3.2. TERMINAL VALUE
Damodaran (2002) states that firms “do not last forever” and it is necessary to establish a moment in the future to estimate its liquidation value. Similarly, Luehrman (1997) considers that after computing operating cash-flows, it is required to add the present value of cash flows beyond the horizon date. Following the perpetuity growth method, the terminal value can be computed as:
A case of a merger between LVMH and Hermès Page 14 | 75 TV = FCFFn+1
WACC − g Alternatively, using a multiples approach,
TV = EBITDAn x Exit Multiples
where a frequently used terminal multiple is Enterprise Value/EBITDA or EV/EBITDA.
Since firm’s operations are assumed to continue indefinitely, it can be implicitly assumed that future operations will grow at a given rate. The terminal value is, typically, the main component of firm’s value and is very sensitive to changes either in the discount rate or in the terminal growth rate (TGR). 3.1.3.3. EXPECTED GROWTH RATE
Although, usually companies start operations with high growth rates, these tend to gradually stabilize. Damodaran (2008) defines the growth rate as the product of the after-tax return on invested capital (ROIC) multiplied by the reinvestment rate (RR).
g = RR × ROIC Where,
ROIC = NOPLAT
Invested Capital
This stable growth rate cannot exceed the growth rate of the economy but it can be set lower. A common approach is to calculate the TGR at a constant rate equal to the expected real or nominal growth rate of the GDP of the economy, depending in whether the inflation was considered or not in the cash flows. According to Damodaran (2002), another simple proxy for the nominal growth rate of the economy is the risk-free rate. In addition, Kaplan and Ruback (1996) suggest that in a stable stage the analyst shall consider capital expenditures equal to depreciation.
3.1.3.4. ADJUSTED PRESENT VALUE (APV)
Luehrman (1997) defends that APV approach, besides being less susceptible to valuation errors than the traditional WACC, it also computes how much a firm asset is worth and where the value comes from.
The Adjusted Present Value method defines the company’s value as the addition of three different values: the value of the company assuming that the company has no debt, the value of the tax shield
A case of a merger between LVMH and Hermès Page 15 | 75 obtained by the fact that the company is financed with debt and the value of other costs, such as distress costs.
Regarding this subject, Damodaran (2005) explains that, the value of the company without debt is obtained by discounting the FCFF using the rate of required return to equity, which would be applicable to the company if it was to be considered as having no debt - unlevered rate or required return to assets. This rate of return will be lower than the required return to equity if the company has debt since, in this case, the equity holders would bear the financial risk implied by the existence of debt and would demand a higher equity risk premium.
Value of Unlevered Entreprise (VU) = ∑
FCFFi (1 + RU)i +FCFFn+1/(RU− TGR) (1 + RU)n n i=1
The present value of the tax shield arises from the fact that the company is being financed with debt and it is the specific result of the lower tax paid, as a consequence of the interest paid on the debt in each period.
Present Value of Tax Shields (PVTS) = ∑Di× RD× TC (1 + RD)i
+Di× RD× TC/(RD− g) (1 + RD)n n
i=1
According to Luehrman (1997), in the long-run, it is assumed that indebtedness grows at the same pace as the company, making the perpetual tax shield growth (g) equal to growth in operations (TGR). Thirdly, the cost of financial distress should be considered as the present value of loss in a firm’s value in case of distress. This can be computed by multiplying, in each period, the value of the unlevered firm by the percentage of loss that varies across industries (Damodaran, 2002).
Cost of Financial Distress (CFD) = ∑ %CFDi× Vui [1 + RD+ P(D)]i n
i=1
Thereby, as Myers (1974) claimed, the final step is to put everything together to get the APV value: Firm Value = Vu+ [1 − P(D)] × PVTS − [P(D) × CFD]
Since the PVTS only exists when the firm is operating, this component must be multiplied by the probability of no distress and the CFD must be multiplied by the probability of bankruptcy.
A case of a merger between LVMH and Hermès Page 16 | 75 Although APV model provides more information than WACC, the criteria to choose between the two models depends on the nature of firm’s capital structure.
3.1.4. RELATIVE VALUATION (MULTIPLES)
Multiples approaches assume that a company will be worth some multiple of future earnings or book value in the continuing period. Several empirical studies have shown that multiple-based valuation can give similar accuracy to DCF valuation. Kaplan and Ruback (1995) show, for a sample of highly leveraged transactions, that valuation using EBITDA multiples is as accurate as DCF. Other developments have also demonstrated that there is a strong theoretical basis for using multiples (Feltham and Ohlson, 1995).
Although, according to Goedhart et al. (2005) the multiples are considered the simplest valuation method and there are two important decisions: (i) the definition of a peer group and (ii) the definition of the right multiples.
Following the same thought as Kaplan (1996), it can be considered that the relative valuation method relies on two main assumptions: (i) the comparable companies are assumed to have an expected future cash flow that grows at the same rate and have the same level of risk as those firms being valued and (ii) the value of the firm is assumed to vary proportionally to the changes in the variables being measured.
Damodaran (2002) states that any company with similar cash flows, growth, leverage and risk rates can be used as a comparable firm. Still, Lie & Lie (2002) argue that, in general, such similarity can be found only in the same industry.
There are three main principles in the multiples approach, which are considered by Goedhart et al. (2005): (i) use peers with similar prospects for ROIC and growth; (ii) use forward looking multiples based on latest information or forecasted indicators; and (iii) use enterprise value multiples adjusted for non-operating items.
Some examples of frequently used multiples are (Krishnamurti & Vishwanath, 2008):
The price-to-earnings (P/E) multiple = stock price per share
earning per share ;
The price-to-sales (P/S) multiple = stock price per share
sales per share ;
The price-to-book (P/BV) multiple = market price per share
A case of a merger between LVMH and Hermès Page 17 | 75
The enterprise value-to-EBITDA (EV/EBITDA) multiple =
= Enterprise valueEBITDA = Market value Equity+Book value Debt
EBITDA .
The first three are equity multiples, whereas the fourth is a value multiple. In general, according with Imam et al. (2008), multiples are only of importance when they are based on either earnings or cash flows.
Also, Damodaran (2006) describes several reasons why multiples could be preferred over discounted cash flow models, including (i) the fact that using the multiples method costs less time and resources compared to the use of standard DCF, which requires more information, assumptions and, consequently, it is more time consuming; (ii) the outcomes of the multiples method are easier to defend compared to the outcomes of a DCF model; (iii) the multiples method reflects better the mood of the market since the valuation is based on comparable assets, whereas DCF models try to capture the intrinsic value of an asset; and (iv) since the outcomes of the multiples method are easier to explain, compared to the relatively complicated outcomes of DCF models, it is also easier to sell stocks to investors and portfolio managers based on this number, .
Nevertheless, according to Kaplan and Ruback (1996), it is not worth using this method alone since the results obtained are dispersed, but it is helpful to use it to make comparisons with the market. Also, multiples are even more accurate in the valuation of large companies (Alford, 1992). Taking all the facts into consideration, valuation by multiples is very useful to complement the DCF approach. 3.2. M&A RELATED ISSUES
Mergers and acquisitions come in “waves.” Martynova and Renneboog (2008) reviewed a century of transactions and identified six major waves of M&As: 1890–1903, 1910–1929, 1950–1973, 1981– 1989, 1993–2001, and 2003–2007. Their study shows that the end of a wave typically coincides with a crisis or a recession. What triggers the start of a wave varies across time, but three factors have constantly motivated M&A activity: industrial and technological shocks, regulatory changes, and credit availability.
What do Daimler-Benz, Hewlett-Packard (HP), Microsoft, Quaker Oats, and Sprint have in common? They are all multinational companies with well established brands and products. But they have something else in common: they have all made bad acquisitions!
A case of a merger between LVMH and Hermès Page 18 | 75 Acquisitions fail for different reasons, but a recurrent one is overpay. The acquirers overestimate either the target’s value or the expected synergies associated with the acquisition, or both. When the benefits of the acquisition fail to materialize, an acquirer has to write off part, and sometimes all, of the purchase price (Ferris, 2013).
However, not all mergers and acquisitions are bound to fail. Some of the strongest companies result from large M&As, the combinations of Exxon and Mobil in 1998, Vodafone and Mannesmann in 1999, and Pfizer and Warner Lambert in 1999, created leaders in the oil and gas, telecommunication and pharmaceutical industries, respectively. Acquisitions that are well planned and well executed offer companies the opportunity to grow successfully.
3.2.1. M&A PROCEDURE
In order to start up a M&A deal, some steps must be taken carefully before getting to a final agreement that guarantees a good result for both parties.
Wang et al. (2005) recognizes that a successful merger or acquisition should well handle M&A process management, confidential target selection, negotiation assistance, preparation and administration of complete diligence, between other steps. In practice, the M&A process can be split into five major steps: (i) perform a pre-acquisition review, (ii) search and screen the target, (iii) investigate and value the target, (iv) acquire the target through negotiation, and (v) perform post-merger integration.
3.2.2. M&A CLASSIFICATION
M&A deals can be categorized differently. As Ross et al. (2003) state, there are two different perspectives for classifying M&A deals – legal or financial.
Focusing on the legal procedures classification there are three different deals to be considered: merger or consolidation; acquisition of stock and acquisition of assets.
In the case of a merger, the buyer absorbs the target company through the purchase of all the assets and liabilities whereas in a consolidation, a new legal entity is created combining both companies. In these two types of deal, the involved companies’ stockholders have to approve it.
On the other hand, acquisition of stock allows the acquirer to place an offer for the target’s stocks. Generally, this operation is accomplished through a tender offer – buying publicly the target’s shares. There is no need for a general meeting for a previous approval by the company’s shareholders, since
A case of a merger between LVMH and Hermès Page 19 | 75 the buyer deals directly them. Nevertheless, it can be difficult to buy the entire company since each shareholder can decide whether to sell or not his shares.
In an acquisition of assets the bidding company buys all the assets from the target. However, it requires a formal approval from the shareholders and can be costly, since those assets need to be transferred to the new owners.
Given the typical financial analysts’ classification, the deals can be characterized as (i) horizontal acquisition – both the bidding and the target companies are competitors from the same industry; (ii) vertical acquisition – a deal in which one firm acquires a supplier or another firm closer to the existing customers and therefore, it is a deal between firms that are from a different stage in the production process; or (iii) conglomerate acquisition – the companies involved in the deal are not related at all, belonging to different industries.
3.2.3. MOTIVATIONS FOR M&A
Companies make acquisitions for a long list of reasons. Some of these reasons may be good, but unfortunately, others are bad or at least questionable. In line with the CFA Institute studies, there are three motives why a merger or acquisition occurs.
The first motive for a M&A deal isthe creation of value that can arise from synergies, which imply that the value of the combined companies is greater than the sum of their individual values, being able to invest in the external growth, increase market power and acquiring unique capabilities or resources. The second motive concerns cross-border deals that can exploit market imperfections, such as cheap labour and low-cost raw materials. It allows to overcome adverse government policies (tariffs and barriers to trade), consents the access to new technology or resources, supports product differentiation and “buys” reputation for entry into a market and permits to follow clients.
Lastly, there are also dubious motives like diversification - investors can diversify their own portfolios, so there is generally no value to companies to diversify; bootstrapping earning – occurs if the acquirer’s shares trade at a higher P/E than the targets; managers’ personal incentives, such as compensations and decrease in their personal employment risk; and tax considerations.
A case of a merger between LVMH and Hermès Page 20 | 75 3.2.4. VALUE CREATION - SYNERGIES
According to Petitt (2013), companies should pursue an acquisition only if it creates value, meaning that the value of the acquirer and the target should be greater if they operate as a single entity than as separate ones. In another way, a merger or acquisition is justified if there are synergies associated with the transaction. These synergies can arise in different ways and can be classified as operating, financial or managerial synergies.
Operating synergies are originated from the combination of the acquirer and target’s operations, such as revenue enhancement, which includes gaining pricing power, increase sales volume and cost reduction. From the size increase, firms are able to benefit from economies of scale with lower production costs.
Financial synergies result from lower financing costs. Big enterprises usually have access to a wider and cheaper pool of funds than small companies. Diversifying into unrelated business allows companies to reduce risk and, therefore, increase their debt capacity and lower their before tax cost of financing.
On the other hand, managerial synergies emerge when a high-performing management team replaces a poor-performing one. The acquirer gives the opportunity to remove incompetent managers, which could improve the target’s performance.
3.2.5. PAYMENT METHODS
According to Zenner et al. (2008), M&As deals can be financed with cash, stock, a mix of both, or even through a payout depending on the target assets future performance – earnout contract. The later delivers a greater performance incentive for the seller and a risk management device for the buyer (Bruner, 2004).
Hazelkorn et al. (2004) state that an equity-financed deal tends to signal overpriced stocks. Also, if the transaction is paid through exchange of stocks, the target company’s shareholders will, not only capture the risk of the deal, but also, the potential synergies. If the management is certain about the future gains, there is no incentive to share it with other shareholders. Moreover, Martin (1996) explored the motives behind the choices of payment methods and concluded that stock payments are more likely if the target firm presents more growth opportunities. Conversely, a cash offer sends positive signals to the market, since it represents the acquirer's confidence in re-establishing the cash balance, as well as confining all the potential gains from the transaction to the existing shareholders.
A case of a merger between LVMH and Hermès Page 21 | 75 In theory, the choice between cash and stock must take into account the availability of cash in hand, the perceived value of stock and the tax implications (Damodaran, 2002). Furthermore, Martynova and Renneboog (2009) consider the acquirer’s financing decision as a result of the cost of capital and therefore, the company will seek the cheapest way of financing and structuring the method of payment.
3.2.6. MERGERS AND ACQUISITIONS PREMIUM
According to Ferris and Pettit (2013), the premium in M&A deals is defined as the difference between the offer price and the market price of the target, before the announcement of the transaction. Empirical evidence suggests that M&A premiums average 20 to 30 percent above the target’s pre-acquisition share price. As an example, Kengelbach and Roos (2001) found that, from 1990 to 2010, the average premium was 36 percent. A high premium may mean an overpayment and, consequently a reduction in the likelihood of making the acquisition a success.
3.2.7. POST-DEAL RETURNS
According to Damodaran’s (2005), the “synergy share” depends on the effort and skills disbursed by the target and acquirer for the existence of the synergy. Nonetheless, Sirower and Sahni (2006) research suggest that target shareholders are the obvious winners in the short-run and their Relative Total Shareholder Return (RTSR) has been, on average, 20%. Furthermore, they found that a cash-financed transaction tends to outperform, and subsequently provides larger benefits than stock-cash-financed deals.
However, Loughran and Vijh (1997) state that in the long-term, approximately 5 years, the results are different. Target shareholders that accept stock offers have low or even negative abnormal returns, when the relative size of the target acquirer is high. On the other hand, tender offers, usually cash-financed, have positive excess returns, despite acquirers earn little or nothing from them.
3.3. CONCLUSION ON M&A
Without disregarding all previous research, M&A subject has still some unclear results. Authors such as Burner (2004) argue that researches have been made based on results before and after M&A deals, whereas the comparison of the current situation with a hypothetical one, where M&A has not occurred, would be more relevant. Indeed, definitive conclusions cannot be made based only on statistical results, since they may not be reliable driven by the fact that all situations are different from each other’s. Nevertheless, M&A deals create value for the economy as a whole since the large percentage gains of sellers offset the small percentage losses of acquirers (Sirower and Sahni, 2006).
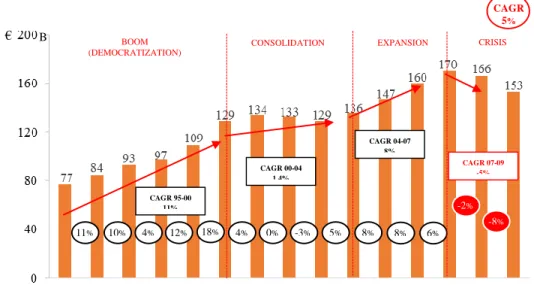
A case of a merger between LVMH and Hermès Page 22 | 75 11% 10% 4% 12% 18% 4% 0% -3% 5% 8% -8% -2% 6% 8% CAGR 95-00 11% CAGR 00-04 1,4% CAGR 04-07 8% CAGR 07-09 -5% BOOM (DEMOCRATIZATION)
CONSOLIDATION EXPANSION CRISIS
CAGR
5%
B
€
Figure 1: Worldwide Luxury Goods Market trend (1995-2009)
In conclusion, even though M&A is a complex and hard process to value, these transactions should be viewed as an opportunity to add value to forthcoming companies and to the economy as a whole.
4. INDUSTRY AND COMPANY ANALYSIS
4.1. OVERVIEW OF THE LUXURY MARKET
“With luxury goods, we are seeing the emergence of a new normal: the global market is maturing, stabilizing and consolidating. It is becoming more resilient to economic crisis, more responsive to a demanding and highly mobile global consumer base, and less reliant on market booms for growth. For all these reasons, luxury brands everywhere should be focusing on how to build growth organically.” (Claudia D’Arpizio, Bain&Company Partner).
Luxury is usually stratified in three layers: accessible, aspirational and absolute. A few other factors that determine the degree of luxury are price, uniqueness, availability, promotion, and brand. Moreover, the luxury industry usually covers products like perfumes and cosmetics, hard luxury, cognac, handbags and cases, furniture, vehicles, etc. These products are sold through wholesale, retail or online channel.
Economic growth worldwide, rising income and wealth levels, consumption of luxury goods by middle class population and continuous global urbanization are stimulating the development of the global luxury goods market. Its growth has high correlation with macro indicators, such as real GDP, tourist arrivals, wealth, and disposable income.
A case of a merger between LVMH and Hermès Page 23 | 75 As can be seen in figure 1, the Luxury market has been growing over the years. Since 2007, the beginning of the last crisis, luxury market saw a sever shrinking, decreasing by 2% and 8% in 2008 and 2009, respectively. Personal income and wealth declined following the financial chaos triggered by the subprime mortgage crisis and subsequent economic downturn. With high unemployment rates and low consumer confidence, luxury consumption declined sharply, especially in the mature markets of the U.S., Europe and Japan. Emerging markets, excluding China, were hit less severely and recovered quickly, with good prospects for next years.
The results began to improve only at the end of 2009, after three negative quarters, as a result of the holiday season that exceeded the expectations and the inventory normalization with the end of the de-stocking.
According to Bain&Company’s Luxury Market Study (Spring 2010), the market was expected to grow 4% in 2010 (at current exchange rates), with a growth spread across all geographies, except Japan and with Asia.
One of the main drivers propelling the growth of this market is the growing global online personal luxury goods market. The emergence of an off-price strategy in the online market is making personal luxury goods accessible to a greater number of individuals, since they can compare the prices of different products and make purchases. Furthermore, men are increasing their contribution to this market through online channels.
Therefore, for 2010, it is expected the recovery of macroeconomic indicators across the world, such as an expected GDP increase of 4.3%; strong urbanization and infrastructure investment in Asia, especially in China; political stability in U.S. enhancing consumer confidence; and a slight decrease of unemployment rate. The consumer Confidence Index is expected to increase in 2010, Chinese consumers will continue to spend heavily in luxury and a boom is expected in e-commerce sales.
4.2. COMPANY OVERVIEW –LVMH
When he was only sixteen years old, Louis Vuitton made a decision that would not only change his own life but the lives of his sons and future generations: he would become a trunk-maker.
4.2.1. HISTORY
In 1854, Louis Vuitton began manufacturing trunks in Paris. What he did not know was that the company he started went on to become one of the world's most famous makers of luxury goods. The
A case of a merger between LVMH and Hermès Page 24 | 75 company is now especially known for its designer logo, a beige-on-chestnut monogram of an intertwined "LV". As the years went by, the Vuitton line gained international recognition, thanks in part to a bronze medal at the 1867 World's Fair and a gold medal at the 1889 World's Fair, both held in Paris. Vuitton's luggage company became a world leader in luxury consumer goods, with products that include travel books, perfume, distilled spirits and designer clothing.
4.2.2. PRODUCTS OFFERING
The Luis Vuitton Moët Hennessey (LVMH) Group includes over 60 brands, split into 5 categories: Fashion & Leather Goods, Perfumes & Cosmetics, Wines & Spirits, Watches & Jewellery, Selective retailing and other activities.
a. Fashion & leather goods
The luxury Fashion & Leather Goods sector includes a group of mainly French brands, but also includes Spanish, Italian, British and American companies, each of them relying on quality, authenticity and originality of design to be successful. In order to keep pace with its enormous success around the world, major high-visibility stores were opened in Hong Kong, Macao, Singapore and Las Vegas. In 2008, the group accounted for 1090 stores over the world, increasing this number to 1164 in 2009. Also, this sector is the one that delivered higher profits during the last years, mostly originated in the Asian Continent. Through the last two years, business in Asia gained more value for the company, while Europe (excl. France) and United States lost.
Louis Vuitton is one of the most famous brands in this sector, which offers trunks, leather goods, ready-to-wear, shoes and accessories. Other brands owned by the LVMH Group include Fendi, Givenchy, Marc Jacobs, Donna Karan, Kenzo, Céline, Loewe, Berluti, Emilio Pucci, Thomas Pink, Edun, Nowness, Loro Piana and Nicholas Kirkwood.
For 2010, Louis Vuitton will implement a dynamic program of new store openings in new countries and an expansion in the ones where the Group is already present, such as China.
b. Perfumes & cosmetics
LVMH is one of the most thriving companies in the steadily growing market of perfumes and cosmetics. Driven by the contemporary consumer’s quest for beauty and wellbeing, as well as, rising levels of income in emerging countries and more diverse customer bases with differing needs, this market has numerous development opportunities.
A case of a merger between LVMH and Hermès Page 25 | 75 Also, the Group’s perfumes, make-up and skincare sector relies primarily on a portfolio of brands representing French companies with an international presence: Christian Dior, Guerlain, Givenchy and Kenzo. Nevertheless, the group also supports the development of high-potential brands: Benefit and Fresh, Acqua di Parma, Perfumes Loewe and Make Up For Ever.
The fact that the Group holds a significant number of brands allows for relevant synergies in this sector and constitutes a relational advantage, since the success of this sector depends heavily on design and advertising.
c. Wines & spirits
The LVMH Wines & Spirits business group focuses its growth on the high-end market segments of the market. Although, LVMH is the world leader in champagne, it also produces still and sparkling wines from the world’s most famous wine-growing regions. The Group is also the world leader in cognac with Hennessy. It holds 24 different brands, such as Moët & Chandon, Dom Pérignon, Château Cheval Blanc, among others. The portfolio of brands is served by a powerful international distribution network. As mentioned in the Perfumes & Cosmetics sector, Europe has been losing power, allowing Asia to climb to the top of revenue delivering regions.
d. Watches & jewellery
The most recent of the LVMH business groups holds a portfolio of luxury brands with highly complementary market positions. This business group benefits in particular from TAG Heuer’s recognition as the world leader in high-precision chronographs and from the solid Hublot brand. The business group also counts on the watch making expertise of Zenith, a member of the select group of Swiss Manufactures; the development and transition to high-end products of Dior timepieces; and the creativity and productivity of the jewellery collections from Chaumet, Fred and De Beers.
As many other sectors, watches and jewellery business segment recognized 2009 as a catastrophic year, which combined with the economic decline in demand and the reductions in inventories by multi-brand retailers and distributors, heavily affected the traditional major markets like the United States and Japan, where LVMH brands have a strong presence.
e. Selective retailing
The LVMH Selective Retailing companies operate in Europe, North America, Asia and the Middle East. Their businesses are conducted in two segments: retailing, designed for customers who are
A case of a merger between LVMH and Hermès Page 26 | 75
Table 1: Key statistics
international travellers (“travel retail”), and the selective retailing concepts represented by Sephora, the most innovative company in the beauty segment. Hence, the Selective Retailing sector encompasses 3 different brands: DFS – Retailer for international travellers; Starboard – Duty-free retail sales of luxury products aboard cruise ships; and Sephora, already mentioned, which focus on retail beauty chain. This sector is where United States outstands, appearing before Europe and Asia. However, it can also be observed the gradual progression of the Asian Continent on revenues delivery.
f. Other activities
LVMH’s activities that do not fall in the categories presented above belong to “other”. These include media communications, through the financial newspaper and website Les Echos; luxury super yacht industry represented by Royal Van Lent Shipyard B.V. brand; high-end luxury hotels entitled Cheval Blanc; an attraction park called Jardin d’Acclimatation, located in Paris; and La Samaritaine riverside real estate complex, located in central Paris.
4.2.3. FINANCIAL ANALYSIS
The last years have been unpredictable for the Louis Vuitton Group. The beginning of a world crisis has been affecting the Luxury Goods Market and, consequently, disturbing a well-established brand as LVMH.
As can be seen in table 1, from 2007 to 2008 it was still possible for the company to grow, although at a lower rate. However, 2009 was a catastrophic year for the company with a negative growth in revenues and EPS, and with a decrease on gross profit and EBITDA margins. Nevertheless, the brand was able to keep growing, seeing its value rising.
€ million 2007 2008 2009 Revenue 16 481 17 193 17 053 Growth % (7.68) (4.32) (0.81) Gross Profit 10 695 11 181 10 889 Margin % 64.89 65.03 63.85 EBITDA 4 109 4 323 4 055 Margin % 24.93 25.14 23.78 Adjusted EPS 4.27 4.28 3.58 Growth % 11.34 0.12 (16.21) Total Assets 30 384 31 483 32 106 Total Equity 12 528 13 793 14 785 Total Debt 5 615 5 585 5 785 Last Price 71.17 42.14 70.95
Current Shares Outstanding 490 490 490
A case of a merger between LVMH and Hermès Page 27 | 75 In a particularly uncertain economic context, the stock markets recorded extreme variations in 2009, reaching new lows in 2008.
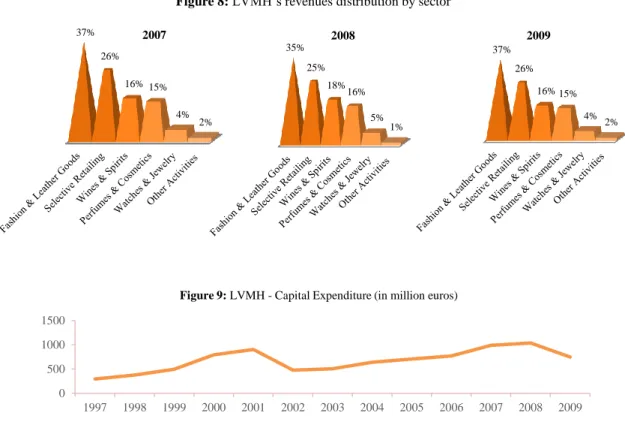
Comparing the revenue distribution over the last three years, it can be notice a slight shift from the Perfumes & Cosmetics, Watches & Jewellery and Wines & Spirits sectors to the Fashion & Leather Goods and Selective Retailing business segments. Nonetheless, across the years, these last two sectors have been the top two in achieving higher revenues for the Group.
In line with the increasing number of LVMH Group stores and expansion to new markets, the investment on new assets and improvements of old ones has been increasing through the years with a slight decrease in 2009, as a result of the recent crisis and costs cuts.
4.3. COMPANY OVERVIEW – HERMÈS
For the last 175 years, Hermès has been creating, inventing and innovating. Some of their models have never gone out of style, and are still popular today. Reissued, reinterpreted and reinvented, these timeless creations forge the identity of Hermès.
4.3.1. HISTORY
The Hermès Fashion House was established in Paris as a harness making shop in 1837 by Thierry Hermes (1801-1878). This man started handcrafting horse harnesses for caliches and carriages in 1837. It was in late 1879 that the line was expanded by Charles-Emile Hermès and it was only in 1922 that the company introduced its first handbags.
4.3.2. PRODUCTS OFFERING
Hermès is a French company focused on Leather Goods – Saddlery, Ready-to-Wear & Fashion Accessories, Silk & Textiles, Perfumes, Watches, Tableware, Jewellery & Art of Living, and also incorporating other group brands and products.
a. Leather goods – saddlery
Leather Goods-Saddlery, the original métier of the house of Hermès, is expressed in collections of bags and clutches, briefcases, luggage, diaries and writing products, small leather goods, saddles, equestrian articles and clothing for both horse and rider. As demand continues to exceed supply, the Group further expanded its production capacity in 2009, opening new stores and improving old ones.
A case of a merger between LVMH and Hermès Page 28 | 75 b. Ready-to-wear & accessories
Ready-to-Wear & Accessories is the Hermès Group’s second-largest business line, accounting for 19% of consolidated revenue. Christophe Lemaire, artistic director of women’s ready-to-wear, continues to build up the Hermès wardrobe. Also, the fashion accessories include jewellery, gloves, hats, belts and shoes.
This segment is one of Hermès’ sectors that have been registering consistent revenues over the last years.
c. Silk & textile
Silk and Textiles is Hermès’ third-largest sector and accounts for 12% of consolidated revenue. The types of products present in this sector include the world famous carrés (square scarves), ties as well as other scarf models produced in cashmere and silk. Despite the crisis environment, this segment has been registering an increase of revenues.
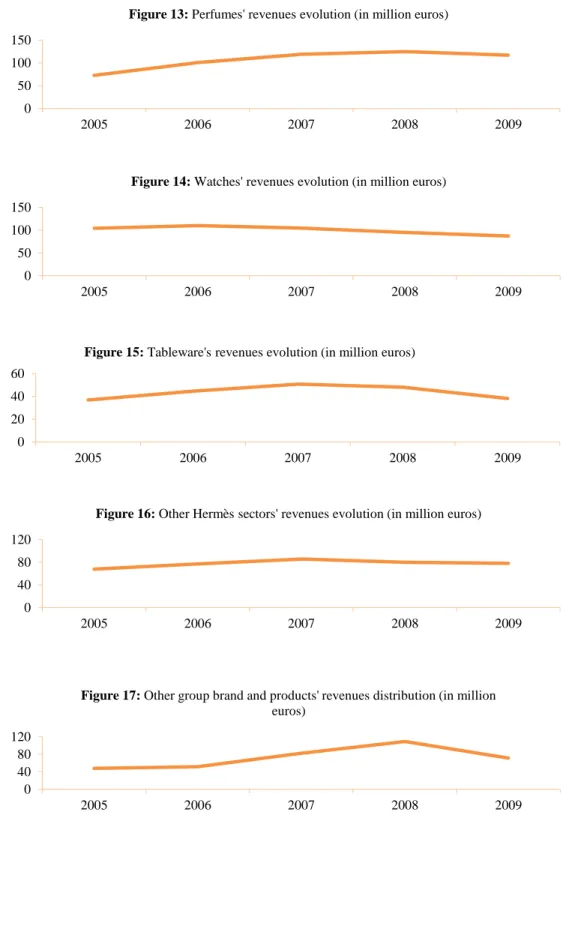
d. Perfumes
Perfumes sales suffered a lot from the worldwide recession, which caused a drop in consumption and induced both retailers and distributors to scale back their inventories. Even so, Hermès’ fragrance lines held up extremely well owing to the House’s efforts to add new products to fragrance collections. However, the Perfumes segment was strongly affected by the recent crisis, registering a decrease in revenues, presenting in this way a negative growth rate from 2008 to 2009.
e. Watches
Despite a serious crisis in the Swiss watchmaking sector, La Montre Hermès gained market share, building on its reputation as an alternative to other famous names in watches. The sector expanded into new markets in Eastern Europe, Middle East and South America, which yielded excellent results within the first few weeks. However, the improvements made were offset by revenues drop, which have been recording negative growth rates over the last two years.
f. Tableware
This segment encompasses La Table Hermès, Les Cristalleries de Saint-Louis and Puiforcat. As in the watches sector, 2009 was a particularly difficult year, owing to a combination of lower sales and substantial inventory drawdowns by distributors.
A case of a merger between LVMH and Hermès Page 29 | 75 g. Art of living and jewellery
Hermès derived 4% of its sales from its other métiers, which include Jewellery and Art of Living. The Jewellery sector continued its strong dynamic with numerous creations, collection development and events.
Carried by its distinctive vision of the art of living, Hermès now puts its name to a complete range for the home. New collections of furniture, furnishing fabrics, wallpapers and carpets extend the existing collections of decorative objects, tableware and textiles. However, the lower purchasing power that has been affecting the population around the world, did not allowed this sector to grow over the last two years.
h. Other group brands and products
While the Hermès brand is the centre of the Group’s business, there are also other brands and products under the Hermès world that are fully aligned with the Group’s identity. This segment embraces John Lobb Bootmaker, Textiles, Tanning and Precious Leathers, Hermès Horizons and Petit H.
In 2009, Hermès announced the launch of a new brand in Shanghai called Shang Xia, which will design, manufacture and distribute objects that employ exceptional Chinese materials and know-how. Shang Xia, whose Shanghai store opens in 2010, will offer a collection of furniture, art of living products, ready-to-wear and accessories.
Nevertheless, the bad performance of these brands is evident in 2009, with a very negative growth rate of revenues.
4.3.3. FINANCIAL ANALYSIS
Despite the uncertain economic climate, Hermès stores generated strong sales growth in 2009. This is because they proved extraordinarily in their response to the situation, while steadfastly abiding by the house’s fundamental values.
Hermès products are available worldwide through a network of 304 exclusive stores and 21 other retail outlets. Watches, perfumes and tableware are also sold through networks of specialised stores, on board aircraft and in airport duty-free stores.
A case of a merger between LVMH and Hermès Page 30 | 75
Table 2: Key statistics
In 2009, the Hermès Group’s consolidated revenue registered €1 914 million, a year-on-year rise of 4.1% at constant exchange rates and of 8.5% at current exchange rates. The gross margin was 63.3%, a 1.3 percentage point decrease compared with 2008, due to adverse currency impact and to the low activity at certain production sites. Equity increased, once again, thanks to the profits generated by the Group. Shareholders’ equity rose from €1 589 million, as at 31 December 2008, to €1 790 million, as at 31 December 2009.
The Hermès Group created 163 new jobs during the year. At the end of 2009, the Group had 8 057 employees throughout the world.
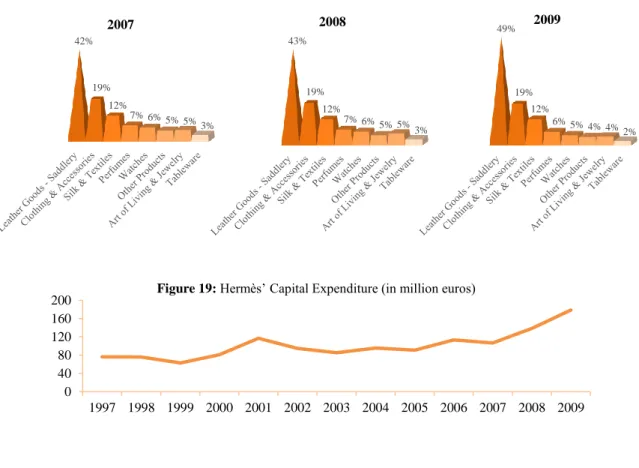
Regarding revenues distribution, the eight sectors that Hermès comprises have been stable through the years. Leather Goods and Saddles sector, accounts for almost half of Hermès’ revenues. From 2007 to 2009, there are only slight changes on revenues distribution by sector.
Despite crisis environment, Hermès Group has been remarkable in its investments, which present an increasing trend across the years. The constant stores opening and expansion to diverse markets has been requiring an increasing investment from this company.
5. FORECAST ASSUMPTIONS
As already mentioned in the literature review, the analysis of the synergies created by the combination of Louis Vuitton Möet Hennessy and Hermès requires, in the first place, an individual valuation of both companies, as if they were optimally managed. For that reason, it needs to be taken into account
€ million 2007 2008 2009 Revenue 1 625 1 765 1 914 Growth % 7.27 8.58 8.48 Gross Profit 1 055 1 140 1 213 Margin % 64.89 64.61 63.34 EBITDA 484 528 548 Margin % 29.75 29.90 28.63 Adjusted EPS 2.61 2.76 2.74 Growth % 5.28 5.70 (0.98) Total Assets 2 065 2 326 2 441 Total Equity 1 475 1 602 1 804 Total Debt 86 96 65 Last Price 79.23 92.62 87.36
Current Shares Outstanding 106 105 106
A case of a merger between LVMH and Hermès Page 31 | 75 not only the future evolution of the luxury sector, but also the way each company will behave inside this sector.
To provide more consistent results, the procedure adopted will involve three different valuation methods – WACC, APV and Multiples. Nonetheless, the result of these methods should be approximately the same, as long as the assumptions for each of them are the same. Moreover, it will be performed a scenario analysis, so that one can understand the implications of the economic uncertainty felt nowadays.
Each company’s valuation will be centred on its future strategic objectives, without disregarding the way they have behaved in past years. For this reason, historical data was collected to allow a perspective of the trend in the last years, incorporating, in this way, the last world crisis – how the companies reacted to the beginning of a crisis and how they are recovering. The explicit period used to forecast companies’ future performances will be 10 years. Although, it can be thought that 10 years is too long to forecast any unpredicted trend, it will allow to reach a stable growth period for both companies.
5.1. INFLATION
Since both companies provide financial information in Euros, it is reasonable to assume an inflation rate related to this currency, so that estimations can be more accurate. Therefore, based on European Central Bank’s studies, an inflation of 1.3% will be used for 2010, 1.4% for 2011 and 2% for the remaining years. These inflation rates will reflect the prospects for a slow economic recovery worldwide.
5.2. COST OF FINANCIAL DISTRESS
For the APV method there is a need of finding cost of financial distress. Based on literature review, for both LVMH and Hermès, a 10% of total firm value will be assumed in case of default. Also, taking into account debt ratings, a 0.5% of probability of default will be considered.
5.3. LVMH ASSUMPTIONS
In 2009, at the end of a year marked by an unprecedented global crisis, LVMH Group increased its market share. The Group’s resilience was largely due to the businesses diversity: while the Wines & Spirits and Watches & Jewellery brands were more affected by the crisis, due to destocking at distributors and retail traders, the rest of the sectors enjoyed better conditions.
A case of a merger between LVMH and Hermès Page 32 | 75 As previously referred, LVMH Group will be valued using WACC, APV and Relative Valuation methods. Thus, this part aims to clarify all assumptions that will be made concerning growth rates and capital structures. At the end, it will be possible to set a price target through the WACC method. This price might be compared with the APV price target once the tax shields and the cost of financial distress are calculated. The Relative Valuation will imply a comparison of the company with its peer group focused on market multiples applied to several financial indicators.
5.3.1. REVENUE
The Group is composed by six different segments, each of them with information for six different geographic regions. The information provided by this company, makes possible to allocate consolidated values to each specific segment and discriminate them by geographic regions.
Revenue forecast is the most important step on valuation since it affects all the other values, such as operating margins. In LVMH case, revenues are expected to keep increasing, resulting from the expansion strategy of the company.
a. Fashion & leather goods
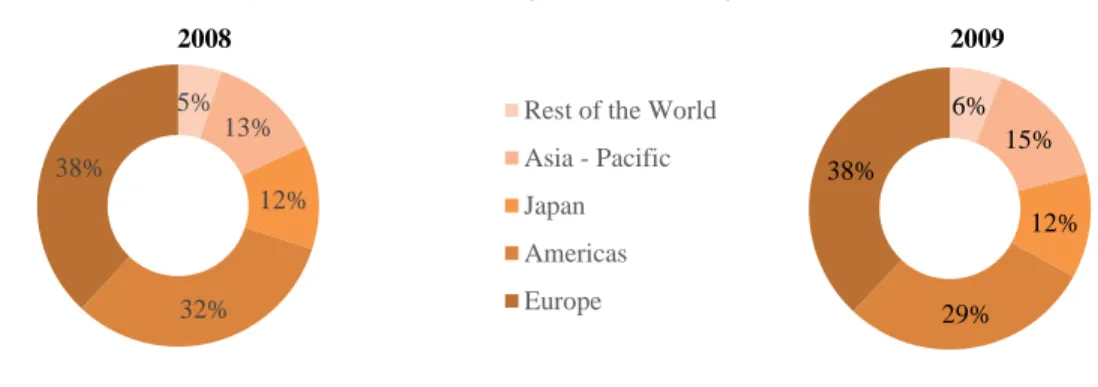
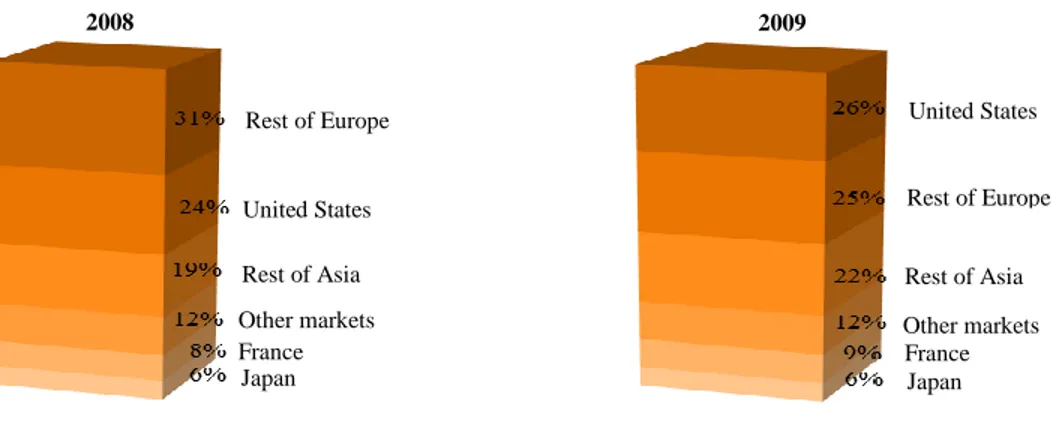
As shown in previous sections, the Fashion & Leather Goods sector is the strongest one. During the last years represented around 34-37% of total revenues and it is expected to remain its key driver. For this share, the Asian Continent was the biggest contributor, accounting for 45-47% of total revenue. From 2008 to 2009, Asian countries (excl. Japan), increased its revenue share by 6 p.p. up to 31%, followed by Europe (excl. France) with 19% and United States with 18%. This trend is expected to continue with Louis Vuitton new stores openings and new developments, which include expansion to new countries and in China’s market. The company is also planning the launch of new products in the men’s segment.
According to Bain&Company studies, for 2010 the Fashion & Leather Goods sector is expected to grow around 20% with a fast positive rebound of US. Nevertheless, Goldman Sachs report stated that the expected increase in urban population suggested global 14% revenue growth for 2011 and 2012. As world comes out of the crisis, the revenues will tend to stabilize and reach an annual grow of 4% until 2019.
A case of a merger between LVMH and Hermès Page 33 | 75 b. Perfumes & cosmetics
Perfumes & Cosmetics segment only represents 15-16% of total revenue. From 2008 to 2009, its revenues decreased by 5%, representing 1 p.p. drop on its share of revenues delivery. This drastic reduction is a result of global crisis, which led to cut in retailers’ inventories so that they could maintain their cash flows.
In this sector, 53% of total revenue was originated in Europe, followed by the Asian continent (25%). However, from 2008 to 2009, while Asia share increased by 5 p.p., Europe lost power with a drop of 5 p.p. It is expected that Europe continues to be the dominant region but closely followed by Asia. For 2010, LVMH brands were bet on quality and creativity for new releases.
Due to the recent crisis that has been affecting seriously this sector, some of LVMH brands have not performed so well. Nonetheless, a slow recovery is expected with a growth rate increase, which will stabilize at 5% in the long term.
c. Wines & spirits
In 2009, Wines & Spirits sector accounted for € 2 732 million, 16% of total revenues, representing a 12.35% drop relatively to 2008. It has been two years of consequent losses due to markets uncertainty. The consequences of the recession for consumption and massive inventory reductions by distributors created a particularly difficult environment, although with significant sector and regional differences. The clear strategy, solid positions in traditional and in emerging markets, a reputation for excellence,; a strong capacity for innovation and the contribution of expanded resources in the field will allow the brands to seize every opportunity for short-term growth and to continue to build and strengthen their leadership in the longer term. For this reason, it is expected a growth rate of 11% on the next four years, until 2013, and from then onwards a 2% will be assumed.
d. Watches & jewellery
In the past two years, Watches & Jewellery only represents, on average, 5% of LVMH total revenue. As a result of the recent recession, revenues decreased by 12.86%, from 2008 to 2009. Even so, this sector amounted for € 752 million, 24% coming from Europe (excl. France), followed by Asia (excl. Japan).