E
EccoonnRReessGGuuaarrdd 225566 22001122
BANK CREDIT AND ECONOMIC GROWTH: A DYNAMIC
PANEL DATA ANALYSIS
Nuno Carlos Leitão
Polytechnic Institute of Santarém, and CEFAGE, University of Évora, Portugal
E-mail:
[email protected]
Abstract
This study examines the link between bank lending and economic growth for European Union (EU-27) for the period 1990 to 2010. We apply a dynamic panel data (GMM-system estimator). This estimator permits to solve the problems of serial correlation, heteroskedasticity and endogeneity for some explanatory variables. As the results show, savings promotes growth. The inflation and bank credit have a negative impact on economic growth as previous studies.
Keywords: Economic Growth, Bank Credit, Panel Data
JEL classification: G21, O16, C33
1. Introduction
In recent years, the financial development has become an important issue in the economics literature. This paper tests the link between bank credit and economic growth. We examine this link for European Union (EU-27). The period 1990-2010 was chosen on the basis of its providing a sufficient number of observations. The methodology uses a panel data approach. The panel is unbalanced due to the lack of information on some countries in all of the years analyzed. The motivation of this article reports on analyzing the relationship between bank credit and economic growth for the countries of the European Union (EU-27). The current economic and financial crisis in the European Union shows that regional disparities are evident in the euro zone, particularly in Portugal, Spain and Greece. The current crisis questioned the principles of economic convergence (Rousseau and Wachtel, 2011). In this context, bank credit may slow investment activity and consequently less growth.
In fact, the dominant literature refers that the domestic credit promotes economic growth (Aghion et al. 2005; Rousseau and Wachtel 2002). The bank lending can promote the growth, but depends on
E
EccoonnRReessGGuuaarrdd 225577 22001122
the level of economic development. However, the real economy shows that household debt makes decrease the growth.
Based on literature review, this article questions the dominant literature. We use the dynamic panel (GMM-System) to solve the problems of autocorrelation and heterogeneity (Rousseau and Wachtel 2011). As an alternative technique we could have used the fixed effects as suggests Hansen (1999). However, issues of endogeneity and serial correlation for some explanatory variables remain unresolved (Blundell and Bond 1998, 2000, and Windmeijer 2005). This is the main reason why we use the GMM-System. This issue will be explained in Section 3, when we report the econometric model.
Aghion et al. (2005) show that coefficient of the initial GDP per capita reacts with financial intermediation. The authors demonstrate that schooling, geography, health policy, politics, and institutions do not affect the interaction between financial intermediation and initial per capita GDP. Moreover, there is no independent effect on convergence in regressions. The study of Yilmazkuday (2011) shows that thresholds of inflation, government size, trade openness, and per capita income for the finance-growth nexus are investigated using five-year averages of standard variables for 84 countries from 1965 to 2004. The results suggest that high inflation crowds out positive effects of financial depth on long-run growth. The study also identifies that the size of government and the degree of openness may or may not have a positive effect on financial development, depending on the level of economic development. The study of Rousseau and Wachtel (2011) shows that credit growth can generate a weak banking system, being explained by financial crises. The authors use a static (Pooled OLS, and fixed effects estimator) and dynamic panel data (GMM-System). Rousse and Wachtel (2011: 279) refer that is better to use GMM-System; i.e dynamic panel data are more robust than static panel data.
The results presented in this manuscript are generally consistent with the expectations of financial development studies. Our results show that credit boom can weaken the banking system. The remainder of the paper is organized as follows: Section 2 presents the theoretical background; Section 3 presents the econometric model used in this study. Section 4 displays the empirical results; and the final section provides the conclusions.
2. Literature review
In this section we present a survey of the theoretical models of economic growth and their relationship with financial development. The literature (Goldsmith, 1969; McKinnon, 1973; Levin et al. 2005) shows that financial system promotes the economic growth. The financial instruments as is domestic credit provided by banking sector, the liquid liabilities of the system in the economy, are correlated with gross to domestic savings, and openness trade. According to growth endogenous models these proxies are explanatory variables of economic growth. Levine et al. (2000) consider that there is a correlation between financial system and economic growth. Hassan et al. (2011) demonstrates that there are arguments to consider a causal direction within financial institutions and
E
EccoonnRReessGGuuaarrdd 225588 22001122
economic growth, i.e these proxies reinforce between them. Khan (2001) found causality between financial institutional and economic growth. There is some robust evidence that international trade is positively correlated with economic growth (Grossman and Helpman 1991, Rebelo 1991, Leitão, 2010, and Hassan et al. 2011). However some authors as in Lai et al. (2006), and Onaran and Stockhammer (2008) found a negative association between openness trade and growth.
According to the literature the financial market is positively correlated with financial services, and this promotes the economic growth. La Porta et al. (1998), Levine et al. (2000), Leitão (2010), Hassan et al. (2011) defend this idea. There is no consensus in domestic credit that this proxy promotes economic growth. Leitão (2010) finds a positive correlation between domestic credit and growth. The author examines the link between financial development and economic growth for European Union Countries and BRIC (Brazil, Russia, India and China) for the period 1980 to 2006. Levine et al. (2000) applied a dynamic panel data. The author concludes that financial market promotes the economic growth. Hassan et al. (2011) and Levine (1997) defend and find a negative impact of credit in economic growth. In fact domestic credit discourages the investment and savings. In this way we can consider a negative correlation within credit and growth.
The empirical studies (Padovano and Galli, 2002, Koch et al., 2005, Lee and Gordon, 2005) demonstrate that a higher taxes system cause a decrease on economic growth. On the other hand fiscal policy can be understood as an indicator control or adjusted to the government spending and the inflation.
3. Econometric model
The dependent variable is the real GDP per capita of European Countries for the period 1990 and 2010. The data are taken from World Development Indicators, the World Bank. In the appendix can be observed the panel data-line plot of economic growth. This research uses a panel data. The static panel data have some problems in serial correlation, heteroskedasticity and endogeneity of some explanatory variables. The estimator GMM-system (GMM-SYS) permits the researchers to solve the problems of serial correlation, heteroskedasticity and endogeneity for some explanatory variables. These econometric problems were resolved by Arellano and Bond (1991), Arellano and Bover (1995) and Blundell and Bond (1998, 2000), who developed the first differenced GMM (GMM-DIF) estimator and the GMM system (GMM-SYS) estimator. The GMM-SYS estimator is a system containing both first differenced and levels equations. The GMM- SYS estimator is an alternative to the standard first differenced GMM estimator. To estimate the dynamic model, we applied the methodology of Blundell and Bond (1998, 2000), and Windmeijer (2005) to small sample correction to correct the standard errors of Blundell and Bond (1998, 2000). The GMM system estimator that we report was computed using STATA. The GMM- system estimator is consistent if there is no second order serial correlation in the residuals (m2 statistics). The dynamic panel data model is valid if the estimator is consistent and the instruments are valid.
E
EccoonnRReessGGuuaarrdd 225599 22001122
3.1. Explanatory variables and testing of hypothesis
Based on the literature, we formulate the following hypothesis:Hypothesis 1: The international trade promotes economic growth.
The international trade is measured by:
i i it X M
Trade , (1) where Xi represents the annual exports of each trade partner at time t and Mi, represents the annual
imports. The data for trade were collected from World Bank. We expected a positive sign for this proxy. It should be noted that the previous studies (Grossman and Helpman 1991, Rebelo 1991) found a positive relationship between openness trade and growth.
Hypothesis 2: The domestic credit promotes the economic growth. Hypothesis 2 a: The domestic credit discourages the economic growth
Rousseau and Wachtel (2002) defend the idea that domestic credit can have different interpretations. The first idea is financial system has a positive impact on economic growth. However a credit boom can weaken the banking system and an increase inflationary pressure. Shaw (1973), Hassan et al. (2011), and Rousseau and Wachtel (2011) provide theoretical and empirical supports for this hypothesis. Credit - Domestic credit provided by the banking sector, which includes all credit to various sectors on a gross basis, with the exception of credit to the central government. Bank - Domestic credit provided by the banking sector, which covers claims on private non-financial corporations, households, and non-profit institutions. The data of bank credit were collected by World Bank.
Hypothesis 3: There is a positive correlation between savings and investment.
Pagano, (1993), and Hassan et al. (2011) consider that savings promote economic growth.
Hypothesis 4: The growth is negatively correlated with inflation.
Inf - is inflation, i.e, measured by the consumer price index reflects the annual percentage change in the cost to the average consumer of acquiring a basket of goods and services that may be fixed or changed at specified intervals, such as yearly. Rousseau and Watchel (2002) discuss various arguments for the correlation between inflation and growth, i.e how the finance-growth nexus is affected by inferior rates. The authors concluded that the level of financial depth varies inversely with inflation in low-inflation environments and that disinflation is associated with a positive effect of financial depth on growth. The studies of Gillman and Kejak( 2005), and Fountas et al. (2006) found a negative effect on growth. The data was collected by World Bank.
E EccoonnRReessGGuuaarrdd 226600 22001122
3.2. Model specification
it i it 1 0 it β βX δt η ε Growth , (2) where Growthit is real GDP per capita, and X is a set of explanatory variables. All variables are inthe logarithm form; i is the unobserved time-invariant specific effects; tcaptures a common
deterministic trend; it is a random disturbance assumed to be normal, and identically distributed
with E (it)=0; Var (it)= 0
2
.
The model can be rewritten in the following dynamic representation:
it i 1 it 1 it 1 0 1 it it Growth β βX ρβX δt η ε Growth , (3) where Growthit is real GDP per capita, X is a set of explanatory variables. All variables are in the logarithm form.
4. Empirical results
The correlations and descriptive statistics for panel data is presented in the following tables. Table 1 and Table 2 show the correlations and summary statistics for each variable. The static panel (fixed effects and random effects) could be observed in appendix.
Table 1 - Correlations between variables
Variables
LnGrowth LnCredit
LnBank
LnTrade LnSavings LnINF
LnGrowth 1.00
LnCredit
-0.25
1.00
LnBank
-0.33
0.95
1.00
LnTrade
-0.17
0.50
0.49
1.00
LnSavings -0.06
0.12
0.13
0.192
1.00
LnINF
0.07
-0.49
-0.43
-0.49
-0.18
1.00
Source: Own elaboration
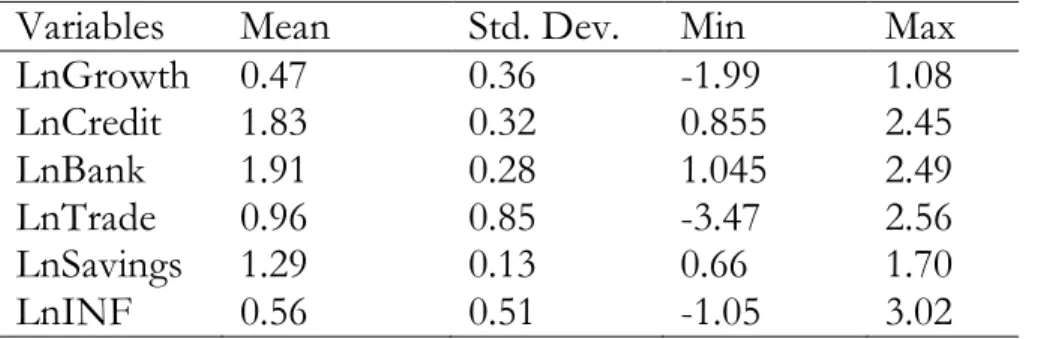
Table 2 shows that LnGrowth, LnINF and LnTrade appear to have only little differences between means and standard deviation. The same is valid to LnCredit, LnBank and LnSavings.
E
EccoonnRReessGGuuaarrdd 226611 22001122
Table 2 - Summary statistics
Variables
Mean
Std. Dev.
Min
Max
LnGrowth 0.47
0.36
-1.99
1.08
LnCredit
1.83
0.32
0.855
2.45
LnBank
1.91
0.28
1.045
2.49
LnTrade
0.96
0.85
-3.47
2.56
LnSavings 1.29
0.13
0.66
1.70
LnINF
0.56
0.51
-1.05
3.02
Source: Own elaboration
Before estimating the regression model, we have conducted a test for unit root of the variable. Table 3 presents the results of panel unit root (ADF- Fischer Chi square). The most important variables such as economic growth (LnGrowth), LnCredit (domestic credit provided by the banking sector, which includes all credit to various sectors on a gross basis, with the exception of credit to the central government), domestic credit which includes private non-financial corporations, households, and non-profit institutions (LnBank), savings (LnSavings), and inflation (LnINF) do not unit roots, i.e, are stationary with individual effects and individual specifications.
Table 3 - Panel unit roots: ADF based on augmented Dickey-Fuller tests ADF- Fischer Chi square
Statistic
p-value
LnGrowth
195.98
0.00
LnCredit
92.57
0.00
LnBank
72.80
0.05
LnTrade
60.93
0.24
LnSavings
92.80
0.00
LnINF
148.27
0.00
Source: Own elaboration
Table 4 reports model 1 using GMM-System. Four explanatory variables are statistically significant (LnGrowtht-1, LnCredit, LnSavings, and LnINF). The model presents consistent estimates, with no serial correlation (m2 statistics). The specification Sargan test shows that there are no problems with the validity of instruments used.
E
EccoonnRReessGGuuaarrdd 226622 22001122
Table 4 - GMM-System Estimator: Model [1]
Variables
Coefficient
Expected Signs
LnGrowth
t-10.22 (2.06)**
(+)
LnCredit
-0.44 (-2.79)***
(-)
LnTrade
0.03 (0.79)
(+)
LnSavings
0.82 (2.09)**
(+)
LnINF
-0.12 (-1.69)*
(-)
C
0.11 (0.28)
N
317
Arellano and Bond test Ar2
0.72
Sargan test
1.00
Source: Own elaboration
The null hypothesis that each coefficient is equal to zero is tested using one-step robust standard error. T-statistics (heteroskedasticity corrected) are in round brackets. P values are in square brackets; ***/**-statistically significant at the 1, and 5 percent level. Ar(2): is tests for second-order serial correlation in the first-differenced residuals, asymptotically distributed as N(0,1) under the null hypothesis of no serial correlation (based on the efficient two-step GMM estimator).The Sargan test addresses the over identifying restrictions, asymptotically distributed X2 under the null of the instruments’ validity (with the two-step estimator).
As expected for the Lagged dependent variable (LogGrowtht−1) the result presents a positive sign, showing the economic growth have a significant impact on long-term effects. The coefficient of domestic credit (LnCredit) is negatively correlated with growth. We can infer that domestic credit and growth depend on financial climate. Our result shows that credit growth can generate a weak banking system, being explained by financial crises. As we expected the variable of savings (LnSavings) finds a positive impact on growth. This result is according to previous studies (Pagano, 1993, and Hassan et al. 2011). The coefficient of inflation (LnINF) finds a negative sign. Gillman and Nakov (2004) found a negative impact for Hungary and Poland. Our result show that level of financial depth varies inversely with inflation in low-inflation environments.
The model 2 is reported in table 5. The model presents consistent estimates, with no serial correlation (m2 statistics). The specification Sargan test shows that there are no problems with the validity of instruments used. The Lagged dependent variable (LogGrowtht−1) presents a positive sign, showing the economic growth have a significant impact on long-term effects. The model presents four explanatory variables with statistically significant (LnGrowtht-1,Lnbank, Lnsavings, and LnINF). The results are according to the literature. The coefficient of domestic credit provided by the banking sector, which covers claims on private non-financial corporations (LnBank) is in line that credit growth, can generate a weak banking system, being explained by financial crises.
The coefficients of savings (LnSavings) and inflation (LnINF) are according to previous studies (Pagano, 1993; Hassan et al. ,2011, and Rousseau and Watchel ,2002). So we can infer that there is a positive correlation between savings and investment. Moreover, the level of financial depth varies
E
EccoonnRReessGGuuaarrdd 226633 22001122
inversely with inflation in low inflation and deflation which is associated with a positive effect on the growth financial depth.
Table 5 - GMM-System Estimator : Model [2]
Variables
Coefficient
Expected Signs
LnGrowth
t-10.22 (2.12)**
(+)
LnBank
-0.52 (-2.59)**
(-)
LnTrade
0.03 (0.57)
(+)
LnSavings
0.84 (2.09)**
(+)
LnINF
-0.13 (-1.77)*
(-)
C
0.29 (0.79)
N
317
Arellano and Bond test Ar2
0.84
Sargan test
1.00
Source: Own elaboration
The null hypothesis that each coefficient is equal to zero is tested using one-step robust standard error. T-statistics (heteroskedasticity corrected) are in round brackets. P values are in square brackets; **/*-statistically significant at the 1, and 10 percent level. Ar(2): is tests for second-order serial correlation in the first-differenced residuals, asymptotically distributed as N(0,1) under the null hypothesis of no serial correlation (based on the efficient two-step GMM estimator).The Sargan test addresses the over identifying restrictions, asymptotically distributed X2 under the null of the instruments’ validity (with the two-step estimator).
5. Conclusions
This paper analyses the link between economic growth and bank credit. It was introduced explanatory variables as domestic credit, savings, bilateral trade and inflation to evaluate this issue. The results indicate that the endogenous models have a greater potential to explain economic growth. The relationship between economic growth and bank credit was presented with GMM-system estimator. Our findings suggest that the economic growth is a dynamic process. The study confirms that savings promotes the growth. The inflation and domestic credit are negatively correlated with economic growth.
According to econometric results we can infer that bank lending discourages the economic growth. This is not the dominant hypothesis. However this alternative hypothesis is also predicted in the literature (Shaw 1973; Hassan et al., 2011, and Rousseau and Wachtel 2011). The results show that credit growth can generate a weak banking system, being explained by financial crises. Our result is in line with Rousseau and Wacthel (2002), i.e a credit boom can weaken the banking system and an increase inflationary pressure. Indeed, the euro zone presently presents a financial crisis, with a special emphasis to Portugal, Spain and Greece, showing regional imbalances between euro zone countries.
E
EccoonnRReessGGuuaarrdd 226644 22001122
In terms of economic policy recommendations, the results shows that credit growth may lead to weakness of the banking system, which is in line with the present situation of the European economy. It will be necessary an adjustment in macroeconomic policies. This evidence can serve as a lesson for the new EU countries, which still not belong to the euro zone.
The higher level of inflation reflects macroeconomic problems. As in Rousseau and Wachtel (2002) we can concluded that finance-growth nexus is affected by inferior rates. The level of financial depth varies inversely with inflation in low-inflation environments. The savings is essentially for the macroeconomics stability.
Acknowledgments
The author is indebted to the anonymous referee for greatly improving from the previous version. The author is also thankful to the Mihai Mutascu to support our paper.
References
Aghion P, Howitt P, Mayer-Foulkes D (2005). The effect of financial development on convergence: theory and evidence. Quarterly Journal of Economics. 120(1): 173-222.
Arellano M., Bond S (1991). Some test of specification for panel data: Monte Carlo evidence and an application to employment equations. Review of Economic Studies. 58: 277-297.
Arellano M, Bover O (1995). Another look at instrumental variable estimation of error- components models. Journal of Econometrics. 68: 29-51.
Blundell R, Bond S (1998). Initial conditions and moment restrictions in dynamic panel data models. Journal of Econometrics Review. 87: 115-143.
Blundell R, Bond S (2000). GMM estimation with persistent panel data: an application to production functions. Econometrics Review. 19: 321-340
Fountas S, Karanasos M, Kim J (2006). Inflation Uncertainty, Output Growth Uncertainty and Macroeconomic Performance. Oxford Bulletin of Economics and Statistics. 68(3): 319- 334.
Gillman M, Kejak M (2005). Inflation and Balanced-Path Growth with Alternative Payment Mechanisms. Economic Journal. 115(500): 247-270.
E
EccoonnRReessGGuuaarrdd 226655 22001122
Grossman G, Helpman E (1991). Quality ladders in the theory of growth. Review of Economic Studies. 58: 43-61.
Hansen B (1999). Threshold effects in non-dynamic panels: Estimation, testing and inference, Journal of Econometrics. 81: 594-607.
Hassan MK, Sanchez B, Yu SJ (2011). Financial development and economic growth: New evidence from panel data. The Quarterly Review of Economic and Finance. 51: 88-104.
Khan A (2001). Financial development and economic growth. Macroeconomics Dynamics. 5: 413–433. King RG, Levine R (1993). Finance and Growth: Schumpeter Might be Right. Quarterly Journal of Economics. 108 : 717-737.
Koch S, Schoeman N, Tonder J (2005). Economic growth and the structure of taxes in South Africa: 1960-2002. The South African Journal of Economics. 73(2): 190-210.
La Porta R, Lopez de Silanes F, Shleifer A, Vishny RW (1998). Law and Finance. Journal of Political Economy. 106: 1113-1155.
Lai M, Peng S, Bao Q (2006). Technology Spillovers, Absorptive Capacity and Economic Growth. China Economic Review. 17(3): 300-320.
Lee Y, Gordon RH (2005). Tax structure and economic growth. Journal of Public Economics. 89(5-6): 1027-1043.
Leitão NC (2010). Financial development and economic growth: A panel data approach. Theoretical and Applied Economics. XVII 5(511): 15-24.
Levine R (1997). Financial development and economic growth: Views and agenda. Journal of Economic Literature. XXXV: 688-726.
Levine R, Loayza N, Beck T (2000). Financial intermediation and growth: Causality and causes. Journal of Monetary Economics. 46: 31–77.
Levine R (2005). Finance and growth: Theory and evidence. In P. Aghion & S. Durlauf (Eds.), Handbook of economic growth. The Netherlands: Elsevier Science.
McKinnon RI (1973). Money and capital in economic development. Washington, DC: Brookings Institution. Onaran O, Stockhammer E (2008). The Effect of FDI and Foreign Trade on Wages in the Central and Eastern European Countries in the Posttransition Era: A Sectoral Analysis for the Manufacturing Industry. Structural Change and Economic Dynamics. 19(1): 66-80.
E
EccoonnRReessGGuuaarrdd 226666 22001122
Padovano F, Galli E (2002). Comparing the growth effects of marginal vs. average tax rates and progressivity. Europäische Zeitschrift für politische Ökonomie. 18(3): 529-544.
Pagano M (1993). Financial markets and growth: An overview. European Economic Review. 37: 613-622. Rousseau PL, Wachtel P (2002). Inflation Thresholds and the Finance-Growth Nexus. Journal of International Money and Finance. 21: 777-793.
Rousseau PL, Wachtel P (2011). What is happening to the impact of financial deepening on economic growth? Economic Inquiry. 49(1): 276-288.
Rebelo ST (1991). Long-run policy analysis and long-run growth. Journal of Political Economy. 99: 500-521.
Shaw ES (1973). Financial deepening in economic development. New York: Oxford University Press. Yilmazkuday H (2011). Thresholds in the finance-growth nexus: A cross-country analysis. World Bank Economic Review. 25(2): 278-295.
Windmeiger F (2005). A finite sample correction for the variance of linear efficient two-step GMM estimators. Journal of Econometrics. 26: 25-51.
Appendix
Table 6 - Fixed Effects and Random Effects: Model [1]
Variables Fixed Effects Random Effects Expected Signs
LnCredit -0.31 (-3.18)*** -0.33 (-3.92)*** (-) LnTrade 0.09 (2.61)*** 0.03 (1.05) (+) LnSavings 0.51 (2.16)** 0.22 (1.06) (+) LnINF -0.14 (-2.36)** -0.12 (-2.19)** (-) C 0.32 (0.89) 0.83 (2.66)*** N 398 398 Adj. R2 0.64 0.30 Hausman test H0: RE VS FE Asymptotic test statistics
Chi-square ( 4)= 18.98 P-value=0.00 F (26,37 )= P-value=0.00
Source: Own elaboration.
E
EccoonnRReessGGuuaarrdd 226677 22001122
Table 7 - Fixed Effects and Random Effects: Model [2]
Variables Fixed Effects Random Effects Expected Signs
LnBank -0.36 (-3.16)*** -0.45 (-4.87)*** (-) LnTrade 0.07 (2.22)** 0.02 (0.88) (+) LnSavings 0.54 (2.33)** 0.23 (1.16) (+) LnINF -0.12 (-2.18)** -0.11 (-2.08)** (-) C 0.42 (1.10) 1.06 (3.41)*** N 398 398 Adj. R2 0.60 0.22 Hausman test H0: RE VS FE Asymptotic test statistics
Chi-square ( 3)= 16.06 P-value=0.00 F (26,38 )= P-value=0.00
Source: Own elaboration.
P values are in square brackets; ***/**-statistically significant at the 1, and 5 percent level.
Figure 1: Panel data line plot: Economic growth
-2 -1 0 1 -2 -1 0 1 -2 -1 0 1 -2 -1 0 1 -2 -1 0 1 1990 1995 2000 2005 2010 1990 1995 2000 2005 2010 1990 1995 2000 2005 2010 1990 1995 2000 2005 2010 1990 1995 2000 2005 2010 1990 1995 2000 2005 2010
Austria Belgium Bulgaria Cyprus Czech Republic Denmark
Estonia Finland France Germany Greece Hungary
Ireland Italy Latvia Lithuania Luxembourg Malta
Netherlands Poland Portugal Romania Slovak Republic Slovenia
Spain Sweden United Kindgom
G ro w th time Graphs by country

![Table 5 - GMM-System Estimator : Model [2]](https://thumb-eu.123doks.com/thumbv2/123dok_br/15866903.1087524/8.918.112.667.284.528/table-gmm-system-estimator-model.webp)
![Table 6 - Fixed Effects and Random Effects: Model [1]](https://thumb-eu.123doks.com/thumbv2/123dok_br/15866903.1087524/11.918.106.831.731.923/table-fixed-effects-random-effects-model.webp)
