Todos os direitos reservados.
É proibida a reprodução parcial ou integral do conteúdo
deste documento por qualquer meio de distribuição, digital ou
impresso, sem a expressa autorização do
REAP ou de seu autor.
Overeducation, undereducation and labor
earnings in Brazil: a panel data analysis
Mauricio Reis
Overeducation, undereducation and labor earnings in Brazil: a
panel data analysis
Mauricio Reis
Mauricio Reis
Instituto de Pesquisa Econômica Aplicada Av. Presidente Antonio Carlos, 51 (1409). Rio de Janeiro, RJ, Brazil – 20020-010. (5521)3515-8586
Fax: (5521)3515-8547
1
Overeducation, undereducation and labor earnings in Brazil: a panel
data analysis
Mauricio Reis
Instituto de Pesquisa Economica Aplicada Av. Presidente Antonio Carlos, 51(1409)
Rio de Janeiro, RJ, Brazil – 20020-010 (5521)3515-8586
Fax: (5521)3515-8547 [email protected]
Abstract
This paper estimates the effects of undereducation and overeducation on labor earnings in Brazil. The empirical analysis employs longitudinal data and information provided by job analysts about the schooling required for each occupation, the latter of which is used to classify workers as undereducated, overeducated, or adequately matched. Findings from Brazil do not differ from those reported for developed countries. Even when taking
into account individuals’ fixed effects, evidence indicates that one more year of surplus schooling increases labor earnings, but less than an additional year of required
schooling. Undereducated workers earn more than adequately matched individuals with the same educational level, but less than those adequately matched in similar occupations.
JEL: J24, J31, I21.
2 1 - Introduction
A number of empirical studies analyze the consequences of overeducation and undereducation on individuals’ labor earnings. Evidence for many different countries usually shows that an additional year of schooling beyond that required in the worker’s occupation increases labor earnings, but returns to surplus schooling are smaller than those to required years of schooling. Undereducated individuals normally have lower labor earnings than those adequately matched in similar occupations, but they earn more than adequately matched individuals with the same level of schooling.1
Although the literature on this issue is vast in developed countries, empirical findings for developing countries are still scarce. One exception is the study by Quinn and Rubb (2006) carried out for Mexico, which presents estimates of overeducation and undereducation effects similar to those obtained from developed countries using cross-sectional data. Diaz and Machado (2008), using a sample of selected occupations in Brazil, also report evidence that the estimated returns to schooling are different across match categories. Mehta et al. (2011) argue that the unavailability of data on the number of years of schooling required for each job helps to explain the scarcity of studies in
developing countries. This information allows classifying workers as overeducated, undereducated, or adequately matched.2
This paper investigates the consequences of overeducation and undereducation on earnings in the Brazilian labor market, seeking to contribute to the scarce literature on this issue in developing countries. Information about the required level of education in each occupation is provided by professional job analysts in the Brazilian
Classification of Occupations (Classificação Brasileira de Ocupações, (2010)) –
henceforth CBO – from the Brazilian Ministry of Labor. By making use of that information, it is possible to attribute the education required for the occupation of each employed individual in the dataset.
Evidence in the literature based on panel data shows that overeducation and undereducation estimated effects diminish relative to estimates using cross-sectional data or even disappear when the analysis is controlled for individuals’ unobserved
1
Hartog (2000), McGuinness (2006) and Leuven and Oosterbeek (2011) offer an overview of the main empirical findings.
2
3
heterogeneity.3 Therefore, the empirical analysis in this paper is conducted using
longitudinal data from the Monthly Employment Survey (Pesquisa Mensal de Emprego
- PME) to control for individuals’ fixed effects.
The results reported here indicate that both overeducation and undereducation have significant effects on labor earnings in Brazil. The estimated impacts of surplus and deficit schooling drop substantially when time-invariant fixed effects are taken into account, but still remain significant. Findings suggest that one additional year of surplus schooling increases labor earnings, but this improvement represents half of that associated with one more year of required schooling. Also, according to the results, labor earnings penalty for each additional year of deficit schooling is around half that of the estimated impact for one more year of required schooling.
The remainder of the paper is structured as follows. Section 2 describes the PME dataset, while Section 3 presents the empirical approach. Section 4 contains a descriptive analysis, and Section 5 reports the estimated results relating undereducation
and overeducation to individuals’ labor earnings. The main conclusions of the paper are in Section 6.
2 – Data
This paper uses panel data from the PME, conducted by the Brazilian Census Bureau (IBGE) in the six main Brazilian metropolitan areas. Each household that enters the PME is interviewed for four consecutive months, not interviewed for the next eight months, and interviewed once again for the next four months. The empirical analysis here uses data drawn from the individual’s first PME interview, and from their fifth PME interview, one year later.
In the PME, employed individuals are classified into 54 occupational groups. The Brazilian Ministry of Labor provides detailed descriptions regarding 607 occupations defined at the 4-digit level, according to evaluations from job analysts (Classificação Brasileira de Ocupações, 2010). Using information available for each occupation in the CBO, the required level of education is attributed to each occupation
3
4
in the PME, as explained in more detail in Appendix A4. An individual is classified as
adequately matched if his/her educational level is within the range required by his/her occupation. An individual with more years of schooling than the maximum level required by his/her occupation is classified as overeducated, while an undereducated worker has fewer years of schooling than the minimum required by his/her occupation.
The sample used in this study is limited to individuals who entered the survey between January 2004 and December 2012, aged 25 to 60 years at the time of their first PME interview. The sample is also restricted to those employed with positive hourly labor earnings in both the first and fifth interviews. Military officers, legislators, and senior government officials are excluded from the sample because it is not possible to define a range of required education in these cases. After all those exclusions, the panel data sample has about 150,000 individuals with two observations for each one of them.
3 - Empirical approach
Following the model proposed by Duncan and Hoffman (1981), the first specification used to estimate undereducation and overeducation effects on earnings can
be written as:
(1) 𝑙𝑛(𝑤𝑖𝑡) = 𝛽0+ 𝛽1𝐸𝑖𝑡𝑟 + 𝛽2𝐸𝑖𝑡𝑜 + 𝛽3𝐸𝑖𝑡𝑢 + 𝛿0𝑇𝑡+ 𝑋𝑖𝑡𝛾 + 𝑢𝑖𝑡
where 𝑤𝑖𝑡 is the hourly labor earnings of individual i in period t, 𝐸𝑖𝑡𝑟 is the required amount of education for the job worker i holds in period t, 𝐸𝑖𝑡𝑜 represents years of overeducation, 𝐸𝑖𝑡𝑢 represents years of undereducation, 𝑇𝑡 is a dummy equal to one for observations related to individuals’ fifth PME interview, 𝑋𝑖𝑡 is a vector of individual characteristics, and 𝑢𝑖𝑡 is an error term.
Representing the actual years of schooling by 𝐸𝑖𝑡, 𝐸𝑖𝑡𝑜 is defined as equal to (𝐸𝑖𝑡 − 𝐸𝑖𝑡𝑟) if (𝐸𝑖𝑡 > 𝐸𝑖𝑡𝑟) and equal to zero otherwise, while 𝐸𝑖𝑡𝑢 is equal to (𝐸𝑖𝑡𝑟 − 𝐸𝑖𝑡) if
(𝐸𝑖𝑡 < 𝐸𝑖𝑡𝑟) and equal to zero otherwise. In many occupations, the amount of required
4
5
education varies within a range, as can be seen in Table A.1. In these cases, the number
of years of overeducation is computed through the difference between the individuals’
attained schooling and the highest value attributed to required schooling, whereas the number of years of undereducation is calculated through the difference between the lowest value credited to educational requirement and the workers’ attained level of schooling. Also, in these situations, required schooling in equation (1) is computed through the mean of the highest and the lowest values in the range attributed to the occupation. Vector 𝑋𝑖𝑡 in equation (1) contains the following variables: age, and dummies for gender, race, and region of residence.
The literature emphasizes that undereducated workers may be more able than the others, while less able workers are more likely to be classified as overeducated (Allen and Van der Velden, 2001). As an attempt to address this issue, earnings equations are also estimated including individuals’ fixed effects to control for time-invariant unobserved heterogeneity:
(2) 𝑙𝑛(𝑤𝑖𝑡) = 𝛽0+ 𝛽1𝐸𝑖𝑡𝑟 + 𝛽2𝐸𝑖𝑡𝑜 + 𝛽3𝐸𝑖𝑡𝑢 + 𝛿0𝑇𝑡+ 𝛼𝑖 + 𝑢𝑖𝑡,
where 𝛼𝑖 represents the fixed effect of individual i.
4 – Descriptive analysis
Table 1 presents the summary statistics separately for undereducated, adequately matched, and overeducated workers at the time of their first PME interview. Almost half of the individuals in the sample are classified as adequately matched, while one quarter are undereducated, which is the same proportion of those classified as overeducated.
Table 1 also shows that the mean years of attained schooling is equal to 6.1 among undereducated and equal to 10.7 among adequately matched workers, whereas overeducated individuals completed 12 years of schooling. Also, overeducated workers have 3.3 years more schooling than what is required for their jobs, and the mean years of deficit schooling is equal to 3.7 among undereducated individuals.
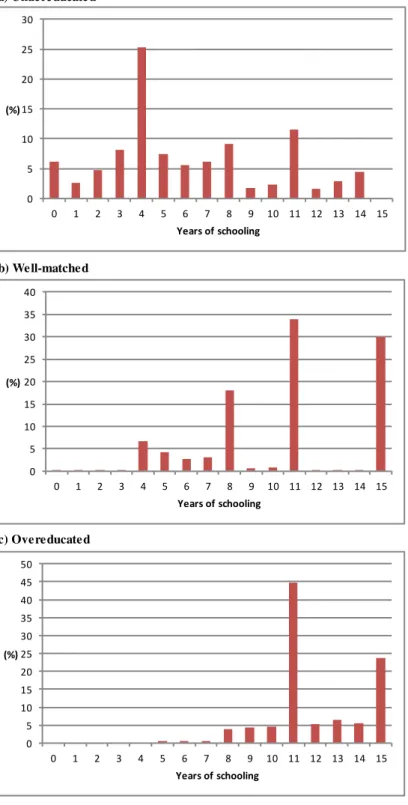
Figure 1 plots the distributions of undereducated, adequately matched, and overeducated workers by years of completed schooling. About two thirds of the
6
most of the workers who attained 7 or less years of schooling are classified as
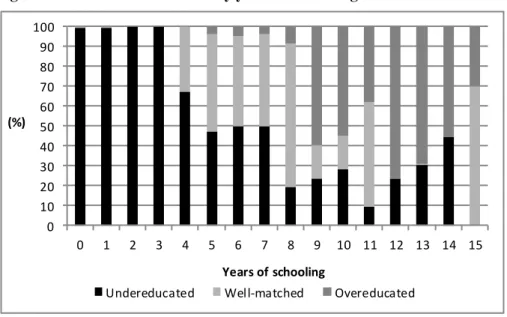
undereducated, in particular those with less than 4 years of schooling. Among adequately matched workers in Figure 1(b), 34% have 11 years of schooling and 30% completed tertiary education (15 years of schooling). More than half of the individuals who completed 11 years of schooling and 70% of those with 15 years of schooling are classified as adequately matched. Regarding individuals classified as overeducated, it can be seen in Figure 1(c) that almost 50% of them have 11 years of schooling and 24% have tertiary education. Among individuals with 11 years of schooling, 38% are overeducated, and the participation of overeducated workers is even higher for those who completed between 12 and 14 years of schooling. Figure 2 also shows that 30% of those with tertiary education are overeducated.
As can be seen in Table 1, mean hourly labor earnings are higher for adequately matched individuals (R$ 59 – US$ PPP 34.5)5. This value is almost two times higher
than the mean hourly labor earnings among undereducated workers, and 33% higher compared to those classified as overeducated. It is also possible to notice that
5
Penn World Table 7.0 for 2009 (Heston et al., 2011).
Table 1: Summary statistics
(1) (2) (3)
Undereducated Adequately matched Overeducated
Years of attained schooling 6,11 10,66 11,97
Age 42,85 40,15 39,08
Female (%) 44,34 42,38 47,51
Black (%) 48,25 37,90 40,01
Years of undereducation 3,65 -
-Years of overeducation - - 3,31
Monthly labor earnings 1276,6 2272,6 1714,6 Hourly labor earnings 31,8 59,3 44,0
Observations 39.585 71.552 38.870
Weighted share (%) 25,77 48,01 26,21 Source: PME.
7
undereducated workers are older than those adequately matched, while overeducated
individuals are the youngest group. The distribution by gender is similar across the three groups reported in Table 1. However, it can be seen that the proportion of black individuals is greater among undereducated than among those classified as adequately matched or overeducated.
Figure 1: Distributions of undereducated, well-matched and overeducated workers by years of schooling
a) Undereducated
b) Well-matched
c) Overeducated
Source: PME.
Note: The sample includes employed individuals aged 25 to 60 years.
0 5 10 15 20 25 30
0 1 2 3 4 5 6 7 8 9 10 11 12 13 14 15
(%)
Years of schooling
0 5 10 15 20 25 30 35 40
0 1 2 3 4 5 6 7 8 9 10 11 12 13 14 15
(%)
Years of schooling
0 5 10 15 20 25 30 35 40 45 50
0 1 2 3 4 5 6 7 8 9 10 11 12 13 14 15
(%)
8
In order to identify the effects of overeducation and undereducation on labor earnings using a fixed effects model, it is important to have sufficient changes in
workers’ educational mismatch status over time.6
Table 2 shows that almost 20% of the workers in the sample changed their mismatch statuses between the first and fifth PME
interview, indicating an intense movement across statuses despite the short time interval. More than one fifth of those previously classified as undereducated become
well-matched or overeducated one year later. Among adequately matched and overeducated workers, 16% and 18% changed their statuses during the one-year interval.
6
Bauer (2002), for example, shows that changes in mismatch status range between 5.3% and 16.2% depending on the way required schooling is defined, and casts doubts on whether educational mismatch effects could be identified using the criteria for which only 5.3% of the individuals changed their statuses over time.
Figure 2: Educational mismatch by years of schooling
Source: PME.
Note: The sample includes employed individuals aged 25 to 60 years.
0 10 20 30 40 50 60 70 80 90 100
0 1 2 3 4 5 6 7 8 9 10 11 12 13 14 15
(%)
Years of schooling
Undereducated Well-matched Overeducated
Table 2: Transitions across educational mismatch status between the first and fifth PME interviews (%)
First PME interview Undereducated Well-matched Overeducated
Undereducated 76.48 17.54 5.98
Adequately matched 5.01 84.03 10.97
Overeducated 4.03 14.32 81.65
Source: PME.
9 5 - Results
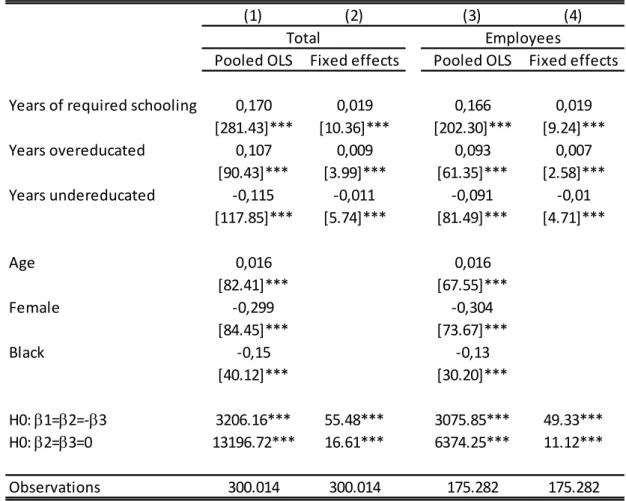
Column (1) of Table 3 reports the results for the pooled OLS model described in equation (1). Estimates show that the coefficient for years of deficit schooling is equal
to −0.115, whereas the number of years of surplus schooling is associated with a positive coefficient equal to 0.107. The estimated coefficient for required schooling is 0.170. Thus, coefficients of the pooled OLS model suggest a substantial premium for each year of surplus schooling and a large earnings penalty for each year of deficit schooling.7
7
Summarizing findings for a number of studies, Leuven and Oosterbeek (2011) show that empirical evidence using OLS models indicates that a year of overeducation increases earnings by 4.3%, which is half that of the estimated impact for required years of schooling, and that the earnings penalty for a year of undereducation is about 3.3%.
Table 3: Estimated earnings effects of undereducation and overeducation
(1) (2) (3) (4)
Pooled OLS Fixed effects Pooled OLS Fixed effects
Years of required schooling 0,170 0,019 0,166 0,019 [281.43]*** [10.36]*** [202.30]*** [9.24]***
Years overeducated 0,107 0,009 0,093 0,007
[90.43]*** [3.99]*** [61.35]*** [2.58]*** Years undereducated -0,115 -0,011 -0,091 -0,01
[117.85]*** [5.74]*** [81.49]*** [4.71]***
Age 0,016 0,016
[82.41]*** [67.55]***
Female -0,299 -0,304
[84.45]*** [73.67]***
Black -0,15 -0,13
[40.12]*** [30.20]***
H0: b1=b2=-b3 3206.16*** 55.48*** 3075.85*** 49.33*** H0: b2=b3=0 13196.72*** 16.61*** 6374.25*** 11.12***
Observations 300.014 300.014 175.282 175.282
Regression in columns (1) and (3) also includes dummies for metropolitan area and a dummy for the individuals' fifth interview. Regressions in columns (2) and (4) contain a dummy for the individuals' fifth PME interview. Robust t-statistics are presented in parentheses.
* Significant at the 10% level, ** significant at the 5% level, *** significant at the 1% level
10 However, taking into account individuals’ fixed effects, the estimated
coefficients fall substantially, as shown in column (2). The estimated impact for each year of surplus schooling on labor earnings drops from 10.7% in column (1) to 0.9% in column (2), whereas the estimated penalty for each additional year of deficit schooling drops from 11.5% to 1.1%. Differences regarding the coefficients in columns (1) and (2) of Table 3 are similar to those found in studies for other countries, underlining the argument that unobserved time-invariant factors play an important role. In spite of the reduction in estimated effects, both undereducation and overeducation coefficients remain statistically significant at the 1% level in the fixed effects model. Table 3 also
reports F-tests of the joint equality b1=b2= -b3, which indicates that years of required
schooling, overeducation and undereducation are rewarded equally. This hypothesis is rejected in all specifications. The hypothesis that only adequately schooling is rewarded
(Thurow, 1975) is also rejected according to tests of the joint equality b2=b3=0.
Findings in column (2) indicate that an additional year of deficit schooling diminishes labor earnings by 1.1% relative to those correctly matched in occupations that require the same level of education. Column (2) of Table 3 also suggests that
undereducated workers earn more than adequately matched individuals with the same educational level. The labor earnings penalty for one year of deficit schooling is around
half the impact for one year of required schooling. For overeducated individuals, estimates indicate that labor earnings increase by 0.9% for each additional year of surplus schooling compared to adequately matched workers in occupations with the same requirement in terms of education. However, according to the results, overeducated individuals earn less than correctly matched workers with the same educational level. The increase in labor earnings associated with a year of surplus schooling represents half of that related to a year of required schooling.
A few studies in the literature exclude self-employed workers from the analysis. The rationale behind this approach is that employees and self-employed workers in the
same occupation may undertake different tasks (Metha et al., 2013; and Glewwe, 2002).
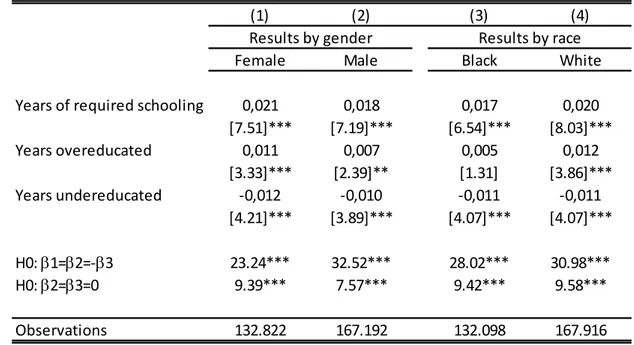
11 Columns (1) and (2) of Table 4 present estimates separately for men and women to investigate whether undereducation and overeducation effects on labor earnings are different by gender, whereas columns (3) and (4) report estimates separately for blacks and whites. According to the results, the undereducation estimated effect is larger for women than for men. Coefficients reported in columns (1) and (2) of Table 4 for years of required schooling and for years of surplus schooling are also larger for women. Regarding the results by race, columns (3) and (4) show that the coefficient for years of required schooling for white workers is larger than the one estimated for black workers. The earnings penalty for a year of undereducation seems to be similar by race, but years of surplus schooling are rewarded for whites but not for blacks. Thus, evidence indicates that improvements in the educational level beyond the requirements of the job do not imply higher labor earnings among black individuals.
Although the fixed effects approach has been proposed in recent studies to address potential biases due to individuals’ unobserved heterogeneity, this method also
has many limitations, as discussed by Leuven and Oosterbeek (2013). An important concern is the presence of measurement errors in educational variables. Thus, much lower impacts using fixed effects may be due in part to attenuation bias as a
Table 4: Estimated earnings effects of undereducation and overeducation by gender and race (Fixed effects model)
(1) (2) (3) (4)
Female Male Black White
Years of required schooling 0,021 0,018 0,017 0,020 [7.51]*** [7.19]*** [6.54]*** [8.03]***
Years overeducated 0,011 0,007 0,005 0,012
[3.33]*** [2.39]** [1.31] [3.86]*** Years undereducated -0,012 -0,010 -0,011 -0,011
[4.21]*** [3.89]*** [4.07]*** [4.07]***
H0: b1=b2=-b3 23.24*** 32.52*** 28.02*** 30.98*** H0: b2=b3=0 9.39*** 7.57*** 9.42*** 9.58***
Observations 132.822 167.192 132.098 167.916
Regressions also includes a dummy for the individuals' fifth interview. Robust t-statistics are presented in parentheses.
* Significant at the 10% level, ** significant at the 5% level, *** significant at the 1% level
12 consequence of measurement errors.8 As Leuven and Oosterbeek (2013) also highlight,
the fixed effects approach controls for unobservable factors that are time-invariant, but job changes could be accompanied by modifications in other unobservable variables as well.9
6 - Conclusion
This paper investigates the effects of undereducation and overeducation on labor earnings in Brazil. The empirical analysis takes advantage from information provided by professional job analysts to compute the educational requirements for each occupation. Findings from Brazil presented in this paper are quite similar to those reported for developed countries in studies that also take into account individuals’ time-invariant unobservable effects.
Empirical evidence indicates that an additional year of surplus schooling increases labor earnings, but this effect seems to be lower than that of an additional year of required schooling. Also, according to the results, a year of deficit schooling is associated with an earnings penalty, although undereducated workers still earn more
than those adequately matched with the same educational level.
Despite the low schooling level of the Brazilian labor force, an important share
of the workers completed more years of schooling than their jobs require. Data reveal, for example, that almost 40% of the individuals who attained 11 years of schooling are classified as overeducated. At the same time, some of the jobs that require 11 years of schooling are taken by less educated workers, suggesting an inefficient allocation of resources. Although overeducation could be a temporary situation for many workers, evidence highlights the importance of improving the quality of schooling in order to provide a better matching between the educational system and labor market needs.
Also, according to the evidence, about one quarter of the workers in the main Brazilian metropolitan areas are undereducated. Two thirds of the undereducated have
8
See also Verhaest and Omey (2012). 9
13
less than 8 years of schooling. This educational level is lower than the minimum
required for performing most of the occupations, and evidence indicates that undereducated workers seem to be less productive than those adequately matched in similar jobs. Thus, investments to increase average years of schooling of the Brazilian labor force and policies to avoid dropout at low levels of education are needed to
14 References
Allen, J. and Van der Velden, R. (2001). Educational mismatches versus skill mismatches: effects on wages, job satisfaction, and on-the-job search. Oxford Economic
Papers 3, 434-452.
Bauer, Thomas (2002). Educational mismatch and wages: a panel analysis. Economics
of Education Review 21, 221–229.
Classificação Brasileira de Ocupações, 2010. Ministério do Trabalho e do Emprego, Brasília, 3ª. edição.
Diaz, M and Machado, L. (2008). Overeducation e Undereducation no Brasil: Incidência e Retornos, Estudos Econômicos, 38(3), 431-460.
Duncan, G. J., and Hoffman, S. D. (1981). The incidence and wage effects of overeducation. Economics of Education Review, 1(1), 75–86.
Glewwe, P. (2002). Schools and skills in developing countries: Education policies and socioeconomic outcomes. Journal of Economic Literature, 40(2), 436–482.
Hartog, Joop (2000). Over-education and earnings: where are we, where should we go? Economics of Education Review 19, 131–147.
Heston, A., Summers, R., Aten, B. (2011). Penn World Table Version 7.0. Center for International Comparisons of Production, Income and Prices. University of
Pennsylvania.
Korpi, Tomas and Michael Tåhlin (2009). Educational mismatch, wages, and wage
growth: Overeducation in Sweden, 1974–2000. Labour Economics 16,183–193.
Leuven, Edwin and Hessel Oosterbeek (2013). “Overeducation and Mismatch in the
Labor Market”. Handbook of the Economics of Education, E. Hanushek and F. Welch
15
McGuinness, Seamus (2006). “Overeducation in the labour market”. Journal of Economic Surveys, 20 (3), 387-418
Mehta, Asshish, Jesus Felipe, Filipinas Quising and Sheila Camingue (2011). Overeducation in developing economies: How can we test for it, and what does it mean?
Economics of Education Review 30, 1334– 1347.
Quinn, Michael and Stephen Rubb (2006). Mexico’s labor market: The importance of
education-occupation matching on wages and productivity in developing countries.
Economics of Education Review 25, 147–156
Thurow, L. (1975). Generating inequality. Basic Books.
Tsai, Yuping. Returns to overeducation: A longitudinal analysis of the U.S. labor Market. Economics of Education Review 29, 606–617.
Verhaest, D. and E. Omey (2012). Overeducation, Undereducation and Earnings:
16 Appendix
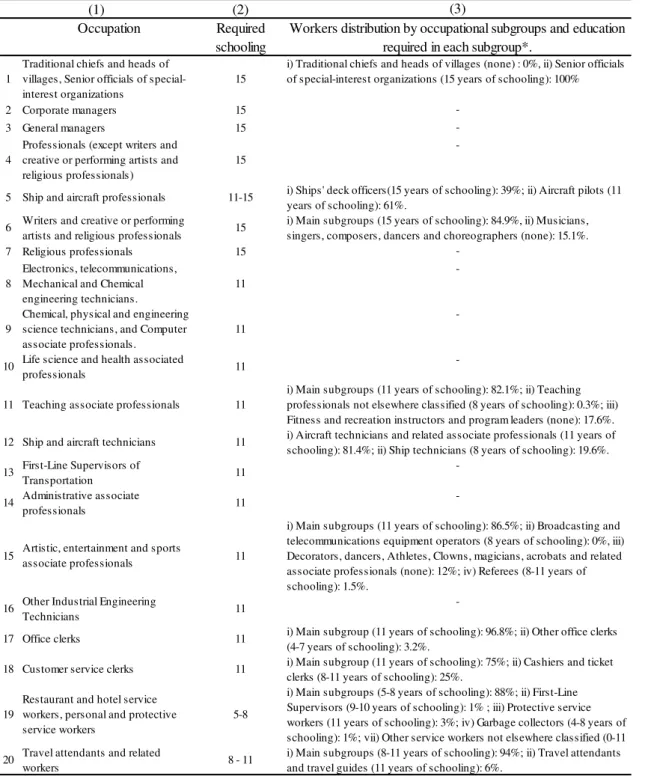
The CBO, from the Brazilian Ministry of Labor, offers a detailed description of 607 occupations defined at the 4-digit level. The competencies needed for each specific job are based on the analysis provided by a panel of 8 to 12 experts. By making use of this information, it is possible to get the educational level workers must have to perform the tasks in their jobs.
The PME classifies employed individuals into 54 occupational groups. An occupation in the PME usually aggregates many different occupations defined in the
CBO. In many cases, the required education is the same for all CBO occupations in a given PME occupational group. In these cases, the required level of education in the
CBO categories is attributed to the corresponding PME code. Fifteen PME occupations are classified in this way. In other four PME occupations, required education is defined according to a range of the number of years of schooling in the corresponding CBO category.
Many aggregated occupational groups in the PME comprise CBO codes with different levels of required education. In these situations, the distribution of workers by disaggregated groups of the PME occupation is calculated using the 2000 Brazilian Census data. Then, the following criteria are adopted to compute the required years of schooling:
i) For 19 PME occupations, the main disaggregated groups comprise more than 75% of the workers and their required educational level is attributed to all individuals in the same PME aggregated group,
ii) There are occupations in the PME containing disaggregated groups for which not only requirements in terms of education are different, but they also have a more equal distribution in the aggregated occupational group. In these 10 cases, the required educational level is defined in terms of a range including at least 75% of the workers in disaggregated groups with required education between the lowest and the highest values attributed to the aggregated occupational group.
Table A.1 presents the level of required education for 48 occupations in the
17
Legislators and senior government officials are also excluded because the CBO does not
define a requirement in terms of years of schooling for the tasks in these types of jobs. For each occupation described in column (1), Table A.1 provides the required educational level assigned to it (column 2), whereas column (3) reports the workers’ distribution by occupational disaggregated groups according to the 2000 census, and the level of schooling required in each one of these disaggregated groups.
Table A.1: Required educational level by occupation
(2) (3)
Occupation Required schooling
Workers distribution by occupational subgroups and education required in each subgroup*.
1
Traditional chiefs and heads of villages, Senior officials of special-interest organizations
15
i) Traditional chiefs and heads of villages (none) : 0%, ii) Senior officials of special-interest organizations (15 years of schooling): 100%
2 Corporate managers 15
-3 General managers 15
-4
Professionals (except writers and creative or performing artists and religious professionals)
15
-5 Ship and aircraft professionals 11-15 i) Ships' deck officers(15 years of schooling): 39%; ii) Aircraft pilots (11 years of schooling): 61%.
6 Writers and creative or performing
artists and religious professionals 15
i) Main subgroups (15 years of schooling): 84.9%, ii) Musicians, singers, composers, dancers and choreographers (none): 15.1%.
7 Religious professionals 15
-8
Electronics, telecommunications, Mechanical and Chemical engineering technicians.
11
-9
Chemical, physical and engineering science technicians, and Computer associate professionals.
11
-10 Life science and health associated
professionals 11
-11 Teaching associate professionals 11
i) Main subgroups (11 years of schooling): 82.1%; ii) Teaching professionals not elsewhere classified (8 years of schooling): 0.3%; iii) Fitness and recreation instructors and program leaders (none): 17.6%. 12 Ship and aircraft technicians 11 i) Aircraft technicians and related associate professionals (11 years of schooling): 81.4%; ii) Ship technicians (8 years of schooling): 19.6%. 13 First-Line Supervisors of
Transportation 11
-14 Administrative associate
professionals 11
-15 Artistic, entertainment and sports
associate professionals 11
i) Main subgroups (11 years of schooling): 86.5%; ii) Broadcasting and telecommunications equipment operators (8 years of schooling): 0%, iii) Decorators, dancers, Athletes, Clowns, magicians, acrobats and related associate professionals (none): 12%; iv) Referees (8-11 years of schooling): 1.5%.
16 Other Industrial Engineering
Technicians 11
-17 Office clerks 11 i) Main subgroup (11 years of schooling): 96.8%; ii) Other office clerks (4-7 years of schooling): 3.2%.
18 Customer service clerks 11 i) Main subgroup (11 years of schooling): 75%; ii) Cashiers and ticket clerks (8-11 years of schooling): 25%.
19
Restaurant and hotel service workers, personal and protective service workers
5-8
i) Main subgroups (5-8 years of schooling): 88%; ii) First-Line Supervisors (9-10 years of schooling): 1% ; iii) Protective service workers (11 years of schooling): 3%; iv) Garbage collectors (4-8 years of schooling): 1%; vii) Other service workers not elsewhere classified (0-11 20 Travel attendants and related
workers 8 - 11
i) Main subgroups (8-11 years of schooling): 94%; ii) Travel attendants and travel guides (11 years of schooling): 6%.
19 Table A.1: (continued)
Occupation Required schooling
Workers distribution by occupational subgroups and education required in each subgroup*.
21 Housekeepers and related workers 8
-22 personal care, Hairdressers, barbers,
beauticians and related workers 4-7
i) Main subgroups (4-7 years of schooling): 85%; ii) Bleaching-, dyeing- and cleaning-machine operators (8 years of schooling): 15%.
23 Sales associate professionals 12-15
-24 Shop salespersons and
demonstrators 8-11
-25 Parts Salesperson 8-11
-26 Installers 4
-27 Street vendors 4
-28 Agricultural and market-oriented
animal producers 4-7
-29 Agricultural and market-oriented
animal workers 4
i) Main subgroups (4 years of schooling): 97%, ii) First-Line Supervisors of Farming Workers (8 years of schooling): 3%.
30 Fishery workers, hunters, trappers,
and forestry and related workers 0-4
i) First-Line Supervisors of Fishing, and Forestry Workers (11 years of schooling): 1%; ii) Fishery workers, hunters and trappers, Forestry workers (0-4 years of schooling): 99%.
31 Motorized farm and forestry plant
operators 0-4
i) Agriculture plant operators (0-4 years of schooling): 98.5%; ii) Forestry plant operators (8 years of schooling): 1.5%.
32 Extraction and building trade
workers 4 - 8
i) First-Line Supervisors of Construction Trades and Extraction Workers (11 years of schooling): 4%; ii) Miners (5-8 years of schooling): 1%; iii) Main subgroups (8 years of schooling): 69%; iv) Well drillers and borers, building and related electricians (11 years of schooling): 9%; v) Concrete placers, concrete finishers and related workers, carpenters and joiners (4-7 years of schooling): 17%; vi) Insulation workers (4 years of
33 Metal workers 8-11
i) Main subgroups (8 years of schooling): 73%;
ii) Mechanical-machinery assemblers (11 years of schooling): 8%;iii) Machine-tool operators (11 years of schooling): 2%; iv) Metal melters, casters and rolling-mill operators (7 years of schooling): 1%; v) Plumbers and pipe fitters (4-7 years of schooling): 10%; vi) Welders and flamecutters, Riggers and cable splicers (4 years of schooling): 2%; vii) Other mechanical-machinery assemblers (9-10 years of schooling): 3%. 34 Electrical and electronic installers
and assemblers 8-11
i) Main subgroups (11 years of schooling): 69.5%; ii) Electrical line installers, repairers and cable jointers (8 years of schooling): 31.5%. 35
Precision-instrument makers and repairers, and Musical instrument makers and tuners.
11
-36 Jewellery and glass, ceramic workers 4-8
i) Glass, ceramics and related decorative painters (11 years of schooling): 6%; ii) Jewellery and precious-metal workers (9-10): 0%; iii) Glass makers, cutters, grinders and finishers (8 years of schooling): 58%; iv) Abrasive wheel formers, potters and related workers (4-7 years of schooling): 36%.
37 Textile-products and
leather-products machine operators 8
i) Main subgroups (8 years of schooling): 76.5%; ii) Fiber preparers, Printing-machine operators (11 years of schooling): 10%; iii) Pelt, leather and shoemaking trade workers (4 years of schooling): 9%; iv) Textile Cutting Machine Setters, Operators, and Tenders (4-7 years of schooling): 3.5%; v) Other textile workers (none): 1%.
38 Wood treaters and wood-products
machine operators 8
i) Main subgroups (8 years of schooling): 96.5%; ii) Wood-products machine operators (11 years of schooling): 1.5%; iii) Basketry weavers, brush makers and related workers (4 years of schooling): 2%.
39
Drivers and mobile-plant operators, transport workers and freight handlers and Hand packers
4-8
i) Main subgroups (8 years of schooling): 63.3%; ii) Locomotive-engine drivers and other machine operators and assemblers (11 years of schooling): 1.3%; iii) Industrial-robot operators (12-14): 0%; iv) Lifting-truck operators, and Assembling labourers (4 years of schooling): 23.2%; v) Drivers of animal-drawn vehicles and machinery, and Freight
40 Chemical products plant and
machine operators 8-11
i) Chemical-processing-plant operators, Pharmaceutical- and toiletry-products machine operators , First-Line Supervisors of chemical products workers (11 years of schooling): 34.5%; ii) First-Line Supervisors of pharmaceutical products workers (15 years of
schooling): 0%; iii) Crushing-, grinding- and chemical-mixing-machinery operators, Rubber- and plastic-products machine operators,
20 Table A.1: (continued)
Occupation Required schooling
Workers distribution by occupational subgroups and education required in each subgroup*.
41 Metal processing plant operators 8-11
i) Main subgroups (11 years of schooling): 37%; ii) Ore and metal furnace operators, Metal melters, casters and rolling-mill operators (8 years of schooling): 50%; iii) Cement and other mineral products machine operators (4-8 years of schooling): 13%.
42 Pulp and papermaking plant
operators 8-11
i) Main subgroups (11 years of schooling): 64%; ii) Paper-products machine operators (8 years of schooling): 36%.
43 Food Processing Workers 8
i) Food preparers (11 years of schooling): 6%; ii) Main subgroups (8 years of schooling): 93%; iii) Sugar production machine operators (none): 0.5%; iv) Tobacco production machine operators (9-10 years of schooling): 0.5%; v) Tobacco preparers (4 years of schooling): 0%. 44 Power-production and related plant
operators 11
-45
Other machine operators and assemblers, and manufacturing elementary workers.
8
i) Gas Plant Operators (11 years of schooling): 0.8%; ii) Steam-engine and boiler operators (9-11 years of schooling): 4.2%; iii) Water-treatment plant operators (5-11 years of schooling): 1%; iv) Air conditioning and refrigeration mechanics (8 years of schooling): 1%; v) Manufacturing elementary workers (8 years of schooling): 93%.
46 Mechanics, Installers, and Repairers 8-11
i) Main subgroups (8 years of schooling): 74%; ii) Machinery mechanics and fitters (11 years of schooling): 24%; iii) Bicycle and related repairers (5-7 years of schooling): 2%.
47 Electrical and Electronics Repairers 8
i) Security and Fire Alarm Systems Installers, Elevator Installers and Repairers, Office Machine Repairers (11 years of schooling): 11%; ii) main subgroups (8 years of schooling): 89%.
48 Other maintenance Workers 11
i) Main subgroups (11 years of schooling): 98.2%; ii) OtherMaintenance Workers (4-7 years of schooling): 0.7%, iii) Highway Maintenance Workers (4-7 years of schooling): 1.1%.