The Monsanto Equation:
Is Bayer’s acquisition plan adding up?
Case Study
D
EBORAM
EINERSThesis submitted for the Degree of Master in Finance
at Universidade Nova de Lisboa
School of Business and Economics Supervised by
Prof. José Neves de Almeida
The Monsanto Equation:Is Bayer’s acquisition plan adding up?
On a spring day on 23rd March 2016, Werner Baumann, who had just become CEO of Bayer AG 23 days earlier, sent out a letter comprising of what could become the largest acquisition ever done in the history of German companies. He had just released Bayer’s all-cash offer to acquire Monsanto for a total price of $62bn to create a global leader in the agrochemical business. While Monsanto is by far the world’s largest player in the seed business with 36% global market share in 2015 and particularly successful in the American market, Bayer is leading in several areas of the crop protection market with 18% market share and main focus in Europe. With the transaction completed, a mega player in the industry would emerge which could easily dwarf its remaining competitors.
About half a year and a lengthy bidding process later, the Monsanto Board of Directors finally agreed upon Bayer’s all-cash offer of $128 per share which values the company at $66bn. What was striking, however, was that after the day of the announcement, Monsanto’s share price dropped almost 5% to $101.08 instead of rising closer to the agreed upon takeover price as empirical evidence shows in takeover scenarios (Berk & DeMarzo, 2014).
General overview of the Agrochemical Industry
Generally, the agrochemical industry can be sub-divided into the two clusters crop protection (herbicides, fungicides, etc.) and seed business. While most companies engage in both categories, in terms of annual sales in 2015, Syngenta is with $10bn industry leading in the first and Monsanto with $10.2bn in the second category.
In 2015, global sales of crop chemicals, excluding seed businesses, summed up to $50bn with North and South America representing the largest market with a share of 45%, followed by Asia in the second place with 24%, and Europe in third with a 15% share (Exhibit 1). Global sales of seeds added another $29bn in sales to the agrochemical industry.
Growth in this industry is mainly driven by an increasing demand for food due to rising population, changing diets and the scarcity of land available for cultivation, as well as an increasing awareness of the benefits of crop protection methods. Next to these macro drivers, there are several micro factors that influence the crop protection and seed business. These range from weather conditions such as droughts or floods to crop prices as well as available acreage which play a significant role in farmers’ spending.
From 1961 to 2011, the number of people supported by one hectare land rose from 2.2 to 5. While in this period population grew by 130%, arable land only increased by 9% which highlights a clear demand for a more efficient cultivation system. The world population is expected to grow another 30% by 2050, indicating still a substantial growth however at a reduced pace (Bloomberg, 2016).
In terms of structure, the industry is led by a few big players of which, in 2015, the three largest companies with respect to sales were responsible for around 50% of total sales worldwide ( Exhibit 2).
As the recent M&A wave implies, the agrochemical business is facing several challenges. Sales in the industry have begun slowing down already in the 1980s. Furthermore, in 2016, corn and soybean prices have declined for the third succeeding year as a result of healthy crops and strong harvests especially in the Americas (Phillips McDougall , 2015). Consequently, farmer’s spending ability has declined and more and more customers moved to generic products. This, as well as heavy price pressure from competitors, had a depressing effect on glyphosate1 prices,
which is one of the main and most relevant agrochemical products, especially for Monsanto. Headwind is also expected from depreciating currencies in key markets such as Brazil and Argentina.
Furthermore, particularly in the North and South American market, another new challenge has
emerged due to an increasing number of glyphosate-tolerant weeds and grasses as a result of the constant reapplication of one and the same product over the years (Phillips McDougall , 2015).
These factors and the lack of growth opportunities in the agrochemical industry have led to a significant amount of company consolidation in the previous decade. The most recent and prominent ones to mention have been the $130bn merger of DuPont and Dow Chemical, as respectively 4th and 6th largest agrochemical companies in the world in terms of sales, as well as the recent $43bn acquisition of industry leader Syngenta by ChemChina (Fontanella-Khan & Massoudi, 2016).
The Players
After the two M&A announcements of ChemChina and Syngenta as well as Dow and DuPont, the industry was left with three major players still to react: BASF, Bayer and Monsanto. With this shift in the competitive landscape of the industry, the remaining three companies found themselves in a difficult situation: The player who is making the last move and is likely to stand alone in the market will possibly lose its importance in the market due to comparative disadvantage in terms of market share and immense margin pressure due to the sheer size of the other competitors.
BASF
Headquartered in Ludwigshafen, the German company BASF is the largest chemical company in the world in terms of sales with around €70bn in 2015 (BASF, 2015). Its portfolio is diversified into the five sectors Oil & Gas, Chemicals, Performance Products, Functional Materials and Agricultural Solutions. Overall, in 2015, BASF’s agricultural division makes up 9% of the company’s portfolio in terms of sales, however 17% in terms of EBIT (BASF, 2015). In the global market for crop protection, the company ranks 3rd in terms of sales among its
operates research facilities for genetically modified products as well, there is currently no revenue generated from any kind of seed business. The company strongly focuses on fungicides and herbicides with 43% and 37% respectively in terms of overall crop protection sales. The remaining 20% are a result of insecticide operations and functional crop care (biological crop protection, seed treatment etc.) (BASF, 2015).
In the past two years, the company has been struggling as a result of depressed oil prices. In 2015, BASF’s Chemical as well as Oil & Gas segment, which make up 49% of the total EBITDA, have recorded substantial losses and suffered from a 14% decrease in sales, while the Agrochemicals on the other hand increased by almost 7%. Expanding the agro sector would make strategic sense for BASF in order to balance the dependency on global oil prices. The company has allegedly been working on a takeover bid for Syngenta before the ChemChina acquisition announcement. Due to investor’s expectations for the company to make a move, and as BASF also has a long history of close collaboration with Monsanto, it has been rumored that the company’s board of directors evaluates a potential acquisition offer.
Bayer
The Leverkusen-based company with annual sales of €47bn in 2015 was initially focused on the chemicals sector, but is known today as major pharmaceutical company. In 2014, the company then decided to exclusively focus on its LifeScience business by spinning off its MaterialScience unit into a separate company which today operates and trades under the name Covestro (Phillips McDougall , 2015). By focusing their operations on LifeSciences, Bayer diversified its portfolio into the non-cyclical, high-risk pharmaceutical business as well as in the very cyclical, low-risk agricultural business.
Besides the crop protection business, Bayer’s CropScience unit includes an Environmental Science unit as well as a seed and Genomics business. As of now, the latter only represents a small share of Bayer’s CropScience activities. However, the company has taken several
(Phillips McDougall , 2015).
For Bayer, the Monsanto integration would not only mean that they could create a global leader in the agrochemical industry, but also narrow the gap between them and their major German rival BASF in terms of sales and profitability.
Monsanto
The St.-Louis based Monsanto is a multinational agrochemical company with main focus in the plant biotechnology sector and annual sales of $15bn in 2015. The company can be divided into the two sectors Seeds and Genomics as well as Agricultural Productivity (crop protection), which respectively make up 74% and 26% of total sales in 2015 (Exhibit 5.7) (Monsanto, 2015). The invention and the market development of the non-selective herbicide glyphosate, which is marketed under the name Roundup, resulted in major economic benefits for the company. In the 1980s, Monsanto started to invest into its seed business which led to an extensive product portfolio of glyphosate tolerant and/or insect resistant crops, which are marketed as Roundup Ready (Phillips McDougall , 2015).
In the past years, Monsanto’s performance has been struggling due to a fourth straight annual decline in U.S. farmers’ incomes, the immense depreciation of Brazilian real as well as an increase in competition (Exhibit 5.3 & 5.4) (Prella & Minder, 2016). In 2000, Monsanto lost its remaining outstanding glyphosate patents which in turn resulted in an increased amount of producers. This ultimately led to oversupply in the market and margin decline due to the introduction of generic products.
In their Seeds and Genomics business, however, Monsanto is still leading in the market and benefits from a long history of successful R&D. An example for this is the trait DroughtGuardTM which is the world’s only drought-tolerant corn seed (Monsanto , 2017). This is a particular advantage in terms of sales when weather phenomena such as La Niña which are expected to bring droughts to South America in 2017 (Sullivan, 2016).
of its newly launched Intacta RR2Pro and Roundup Ready 2 Xtend soybeans which both experienced rapid growth in FY 2016 (Monsanto, 2016). Overall revenue however still faces some headwind as a result of depressed farmers spending as well as continuing depreciating currencies in key markets. According to the U.S. Department of Agriculture, crop prices are expected to continue to decline until the end of 2016, then slowly picking up again in 2017 until 2020 (Exhibit 5.4) (USDA, 2016).
Deal Timeline
After rumors emerged on 19th May 2016 that BASF as well as Bayer were interested in
acquiring Monsanto, the market reacted by a substantial decline of 5% of the Bayer share, an almost 11% increase in the Monsanto share while barely showing any movement of the BASF share, indicating that a takeover scenario by Bayer seems most probable (Exhibit 7.2) .
May 16 Bayer offers to acquire Monsanto to create a global leader in agrochemicals for $122 per share all-cash offer, valuing Monsanto at $63bn on 23rd May. Monsanto announces openness to deal however rejects offer as inadequate. Additional clarification on financing and regulatory matters are required.
Jul 16 Bayer increased all-cash offer to $125 per share, representing a 40% premium from Monsanto’s closing price before the first rumors emerged.
Jul 16 Monsanto repeatedly rejects offer from Bayer as financially inadequate.
Aug 16 Bayer reviews Monsanto’s financial accounts to justify a revised offer with a raised bid. Option for hostile takeover has not been ruled out.
Sep 16 Bayer revises offer to $127.50 per Monsanto share. Bid is still below the hurdle of $149 a share needed to match the EV/EBITDA multiple that ChemChina is paying for Syngenta.
Sep 16 Bayer revises offer to $128 per Monsanto share valuing the company at $66bn including net debt. This represents a 44% premium of Monsanto’s share price one day before the offer announcement and values the company’s equity at $57bn. Monsanto’s board of directors
Benefits of the Deal
Bayer CEO Werner Baumann (2016) believes in five major benefits of the deal.
First of all, the assimilation of Monsanto would balance Bayer’s overall product portfolio from a 70/30 healthcare to crop science ratio to approximately 50/50.
Second, the agrochemical sector offers Bayer an attractive low risk industry that is benefitting from inevitable macro trends such as the population growth and consequently the immense increase in the number of people that need to be supplied per hectare of land.
Third, in terms of global sales among industry leaders the combined companies would by far be leading with projected 30% higher sales than any of its competitors.
Fourth, Bayer’s and Monsanto’s product portfolios are almost ideally for a merger scenario. Instead of creating a monopoly in a certain sector, in which case the transaction would most certainly be blocked by anti-trust agencies, the two companies align with only very little overlap. The few existing overlays, especially in the herbicide sector, could be divested in order for the deal to go through. With this acquisition, Bayer expands and diversifies its agribusiness in all areas of the crop chemicals market, including crop protection, seed business as well as digital farming.
Last but not least, the timing of the deal plays an important role. With the recent rapid market consolidation in the agrochemical world, Bayer has been under pressure to make a move in order to stay competitive in the market. As Bayer has obliterated all its chemical operations except for its LifeScience division, the company is much more dependent on a profitable agribusiness than its more diversified competitors.
Challenges of the Deal Antitrust regulations
All mergers and acquisitions have to be approved by regulators in order to prevent the creation of monopolies that could threat the competition in the market. Theoretically, takeovers need to
however, the most important jurisdictions are Europe and the United Sates. Owing to the vast impact on the countries and Monsanto’s market share, also the authorities in Brazil and China are not to be neglected in this deal (Lynch & Cazan, 2016). Before the actual acquisition can occur, Bayer needs to have government approval by these authorities (DeMarzo & Berk, 2014). Due to the substantial size and market share of the two companies, the regulatory approval of the deal sows seeds of doubt among investors. As a consequence, instead of rising, Monsanto’s share price fell by almost 6% after the acquisition agreement in September 2016.
In 2007, Monsanto intended to acquire the large cotton seed producer Delta & Pine Land Company. The acquisition has been refused by US antitrust authorities until Monsanto divested the Stoneville Pedigreed Seed Company, which is a similar enterprise. The buying party at the time happened to be no other than Bayer. Nine years later investors wonder whether the Monsanto-Stoneville reunion could pose a potential threat on the completion of the deal (Lynch & Cazan, 2016).
Ever since however, the agrochemical industry underwent several changes of which most notably has been the consolidation of some of the largest players, reducing the amount of six major players into three or four.
While Bayer is big in crop protection and the European market, Monsanto focuses on seeds and related biotechnology mainly in the American market (Fehler! Verweisquelle konnte nicht
gefunden werden.). For this reason, Bayer executives argue that overlaps between the two
companies are minimal and that concerns were resolvable with divestures (Exhibit 4). Furthermore, Bayer promised to pay a break-up fee of $2bn in case the deal gets rejected due to anti-trust reasons (Bayer, 2016).
Monsanto’s image
For more than two decades, Monsanto has been the number 1 producer of seeds and biotechnology traits that help farmers control unforeseen environmental factors that could
protection chemicals made the company the main target for activists who claim Monsanto’s products pose a serious threat to the human health as well as on the natural evolution process of plants. On top of that, Monsanto has been blamed amongst others for legal tactics used to file for patents, suicides of farmers as well as for the decline of certain species such as the monarch butterfly (Skerritt, 2016).
Even though the company rejected the criticism and none of the studies could prove any health risk of genetically engineered crops as well as Monsanto’s glyphosate, the company’s reputation maintained its bad image (Serafino & Kirchfeld, 2016). In 2015, Monsanto got ranked by the Harris Poll’s as the 4th most hated company in the U.S., ranked worse than BP (No. 11) and
Halliburton (No. 5) who have been involved in the Deepwater Horizon Oil Spill (Otani, 2015). Bayer’s current CEO, Werner Baumann, is confident that this bad image vanishes after the merger has been completed. In an interview (2016) he said that “Bayer’s name and Bayer’s reputation stands for science, innovation and an utmost level of responsibility for societal needs, and that is what we are going to leverage on, also for the combined company going forward.” The idea is, as Bayer has done in previous mergers, to erase Monsanto’s brand name with the completion of the deal (Baumann, 2016). Besides, other companies in the seed business such as Bayer itself do not seem to be in the crossfire of negative publicity. Bayer actually seems to be quite the contrary to Monsanto as it enjoys a great reputation among the general public as it has just been voted as one of America’s most reputable companies (Bayer, 2015).
Financing
To complete the deal as soon as possible, Bayer secured a bridge financing for $57bn initially committed by five major banks, before being distributed to a larger syndicate. For the permanent financing, Bayer announced to employ a combination of debt and equity. The planned equity component amounts to $19bn which will be raised with the help of $4bn mandatory convertible bonds (issued on 11/09/16) as well as through a rights issue. With this
granted authorized capital (Exhibit 9) (Authorized Capital, §§ 202-206 AktG). This was a strategic move by Bayer in order to avoid a shareholder’s vote. This would, according to the German law, require a majority of 75% of the shareholders voting in favor of the transaction (Bayer , 2015). Due to Monsanto’s image and a large amount of activist investors, this vote could have caused a serious threat for the transaction.
In addition, the low interest rate environment and Bayer’s creditworthiness (long-term rating: Moody’s A3, S&P A-) are also beneficial and enable a large amount of debt financing.
On the contrary, Bayer’s current market cap sums up to $81bn and issuing $38bn of debt plus adding Monsanto’s indebtedness will change the financial risk profile of the company. Moreover, also Monsanto’s balance sheet records a high amount of net debt due to a recent $10bn share repurchasing program. All three major rating agencies (Moody’s, S&P, Fitch) have announced to likely downgrade Bayer one or two notches in case the transaction goes through.
Conclusion
Looking at the market reaction after the announcement of the deal and the lack of trust of investors that the deal will actually go through, Baumann was wondering whether this has actually been the right strategic move to make. He was thinking to himself whether the bidding process and the ultimate price for Monsanto were too aggressive due to the fear that BASF could have made the move. Will Bayer even be able to raise enough money to finance the transaction? How can we convince our shareholders to provide us with the necessary increase in equity and how would this affect our stock price?
More profoundly, was this the right decision to make given the current situation of the market or would there have been alternatives that we didn’t consider? How will our competition react? Was the timing right to enter into this agreement? With all the other M&A activities and the low interest rate environment, acquisition premiums may be quite considerable. What other risks have not been considered yet? All these challenges will impose a substantial strain on Bayer’s
business. On the other hand, if we had waited, even fewer attractive acquisition targets would have been available for Bayer.
Appendices Exhibit 1
Exhibit 2
Exhibit 3
2015 Pro Forma Sales (€bn)
Source: Bayer Presentation, May 23, 2016
North America 20% South America 25% Europe 25% Asia Pacific 24% Rest of the World 6% $0 $5 $10 $15 $20 2014 2015 2014 2015 2014 2015 2014 2015 2014 2015 2014 2015
Syngenta Bayer BASF Dow Monsanto DuPont
Milliar
d
en
Leading 6 Companies: Sales Development Crop Protection vs Seed Business
Crop Protection Seeds
0,8 1,1 1,6 2,9 6,5 10,2 Env. Science SeedGrowth Insecticides Fungicides Herbicides Seeds & Traits
Bayer Monsanto
Leading Companies by Region (In terms of sales) Agrochemical Market Size by Region
0 10 20 30 Monsanto & Bayer DuPont & Dow Syngenta & ChemChina BASF bi ll io n Seeds Crop
(Source: Bayer & Monsanto Annual Report, 2013-2016) EXHIBIT 4.1 Balance Sheet Monsanto & Bayer
€/$ million
In Millions of EUR except Per Share 2013 2014 2015 2013 2014 2015 2016 12/31/2013 12/31/2014 12/31/2015 08/31/2013 08/31/2014 08/31/2015 08/31/2016 Assets
Cash and cash equivalents 1,662 1,853 1,859 3,922 2,407 3,748 1,736
Trade and other receivables 7,569 9,097 9,933 1,715 2,014 1,636 1,926
Inventories 7,129 8,478 8,550 2,947 3,597 3,496 3,241
Other short-term assets 2,094 2,407 3,016 1,469 1,558 1,668 1,221
Derivative & hedging assets 574 392 463 24 99 77 33
Total Current Assets 19,028 22,227 23,821 10,077 9,675 10,625 8,157 Property and equipment 28,455 31,319 33,540 9,491 10,357 10,428 11,116 Accumulated depreciation (18,440) (19,891) (21,165) (4,837) (5,275) (5,455) (5,885) Long-term receivables - - - 237 92 42
-Goodwill 9,862 15,347 16,096 3,520 4,319 4,061 4,020 Other intangible assets 8,914 15,653 15,178 1,226 1,554 1,332 1,125 Deferred tax assets 1,596 3,802 4,679 454 450 277 613
Derivative & hedging assets 191 92 63 - 31 8 4
Investments in affiliates 203 223 246 - - -
-Misc long-term assets 1,508 1,462 1,459 496 715 602 586
Total Assets 51,317 70,234 73,917 20,664 21,918 21,920 19,736 Liabilities and equity Accounts payable 4,574 5,808 6,868 995 1,111 836 1,006 Short-term debt 3,324 3,080 2,823 51 233 615 1,587 Deferred revenue - - - 517 438 370 568
Derivatives & hedging 117 296 598 93 23 61 69
Income Taxes Accrued/Payable - - - 91 99 234 41
Accrued marketing programs - - - 1,078 1,394 1,492 1,736 Dividends Accrued/Payable - - - 228 239 254 237
Grower Production Accruals - - - 60 54 39 45
Accrued Compensation & benefits - - - 492 500 304 239
Customer Payable - - - 12 82 72 104
Restructuring Reserves - - - - - 170 246
Misc short-term liabilities 6,008 6,319 6,691 719 939 730 851
Total Current Liabilities 14,023 15,503 16,980 4,336 5,112 5,177 6,729 Long-term debt 5,396 18,136 16,346 2,061 7,465 8,429 7,453 Pension liabilities 7,368 12,236 10,873 357 345 336 371
Deferred revenue - - - 138 47 47 35
Deferred tax liabilities 1,193 689 826 469 509 340 68
Derivatives & hedging 194 348 167 - - -
-Misc. LT Liabilities 2,339 3,104 3,280 575 526 586 535 Common stock 2,117 2,117 2,117 6 6 6 6 Paid-in capital 6,167 6,167 6,167 10,783 10,003 11,464 11,626 Treasury stock - - - (4,140) (10,032) (12,053) (15,053) Retained earnings 14,817 12,974 16,581 7,188 9,012 10,374 10,763 Other equity (2,383) (1,152) (600) (1,278) (1,114) (2,801) (2,808) Minority/Noncontrolling interest 86 112 1,180 169 39 15 11 Total liabilities & equity 51,317 70,234 73,917 20,664 21,918 21,920 19,736
(Source: Bayer & Monsanto Annual Report, 2013-2016)
(Source: Monsanto Annual Report, 2016-2013) EXHIBIT 4.2 Income Statement Monsanto & Bayer
€/$ million
In Millions of EUR except Per Share 2013 2014 2015 2013 2014³ 2015² 2016¹
12/31/2013 12/31/2014 12/31/2015 08/31/2013 08/31/2014 08/31/2015 08/31/2016 Revenue 40,817 41,754 46,936 14,861 15,855 15,001 13,502
Cost of goods sold (19,516) (19,909) (21,158) (7,208) (7,281) (6,819) (6,485)
Depreciation & amortization 2,896 2,920 3,333 615 691 716 727
Selling, general & administrative (12,135) (12,335) (14,402) (2,550) (2,751) (2,686) (2,833) Research & development (3,406) (3,537) (4,281) (1,533) (1,725) (1,580) (1,512) EBIT 5,760 5,973 7,095 3,570 4,098 3,916 2,672 Interest expense (602) (618) (752) (172) (248) (433) (436)
Interest Income 257 283 297 92 102 105 74
Other non-operating income (loss) (334) (646) (550) (61) (101) (34) (22)
Abnormal gains (losses) (874) (578) (845) - (24) (393) (297)
Earnings before taxes 4,207 4,414 5,245 3,429 3,827 3,161 1,991 Income tax (1,644) (1,305) (2,258) (789) (1,123) (1,152) (667)
Deferred income tax 623 234 1,031 (126) 45 288 (28)
Earnings from continuing operations 3,186 3,343 4,018 2,514 2,749 2,297 1,296 Discontinued operations - 100 80 11 13 28 17
Minority interest 3 (17) 12 (43) (22) (11) 23
Net Income 3,189 3,426 4,110 2,482 2,740 2,314 1,336 Share price 100.00 € $ 102.42 Shares outstanding 826,947,808 438,178,000 Bayer (EUR) Monsanto (USD) (1) In 2016, the company recorded $67 million of cost of goods sold expenses related to the 2015 Restructuring Plan, $297 million of restructuring charges and $270 million of selling, general and administrative expenses related to environmental and litigation settlements and a SEC settlement. (2) In 2015, Monsanto recorded $100.5 million of cost of goods sold expenses related to restructuring, $167.3 million of selling, general and administrative expenses related to environmental and litigation settlements and a potential SEC settlement, and $392.7 million of restructuring expense. The company also recorded $274 million of net sales as a result of the sale of a perpetual license to intellectual property. (3) In 2014, Monsanto recorded $31.8 million of selling, general and administrative expenses related to legacy environmental settlements. EXHIBIT 4.3 Tax Reconciliation Monsanto Company $ million 2016 2015 2014 2013 U.S. Federal Statutory Rate 697 1,106 1,339 1,200 U.S. Domestic Manufacturing Deduction (64) (87) (75) (68)
U.S. R&D Tax Credit (34) (30) (12) (43)
U.S. State Income Taxes 28 39 45 43
Lower Taxes on Foreign Operations (243) (209) (230) (78)
Valuations Allowances 308 13 12
-Adjustments for Unrecognized Tax Benefits (6) (4) (8) (110)
Other 9 36 7 (29)
(Source: Monsanto Annual Report, 2016-2013)
(Source: Monsanto Annual Report, 2016-2013)
(Source: Monsanto Annual Report, 2016-2013; Bloomberg Terminal)
EXHIBIT 4.4 Deferred Income Tax Balance Monsanto Company
$ million
2016 2015 2014 2013
Net Operating Loss and Other Carryforwards 438 323 443 455
Employee Fringe Benefits 331 305 259 335
Restructuring and Impairment Reserves 155 242 135 137
Inventories 91 173 106 130
Royalties 189 154 129 99
Allowance for Doubtful Accounts 77 72 70 95
Environmental and Litigation Reserves 70 69 69 71
Intangibles - - 74 46
Other 407 307 350 239
Valuation Allowance (346) (68) (63) (47)
Total Deferred Tax Assets 1,412 1,577 1,572 1,560 Property, Plant and Equipment 533 539 $ 585 $ 571
Intangibles 334 361 400 403
Other - - 81 60
Total Deferred Tax Liabilities 867 900 1,066 1,034 Net Deferred Tax Assets 545 677 506 526
EXHIBIT 4.5 Intangible Assets Monsanto Company $ million 2016 2015 2014 Acquired Germplams 1,070 (778) 292 1,074 (750) 324 1,116 (751) 365
Acquired Intellectual Property 1,042 (593) 449 1,168 (598) 570 1,160 (507) 653
Trademarks 334 (152) 182 353 (152) 201 366 (142) 224
Customer Relationships 301 (223) 78 318 (212) 106 338 (204) 134
Other 65 (33) 32 176 (146) 30 181 (106) 75
Total Other Intangible Assets, Finite Lives 2,812 (1,779) 1,033 3,089 (1,858) 1,231 3,161 (1,710) 1,451 In Process R&D, Indefinite Lives 92 - 92 101 - 101 103 - 103
Total Other Intangible Assets 2,904 (1,779) 1,125 3,190 (1,858) 1,332 3,264 (1,710) 1,554 Carrying Amount Accumulated Amortization Net Net Carrying Amount Accumulated Amortization Net Carrying Amount Accumulated Amortization EXHIBIT 4.6 Others Monsanto Company $ million 2017 2016 2015 2014 2013 Rental expenses 249 256 273 272 259
Amortization 116 143 136 111
Divident payments 964 938 904 802
Customer Financing Program 644 1,050 574 437
Long-term debt Yield
MON 3.95 04/15/45 Corp 4.750%
Exchange rate
(Source: Monsanto Annual Report, 2016-2013)
(Source: Monsanto Annual Report, 2016-2013)
(Source: Bloomberg Terminal, as of 11/21/2016)
(in USD millions) 2013 2014 2015 2016
Revenue 14,861 15,855 15,001 13,502 United States 8,044 8,625 8,612 8,008 Latin America 3,354 3,565 3,268 2,856 Brazil 1,547 1,778 1,725 1,437 Argentina 1,121 1,092 871 856 Mexico 466 503 537 436 Other 220 192 135 127 Europe-South Africa 2,042 2,192 1,834 1,536 Canada 615 636 601 619 Asia-Pacific 806 837 686 483
EXHIBIT 4.6 Monsanto Sales by Geography
EXHIBIT 4.7 Monsanto Segments
(in USD millions) 2013 2014 2015 2016
Seeds and Genomics 10,340 10,740 10,243 9,988
Corn Seed and Traits 6,596 6,401 5,953 5,825
Soybean Seed and Traits 1,653 2,102 2,276 2,162
Vegetable and Fruit Seed 821 867 816 801
All Other Crops Seeds and Traits 575 705 675 760
Cotton Seed and Traits 695 665 523 440
Agricultural Productivity 4,521 5,115 4,758 3,514
Total Sales 14,861 15,855 15,001 13,502
EXHIBIT 5.1 US Treasury Yields
Maturity (Years) Yield
1 0,78 2 1,12 3 1,38 5 1,81 10 2,33 30 2,98
EXHIBIT 5.2 Expected Inflation
North America 59% 2,1% South America 21% 5,7% Europe 11% 1,5% Canada 5% 2,0% Asia 4% 2,2% Monsanto Market Share
Country Exp. Inflation
EXHIBIT 5.3 Full year forecast (vs. USD) Full year forecast (vs. USD)
2017 2018 2019 2020
BRL 0,30 0,29 0,28 0,28
EUR 1,09 1,15 1,17 1,19
(Source: Bayer Annual Report, 2015)
(source: Bloomberg, Doane, USDA) 2020 2019 2018 2017 2016 2015 2014 2013
U.S. Corn (Mn bushels)
Acreage Planted (Mn acres) 90 90 90 91 94 88 91 95 Yield (bushels/acre) 177 175 173 171 172 168 171 158 Total Supply 16,565 16,445 16,400 16,466 16,665 15,397 15,479 14,686 Total Use 14,495 14,585 14,405 14,265 14,405 13,663 13,748 13,455
Avg. Crop Price ($/bushel) 3.50 3.50 3.45 3.30 3.25 3.61 4 4
U.S. Soybean (Mn bushels)
Acreage Planted (Mn acres) 85 85 84 84 83 83 77 Yield (bushels/acre) 48 47 47 49 48 48 44 Total Supply 4,360 4,315 4,275 4,365 4,145 4,052 3,570 Total Use 4,060 4,005 3,950 4,020 3,890 3,862 3,478
Avg. Crop Price ($/bushel) 10 10 9 9 9 10 13
U.S. Wheat (Mn bushels)
Acreage Planted (Mn acres) 51 51 50 49 50 55 57 56 Yield (bushels/acre) 48 48 47 47 53 44 44 47 Total Supply 2,890 2,955 3,080 3,220 3,400 2,927 2,767 3,026 Total Use 2,250 2,250 2,270 2,245 2,226 1,952 2,015 2,436
Avg. U.S. Crop Price ($/bushel) 6 6 6 6 5 6 7
U.S. Cotton (1000 480 lb. bales)
Acreage Planted (Mn acres) 10,750,000 10,750,000 10,500,000 10,500,000 10,145,000 8,581,000 11,037,400 10,407,000 Yield (lbs/acre) 830 825 820 815 797 766 838 821 Total Supply 19,605 19,608 19,385 19,591 19,844 16,568 18,680 16,719 Total Use 16,150 15,900 15,650 15,600 15,500 12,600 14,830 14,080
Avg. Crop Price (cents/lb.) 68 67 66 65 64 58 61 78
EXHIBIT 5.4 U.S Agriculture Supply/Demand Forecast
EXHIBIT 6 Bayer Management Report & Annexes 19. Takeover-Relevant Information
Explanatory report pursuant to Sections 289, Paragraph 4 and 315, Paragraph 4 of the German Commercial Code (HGB)
The capital stock of Bayer AG amounted as of December 31, 2015 to €2,117 million, divided into 826,947,808 no-par registered shares. The capital stock and the number of shares were thus unchanged from the end of the previous year. Each share confers one voting right. [...]
Provisions of the Articles of Incorporation concerning Authorized Capital I and Authorized Capital II are entered in the commercial register of Bayer AG. With the approval of the Supervisory Board and until April 28, 2019, the Board of Management may use the Authorized Capital I to increase the capital stock by up to a total of €530 million. New shares may be issued against cash contributions and / or contributions in kind, but capital increases against contributions in kind may not exceed a total of €423 million. If the Authorized Capital I is used to issue shares in return for cash contributions, stockholders must normally be granted subscription rights. [...]
EXHIBIT 7.1 EUR/USD Exchange Rates EXHIBIT 7.2 Share Price Developments
84.42 € $109.92 $60 $70 $80 $90 $100 $110 $120 60 € 70 € 80 € 90 € 100 € 110 € 5/2/16 6/2/16 7/2/16 8/2/16 9/2/16 10/2/16 11/2/16 12/2/16 Bayer BASF Monsanto
1.1314 1.0387 1.02 1.04 1.06 1.08 1.1 1.12 1.14 1.16 5/2/16 6/2/16 7/2/16 8/2/16 9/2/16 10/2/16 11/2/16 12/2/16
Teaching Note Case objectives
The main objective of the case is to do an M&A valuation of the Bayer Monsanto deal. This includes a company valuation of Monsanto using the DCF method in order to decide whether the premium Bayer paid to the current share price can be justified. Further tasks include answering questions with strategic relevance as well as other M&A-related questions including the financing of the transaction. This case is applicable for any Corporate Finance, M&A or Valuation class.
Relevant Literature
Koller, T., Goedhart, M., & Wessels, D. (2011). Valuation - Measuring and Managing the Value
of Companies. Hoboken: John Wiley & Sons, Inc.
Monsanto (2015). Annual Report. St. Louis: Monsanto Company. Bayer (2015). Annual Report. Leverkusen: Bayer AG.
DeMarzo, P., & Berk, J. (2014). Corporate Finance. Boston: Pearson.
Marks, Kenneth et al. (2005). The Handbook of Financing Growth – Strategies and Capital
Structure. Hoboken: John Wiley & Sons.
Diverse FT, Bloomberg News, WSL articles
Suggested Questions
1. Valuing Monsanto Company using the DCF method. Include mentioned synergies. 2. Financing:
a. Risks of financing the deal and evaluation of Bayer proposal
b. How to successfully issue the planned amount of equity? What is the max discount for the new shares to avoid a shareholder vote?
c. How will the share price be affected? 3. Strategy:
a. Was the decision to acquire Monsanto right? Would there be alternatives? b. How will the competition most likely react?
Suggested Solution
Q1. Valuing Monsanto Company using the DCF method Reorganizing Financial Statements & NOPLAT Calculation
The first step for the company valuation using the discounted cash flow (DCF) method is to reorganize the financial statements and separate operating from non-operating assets in order to calculate the free cash flows (FCF). As per definition (Koller, Goedhart, & Wessels, 2011), FCFs are independent from non-operating assets as well as from financing.
𝐹𝐶𝐹 = 𝑁𝑂𝑃𝐿𝐴𝑇 + 𝑁𝑜𝑛𝑐𝑎𝑠ℎ 𝑂𝑝𝑒𝑟𝑎𝑡𝑖𝑛𝑔 𝐸𝑥𝑝𝑒𝑛𝑠𝑒 − 𝐼𝑛𝑣𝑒𝑠𝑡𝑚𝑒𝑛𝑡𝑠 𝑖𝑛 𝐼𝑛𝑣𝑒𝑠𝑡𝑒𝑑 𝐶𝑎𝑝𝑖𝑡𝑎𝑙 To calculate the net operating profits less adjusted taxes (NOPLAT), the income statement needs to be adjusted for operating costs and operating taxes. This requires a thorough analysis of the company’s financial statements as well as the footnotes included. In 2016, the company reported $67 million restructuring expenses as part of COGS. In 2015, Monsanto reported $101 million of restructuring expenses as part of COGS as well as a $274 million sale of a perpetual license which has been recorded as part of revenue. Furthermore, Monsanto’s selling, general & administrative expenses (SG&A) need to be adjusted for litigation and environmental settlement outlays which are $32, $167 and $270 million respectively in 2014, 2015 and 2016 as well as for $392.2 and $297 million restructuring expense in 2015 and 2016 (Exhibit 4.2). Subtracting the adjusted operating expenses from the net sales leads to the company’s EBIT. For the FCF calculation, it is recommended to use EBITA because the accounting for intangibles differs from physical assets. The amortization values from the cash flow statement are shown in Exhibit 4.6. Intangibles are expensed and not capitalized, and thus using EBITA avoids double-counting amortization expenses (Koller, Goedhart, & Wessels, 2011).
NOPLAT is calculated by subtracting Monsanto’s operating taxes as well as the change in deferred taxes from its EBITA (refer to chapter “Tax adjustments” for operating tax calculation).
Table 1: Net Operating Profit less Adjusted Taxes (NOPLAT) Calculation for Monsanto
Tax adjustments Operating Taxes
In order to calculate the operating taxes, we have to find the tax reconciliation table in the financial report, convert reported values into percentages and eliminate non-operating and one-time taxes (Exhibit 4.3). The adjustment for operating taxes requires judgement in many cases. As a proxy for the marginal tax rate we can use the statutory rate plus the state tax (Koller, Goedhart, & Wessels, 2011) which sums up to 36.4% for Monsanto in 2016 (taken from the tax reconciliation table of the annual report, Exhibit 4.3). As amortization is usually nondeductible from taxes, we calculate the operating taxes as a function of Monsanto’s adjusted EBITA which results into marginal taxes of $1.197 million in 2016. For the operating taxes, we have to take into account tax benefits that the company is exposed to such as tax credit for R&D expenditures or lower foreign rates as a result of business operations in other countries with lower tax rates than the U.S. For the Monsanto analysis, all the reported taxes can be considered operating except for those reported as “Other, net”. There is no further description of this type of taxes in the financial report, however the values seesaw significantly which is why it is excluded from the analysis. Adjusting the marginal tax rate for the tax benefits leads to an operating tax rate of 35% in 2016 as can be seen in Table 2.
(Dollars in millions) 2013 2014 2015 2016
Net Sales 14,861 15,855 15,001 13,502
Cost of goods sold 7,208 7,281 6,819 6,485
Thereof perpetual license sale (274)
Thereof expenses related to restructuring - - (101) (67)
Gross Profit 7,653 8,574 7,808 6,950
Operating Expenses:
Selling, general & administrative expenses 2,550 2,774 2,686 2,833
Thereof expenses for litigation & environmental settlements - (32) (167) (270)
Thereof expenses related to restructuring (392) (297)
Research & development expenses 1,533 1,725 1,580 1,512
Total Operating Expenses 4,083 4,467 3,707 3,778
EBIT 3,570 4,107 4,101 3,172
Amortization 111 136 143 116
EBITA 3,681 4,243 4,244 3,288
Operating Taxes 1,035 1,221 1,220 1,158
+/- Change in Deferred Taxes 27 38 (113) 76
Table 2: Operating Taxes for Monsanto
Deferred Taxes
For a more accurate valuation, it makes sense to use the operating cash taxes that were actually paid instead of simply using the reported accrual-based taxes. This deviation exists mainly due to accounting differences in taxation and reporting. For example, the government allows an accelerated depreciation to reduce tax burden in the beginning of an asset life while the figures in the financial statement are usually reported using straight-line depreciation, thus overstating actual taxes (Koller, Goedhart, & Wessels, 2011).
The easiest way to calculate the cash taxes is to subtract the delta in net operating deferred tax liabilities (DTLs). The deferred income tax balances can be found in the same footnote as the tax reconciliation table (Exhibit 4.4). Monsanto has one operating-related DTA (deferred tax assets) and one DTL. The first one is reported as property, plant and equipment (PP&E) and refers to accelerated depreciation (a DTL). The second one refers to inventories (a DTA) as a result of differences in inventory valuation between tax and financial accounting. Subtracting the DTA from the DTL yields net operating deferred-tax liabilities of $442 million in 2016. The remaining items in the deferred income tax table are related to non-operating DTAs and DTLs as highlighted in Table 3.
(Dollars in millions) 2013 2014 2015 2016
Operating Taxes and Operating Cash Taxes
Marginal Tax Rate 36.2% 36.2% 36.2% 36.4%
x Adjusted EBITA 3,681 4,243 4,244 3,288
= Marginal taxes on EBITA 1,334 1,534 1,537 1,197 Other Operating Taxes: $ (299) $ (313) $ (317) $ (39)
Lower Foreign rates $ (78) $ (230) $ (209) $ (243)
U.S. Domestic Manufacturing Deduction $ (68) $ (75) $ (87) $ (64)
U.S. R&D Tax Credit $ (43) $ (12) $ (30) $ (34)
Valuation Allowances $ - $ 12 $ 13 $ 308
Adjustment for Unrecognized Tax Benefits $ (110) $ (8) $ (4) $ (6)
Operating Taxes $ 1,035 $ 1,221 $ 1,220 $ 1,158
Table 3: Deferred income tax reorganization
In 2015, Monsanto reported an increase of $76 million in operating deferred taxes and thus operating cash taxes of $1.234 million.
Table 4: Operating Cash Taxes
Free Cash Flow Calculation
Moving forward from NOPLAT, we need to add back the non-cash operating expenses and subtract the investments in invested capital. Adding back depreciation to NOPLAT, yields Monsanto’s gross cash flow of $2,770 in 2016 (refer to Table 5). This is the cash flow generated solely by the company’s operations. In other words, it is the cash that is available for investment without the need to raise any additional capital (Koller, Goedhart, & Wessels, 2011).
Investments in invested capital include the change in operating working capital, net capital expenditures, the change in capitalized operating leases, investments in goodwill and acquired intangibles as well as the change in net long-term operating assets. As each of these items requires special treatment, the following chapters are dedicated to analyze these in detail. In 2016, Monsanto reported a FCF of $2.441 million as can be seen in Table 5.
Deferred income tax balances are related to 2013 2014 2015 2016
Tax loss carry-forwards
Net operating losses $ 455 $ 443 $ 323 $ 438 Valuation allowance (47) (63) (68) (346) Tax loss carry-forwards 408 380 255 92
600 Operating deferred taxes
Accelerated depreciation 571 585 539 533 Accelerated inventory deduction 130 106 173 91 Net operating deferred-tax liabilities $ 441 $ 479 $ 366 $ 442 Nonoperating deferred taxes
Goodwill and other intangibles (357) (326) (361) (334) Other deferred-tax liabilities 60 81 - Other deferred-tax assets $ 976 $ 1,012 $ 1,149 $ 1,229 Nonoperating deferred-tax (liabilities) $ 559 $ 605 $ 788 $ 895 Deferred-tax assets (liabilities) 526 506 677 545
2013 2014 2015 2016
Operating taxes $ 1,035 $ 1,221 $ 1,220 $ 1,158
Increase in operating deferred taxes $ 27 $ 38 $ (113) $ 76
Table 5: Free Cash Flow Calculation
Operating Working Capital Calculation
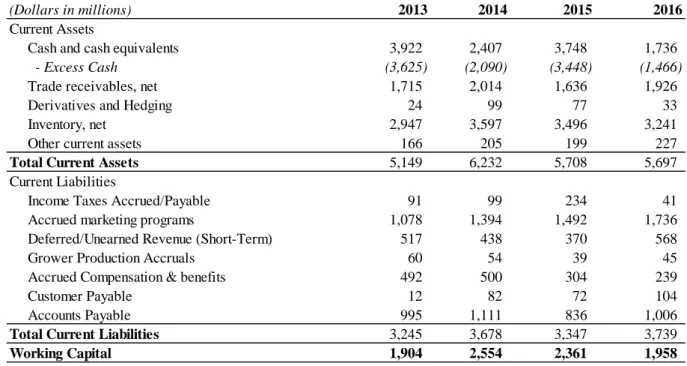
Operating working capital refers to the investment in inventory, operating cash and other working capital components. To be consistent in the calculation, we need to exclude non-operating items such as excess cash2, short-term debt, derivatives & hedging or dividends. With $1.466 million in 2016, Monsanto holds a significant amount of excess cash which needs to be subtracted from the company’s cash and cash equivalents reported on the balance sheet. Further operating items on the asset side of the balance sheet include accounts receivables, misc. receivables, inventory as well as other current assets.
On the liabilities side of the balance sheet, we have to include the accrued income taxes, the marketing and grower production programs, deferred revenue, compensation, as well as accounts and customer payables.
Subtracting the total current operating liabilities from the assets results into a working capital balance of $1.958 million in 2016.
(Dollars in millions) 2014 2015 2016
NOPLAT 3,059 2,911 2,206
Depreciation 555 573 563
Gross Cash Flow 3,614 3,484 2,770
Change in operating working capital 650 (193) (403)
Net capital expenditures 983 464 821
Decrease (increase) in capitalized operating leases (7) (249) 336 Investments in goodwill and acquired intangibles 928 (332) (327) Decrease (increase) in net long-term operating assets 290 (139) (99)
Gross investment 2,844 (449) 329
Table 6: Operating working capital calculation
Net Capital Expenditures
Net capital expenditures (capex) can be calculated by subtracting last year’s net PP&E asset value from this year’s and adding back depreciation of the current year. For Monsanto this results into a net capex of $821 million in 2016 (Table 5).
Capitalized Operating Leases
Companies usually do not disclose the value of their operating leases but rather record the asset’s rental expenses as well as future commitments of rental charges. For the valuation, the lease value should be included as an operating asset or otherwise companies that lease instead of buying assets appear to be “capital light”. As the values are not disclosed, we can estimate the asset value by using the formula (Koller, Goedhart, & Wessels, 2011):
𝐴𝑠𝑠𝑒𝑡 𝑉𝑎𝑙𝑢𝑒𝑡−1 = (𝑅𝑒𝑛𝑡𝑎𝑙 𝐸𝑥𝑝𝑒𝑛𝑠𝑒𝑡 𝑘𝑑 +𝐴𝑠𝑠𝑒𝑡 𝐿𝑖𝑓𝑒1
)
The rental expenses are reported in the footnotes (Exhibit 4.6), while the cost of debt calculation will be explained in detail in the WACC calculation chapter. The asset life can be approximated by dividing total PP&E by the depreciation expense for the respective year. In 2017, Monsanto
(Dollars in millions) 2013 2014 2015 2016
Current Assets 4 5 6 7 Cash and cash equivalents 3,922 2,407 3,748 1,736
- Excess Cash (3,625) (2,090) (3,448) (1,466)
Trade receivables, net 1,715 2,014 1,636 1,926 Derivatives and Hedging 24 99 77 33 Inventory, net 2,947 3,597 3,496 3,241 Other current assets 166 205 199 227 Total Current Assets 5,149 6,232 5,708 5,697 Current Liabilities
Income Taxes Accrued/Payable 91 99 234 41 Accrued marketing programs 1,078 1,394 1,492 1,736 Deferred/Unearned Revenue (Short-Term) 517 438 370 568 Grower Production Accruals 60 54 39 45 Accrued Compensation & benefits 492 500 304 239 Customer Payable 12 82 72 104 Accounts Payable 995 1,111 836 1,006 Total Current Liabilities 3,245 3,678 3,347 3,739 Working Capital 1,904 2,554 2,361 1,958
has a rental expense of $249 million. In 2016, the company records an average asset life of 19.7 years and an after-tax cost of debt of 3%, resulting into an asset value of $3.031.
Table 7: Operating Leases
Investments in Goodwill and Acquired Intangibles
We can estimate the investment in goodwill and acquired intangibles by computing the change in net goodwill and acquired intangibles. In addition, cumulative amortization has to be added back for intangible assets that are amortized. For Monsanto, this leads to a total of $6.924 million in 2016 as shown in Table 8.
Table 8: Adjustments to Goodwill and Acquired Intangibles
Change in net long-term operating assets
Investments in other net operating assets have to be taken into consideration as well. For Monsanto, other long-term assets have to be netted against other liabilities. The delta yields -$99 million in 2016 (Table 5).
Forecasting Revenues
Now that we have calculated Monsanto’s FCFs, we need to forecast these values to determine the value of the company. Most importantly, we have to forecast Monsanto’s revenues as most remaining income statement and balance sheet items will be a function of these. At this point, it is important to mention that forecasting is never a precise science. As for case study purposes,
Operating leases (Dollars in millions) 2014 2015 2016 Rental Expense 272 273 256 Asset life 18.7 18.2 19.7 Cost of Debt 3% 3% 3% Asset value 3,232 2,983 3,049 (Dollars in millions) 2014 2015 2016 Goodwill 4,319 4,061 4,020 Acquired Intangibles 1,554 1,332 1,125
Cumulative amortization and impairments 1,710 1,858 1,779 Adjustments to Goodwill and Acquired Intangibles 7,583 7,251 6,924
following abstract in this teaching note will give an example.
As mentioned before, Monsanto consists of two main business: The Seeds and Genomics segments makes up around 74% of Monsanto’s total business while Crop Protection makes up the remaining 26%. Each business has separate value drivers which will be highlighted and forecasted in this chapter. Overall, sales are driven by the three influencing factors volume,
price and currency impacts.
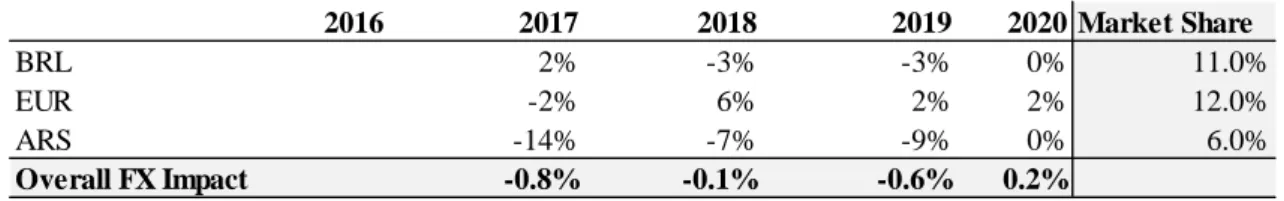
The currency impact can be estimated by weighting the forecasted exchange rates with Monsanto’s market share in the respective countries. Exhibit 5.3 shows the 3 major currencies that impact Monsanto’s revenues. The revenue generated in the U.S. (59%), Brazil (11%), Argentina (6%) and in the Euro area (11%) already sum up to 88% of Monsanto’s total turnover. As there is no currency impact from the U.S., only the latter three have to be taken into account. Furthermore, we can assume that the currency risk that Monsanto has in these countries comes from accounts receivables (farmers paying Monsanto for their products). Thus, a depreciation of the real, peso or euro has negative impacts for the company. Table 9 shows that by converting the values given in Exhibit 5.3 into percentages and by multiplying these with Monsanto’s market share in 2016 (Exhibit 4.4), the projected FX impact can be calculated for the following years.
Table 9: Projected FX Impact
Price/Volume Crop Protection: One of the main drivers of crop protection turnover is the
farmer’s income. If crop prices are high, farmers have more purchasing power in what regards branded crop protection chemicals. As crop prices have been depressed in the past 3 years due to strong harvests in the Americas, farmers increasingly moved to generic crop protection products which led ultimately to depressed sales for Monsanto. The forecast assumption that is
2016 2017 2018 2019 2020 Market Share
BRL 2% -3% -3% 0% 11.0%
EUR -2% 6% 2% 2% 12.0%
ARS -14% -7% -9% 0% 6.0%
made here is that crop prices strongly correlate with herbicide sales. According to the U.S. Department of Agriculture, crop prices are estimated to be even lower in the next three years, while slowly starting to pick up again in 2019 (Exhibit 5.4).
As Monsanto lost its remaining glyphosate patents in 2000, there has been an immense increase in glyphosate production, leading to oversupply in the market and thus even further margin deterioration. As a result, the forecast assumption for the valuation is that revenue from herbicides will decrease -3% and -1% in 2017 and 2018 respectively, while remaining at 0% in 2019 and slowly picking up again in 2020 with 1% increase (Table 10).
Table 10: Crop Protection Revenue Forecast
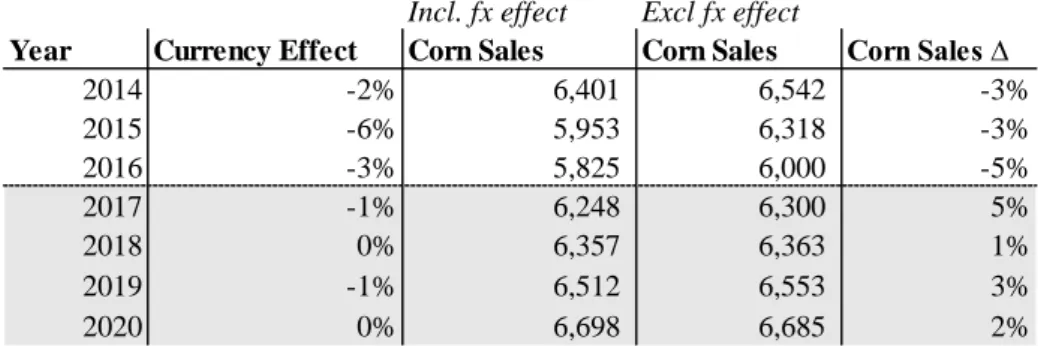
In contrast to the Crop Protection, Monsanto’s Seed segment has slightly different value drivers. One main influencing factor is the expansion in acreage that is available for planting as a logical consequence of the more space available, the more seeds for plantation are required. At this point, one also has to take the market size of the main crops into consideration as well as weather forecasts and company own expansion plans:
Monsanto’s Seed business can roughly be divided into corn, soy, cotton and other seeds. Monsanto’s corn business makes up more than 50% of its total seed business and is by far the most advanced in terms of genetically modified variations as for example drought tolerance. Weather is always hard to forecast, but following the 2016 El Niño, the weather phenomenon La Niña is expected to show her impact by the end of 2016 and the beginning of 2017. La Niña lowers the average equatorial Pacific Ocean water temperature and is associated with an
Incl. fx effect Excl. fx effect
Year Currency Effect Herbicide Sales Herbicide Sales Herbicide Sales ∆
2014 -2.2% 5,115 5,230 13% 2015 -4.9% 4,758 4,992 -5% 2016 -5.1% 3,514 3,692 -26% 2017 -0.8% 3,551 3,581 -3% 2018 -0.1% 3,542 3,545 -1% 2019 -0.6% 3,523 3,545 0% 2020 0.2% 3,588 3,580 1%
Monsanto’s biggest market is North and South America (~80% of sales), an increase in drought resistant corn seeds can be expected. However, there will be a slight headwind as a result of decreasing acreage in 2017 and 2018. After that we can only expect slow growth due to continuously depressed corn prices as well as a slow expected growth in acreage. Thus the corn forecast for the next five years is 5%, 1%, 3% and 2% until 2020 respectively as shown in Table 11.
Table 11: Seed Sales Corn Forecast
For soy seeds, Monsanto expects a 20% increase in sales in 2017 due to a newly introduced soy seed technology that already showed a favorable adoption rate in Latin America. However, from personal judgement as well as depressed farmers’ spending, this number seems overestimated. Therefore, the assumption is that the 20% increase in sales will be reached only until 2018 with an approximate 10% sales increase each year. This is followed by 2% growth as well as 5% growth in 2019 and 2020 respectively due to an increase in available acreage.
Table 12: Forecast Seed Sales Soy
Monsanto’s cotton sales show a high correlation of 71% between planted acreage and seed sales. Thus the best forecast for the cotton sales will be in accordance to the acreage forecast of 3%,
Incl. fx effect Excl fx effect
Year Currency Effect Corn Sales Corn Sales Corn Sales ∆
2014 -2% 6,401 6,542 -3% 2015 -6% 5,953 6,318 -3% 2016 -3% 5,825 6,000 -5% 2017 -1% 6,248 6,300 5% 2018 0% 6,357 6,363 1% 2019 -1% 6,512 6,553 3% 2020 0% 6,698 6,685 2%
Incl. fx effect Excl fx effect
Year Currency Effect Soy Sales Soy Sales Soy Sales ∆
2014 -2% 2,102 2,148 27% 2015 -6% 2,276 2,416 12% 2016 -3% 2,162 2,227 -8% 2017 -1% 2,429 2,449 10% 2018 0% 2,692 2,694 10% 2019 -1% 2,731 2,748 2% 2020 0% 2,892 2,886 5%
0%, 2% and 0% respectively until 2020.
Table 13: Forecast Seed Sales Cotton
All the sales forecast figures are adjusted by the currency forecast of the most relevant currencies for Monsanto, namely the Brazilian real, euro and Argentine peso.
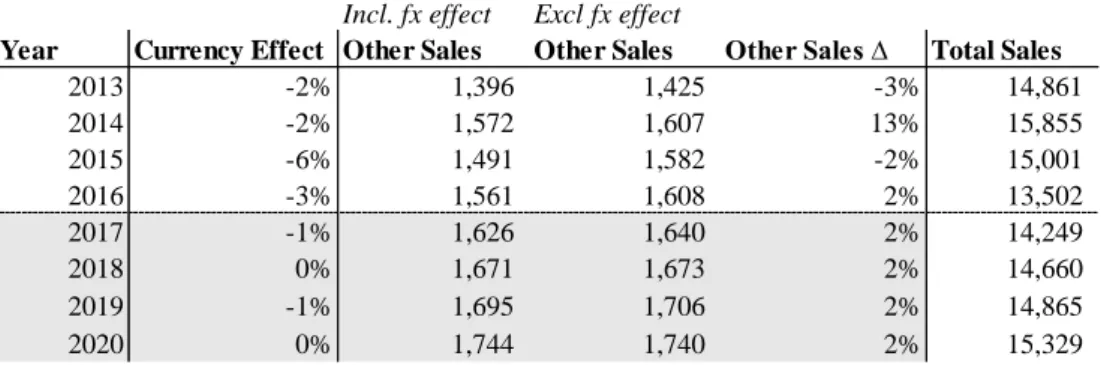
The remaining revenues from Monsanto’s seed business are forecasted based on sales in 2016 which summed up to 2%. Thus, the forecast is assumed to be constant 2% for the next years. The total sales are a sum of the forecasted values from crop protection, corn, soy, cotton and others and can be seen in the last column ‘Total Sales’ in Table 14.
Table 14: Forecast Other Seed Sales & Total Sales
Forecasting the Income Statement
To forecast the income statement, we have to decide which economic relationship drives the line item. Most items are directly tied to the revenue, including COGS, SG&A and R&D. Some other items as for example depreciation or interest expenses are tied to a specific asset or liability on the balance sheet.
In a next step, we need to estimate the forecast ratios for each line item, based on historical ratios. For example, Monsanto’s COGS to sales ratio was 44% in 2016. This level has been
Incl. fx effect Excl fx effect
Year Currency Effect Cotton Sales Cotton Sales Cotton Sales ∆
2014 -2% 665 680 -4% 2015 -6% 523 555 -18% 2016 -3% 440 453 -18% 2017 -1% 463 467 3% 2018 0% 466 467 0% 2019 -1% 473 476 2% 2020 0% 477 476 0%
Incl. fx effect Excl fx effect
Year Currency Effect Other Sales Other Sales Other Sales ∆ Total Sales
2013 -2% 1,396 1,425 -3% 14,861 2014 -2% 1,572 1,607 13% 15,855 2015 -6% 1,491 1,582 -2% 15,001 2016 -3% 1,561 1,608 2% 13,502 2017 -1% 1,626 1,640 2% 14,249 2018 0% 1,671 1,673 2% 14,660 2019 -1% 1,695 1,706 2% 14,865 2020 0% 1,744 1,740 2% 15,329
more or less constant in the previous years. Next, we set the forecast figure for 2017 also to 44% and multiply this value by the forecasted sales figure. This leads to a COGS forecast of $6.249 million in 2017.
The typical forecast driver for depreciation is the prior-year net PP&E, interest expenses are driven by prior-year total debt, while interest income is driven by prior-year excess cash or in Monsanto’s case by the customer financing program, as indicated by the footnotes. The fully forecasted income statement can be seen in Table 15.
Table 15: Income Statement Forecast
Forecasting the Balance Sheet
To forecast the balance sheet, start by forecasting invested capital and non-operating assets. Excess cash and sources of financing are only forecasted in the end in order to make both sides of the balance sheet even. Again, we can forecast most line items as a function of revenues, starting with the operating working capital such as accounts receivables and accrued expenses. Two exceptions are inventories and accounts payable that can be forecasted as a function of COGS.
Forecast net PP&E as a function of revenues and depreciation as a percentage of gross or net
Income Statement Forecast
(Dollars in millions, except per share amounts) 2015 2016 2017 2018 2019 2020 Net Sales $ 15,001 $ 13,502 $ 14,249 $ 14,660 $ 14,865 $ 15,329 Cost of goods sold 6,819 6,485 $ 6,249 $ 6,429 $ 6,519 $ 6,723 Thereof depreciation expense 573 563 $ 593 $ 625 $ 643 $ 652 Gross Profit $ 8,182 $ 7,017 $ 7,407 $ 7,605 $ 7,702 $ 7,953 Operating Expenses:
Selling, general & administrative expenses 2,686 2,833 $ 2,565 $ 2,639 $ 2,676 $ 2,759 Research & development expenses 1,580 1,512 $ 1,567 $ 1,613 $ 1,635 $ 1,686 Restructuring charges 393 297 $ - $ - $ - $ -Total Operating Expenses $ 4,659 $ 4,642 $ 4,132 $ 4,251 $ 4,311 $ 4,445 Income from Operations 3,523 2,375 $ 3,275 $ 3,354 $ 3,391 $ 3,508 Interest expense 433 436 436 $ 436 $ 436 $ 436 Interest income (105) (74) $ (51) $ (51) $ (51) $ (51) Other expenses, net 34 22 $ 51 $ 51 $ 51 $ 51 Income from Continuing Operations Before Income Taxes $ 3,161 $ 1,991 $ 2,839 $ 2,918 $ 2,955 $ 3,072 Income tax provision 864 695 $ 1,095 $ 1,120 $ 1,133 $ 1,168 Income from Continuing Operations $ 2,297 $ 1,296 $ 1,744 $ 1,798 $ 1,822 $ 1,904 Discontinued operations:
Income from operations of discontinued business 45 27 $ 27 $ 27 $ 27 $ 27 Income tax provision 17 10 $ 10 $ 10 $ 10 $ 10 Income on Discontinued Operations 28 17 $ 17 $ 17 $ 17 $ 17 Net Income $ 2,325 $ 1,313 $ 1,761 $ 1,815 $ 1,839 $ 1,921 Less: Net income attributable to noncontrolling interest 11 (23) $ - $ - $ - $ -Net Income Attributable to Monsanto Company $ 2,314 $ 1,336 $ 1,761 $ 1,815 $ 1,839 $ 1,921
PP&E.
For goodwill and acquired intangibles we choose to keep these constant and set revenue growth from acquisitions to zero. This approach is preferred by practitioners as empirical literature suggests that typical acquisitions often fail to create value which makes forecasting goodwill and acquired intangibles unnecessary (Koller, Goedhart, & Wessels, 2011). Monsanto’s forecasted balance sheet can be seen below in Table 16.