Master in Finance Integrated Work Project 2008/2009
E q u i t y I n v e s t m e n t R e c o m m e n d a t i o n
R e p o r t
Banco Espírito Santo
Author:
João Pedro Monteiro Leitão
Number:
128
THIS DOCUMENT WAS PRODUCED TO BE USED INTERNALLY AT FEUNL.
DISCLOSURES AND DISCLAIMER AT THE END OF THE DOCUMENT PAGE 1/41 SEE MORE INFORMATION AT WWW.FE.UNL.PT
‐120%
‐100%
‐80%
‐60%
‐40%
‐20% 0%
PSI 20 BES
Strong strategic positioning post €1,2bn rights issue
BES remains the best Retail Bank in Portugal, and its advantage in terms of efficiency gives BES a higher flexibility to face the higher cost of funding and lower margins. The capital increase confirms BES as one of the most well capitalised Banks of Iberia.
FY09 Preview
Net Interest Income 6,4% higher than FY08 (vs 10,4% growth in 2008), and Fees & Commissions income 5,1% lower than FY08, driven by the slowdown of Investment Banking and Pension Funds activities. Income from Financial Operations positive growth expected, as markets gradually recover.
Liquidity Concerns
Actual liquidity constraints are putting downward pressure on margins, with banks engaging in a battle for Deposits offering rates above Euribor. Time Deposits spread of -20bp and -10bp for 2009 and 2010 respectively.
Company description
BES recently became the largest market capitalization bank of PSI 20. Considered one of the most efficient banks in Europe, its operations are spread between Iberia, Angola and Brazil, also known as “The Strategic Triangle”. In the Portuguese market it has an average market share of 20,7%, and is leader in Brokerage and Investment Banking services.
12JUNE 2009
B
ANCO
E
SPÍRITO
S
ANTO
I
NVESTMENT
R
ECOMMENDATION
B
ANKSA
NALYST:
J
OÃOP
EDROM.
L
EITÃO[email protected]
In the Pole Position for a Challenging Race
Efficient, Capitalized and with Good Opportunities
Fair Value (as of Dec 09): 4,52 €
Potential gain 16,2%
Price (as of 12-Jun-09) 3,89 €
Reuters: BES.LS , Bloomberg: BES PL
52-week range (€) 2,77-6,96 Market Cap (€m) 4.550 Outstanding Shares (m) 1.667
Source: Bloomberg and Analyst Estimates
Source: Bloomberg
(Values in € millions) 2008 2009E 2010E NII 1.086 963 1.046 MIM 3,92% 3,47% 3,77% Operating Income 1.888 1.723 1.843 Operating Expenses (924) (906) (930) NPL/Total Loans 1,11% 1,56% 1,72% Net Income 402 259 336 Cost-to-Income 48,9% 52,6% 50,4% Revenue/Profit 4,77x 3,87x 3,48x Tier I 6,6% 9,3% 9,25% Solvency Ratio 10,5% 14,5% 14,4% EPS 0,81 0,23 0,29
ROE 9,7% 5,2% 6,0%
PAGE 2/41
Table of Contents
Executive summary ... 3
Valuation ... 3
Company overview ... 4
Shareholders Structure ... 5
Capital Increase ... 5
The Sector ... 7
BES Operations ... 8
European Operations ... 8
Angola Operations ... 17
Brazil Operations ... 23
Consolidated Operations ... 27
Valuation ... 32
Risks... 35
Appendix ... 36
PAGE 3/41
Executive summary
• As other banks around the world, BES is facing some turbulent times, suffering a severe hit in profitability and accumulating a 62% fall in the value of its shares since Jun-07.
• With the recent Capital increase BES was able to secure a better than peers solvency position, becoming one of the well capitalized banks in Iberia. This action was taken to support the activity, but also to comply with the new capital requirements imposed by the Portuguese Central Bank.
• Given this situation we expect to observe a general deleveraging trend in all bank’s activities, not only due to the change introduced in regulation, but also to decrease risks.
• As a consequence of the economic slowdown implied by the current financial crisis, we expect Credit activity to decline, as banks will be more prudent in lending money. This effect is also a consequence of higher reflection on the bank’s investments in order to keep risky assets under control, the bank cannot lend money to every individual or company.
• Non Performing Loans and Credit Provisioning have been rising, hurting the bank’s profitability, and representing one of the major problems to control on the short term.
• On the liabilities side, we foresee banks battling for customers Deposits aiming to capture safer sources of funding, driving margins down to negative terrains.
• Special attention is expected on “capital wastage”, with stricter cost contention policies, and physical network investments slowdown.
• Angola operations will remain with the highest growth rate of the entire Group, despite the slowdown verified in the economy. The contribution of Angola will be crucial in the next couple of years to prevent profitability to fall even further.
PAGE 4/41
32,0% 27,3% 19,2% 17,5%
25,6% 16,9% 16,3% 18,9% 14,7%
25,6% 17,1%
Brokerage Trade Finance Factoring Leasing Corporate Lending Other Loans Indiv. Mortgage Asset Mgmt Life Insurance Pension Plans On BS Funds
Company Overview
Banco Espirito Santo is a private bank with operations spread between all continents. Since its privatization, BES evolution was supported by the construction of a universal Financial Group serving all Individual, Corporate and Institutional customer segments, offering a full range of financial products and services.
The structure of the Group is described characterized by:
Espirito Santo Financial Group
Retail Banking
Investment
Banking
Venture Capital
Asset
Management
Insurance
Banco Espirito Santo BES Investimentos
ES Capital ESAF SGPS BES Vida (Portugal) (Portugal & Spain) (Portugal)
BES Angola BES Investimentos ES Ventures (London)
ESAF
BES Seguros
(Angola) (Brazil) (Spain)
BES Açores BESAF
Europ Assistance
(Portugal) (Brazil)
BEST (Portugal)
Geographically the operations of BES are spread between Portugal, Spain, Angola, Brazil and London, forming what the bank calls the Strategic Triangle.
Portuguese operations covers all areas of business described above, being one of the major banks of the country, with significant market shares in all segments, especially on Investment Banking, Brokerage and Pension Funds activities, on which BES is market leader (see Graph 1). The average market share of the Group is 20,7%.
In Spain the core activity of the Group is Corporate Credit, as the bank bets on serving Portuguese companies with operations in Spain and Spanish companies with operations in Portugal, benefiting from the proximity of the two countries to leverage the activity. The good platform offered by BES to companies present in both countries helps the bank to attract clients, benefiting then from the cross selling of products.
Angola is a recent activity developed by the Group (started in 2001) with the intention of enjoying the good momentum of the country. Given the potential of the country, the Group soon started to develop its activity by supporting the local Government in the construction of public infrastructures and in the placement of governmental securities on the market. More recently BES Angola is extending its operations through Retail and Investment Banking activities.
Graph 1: BES market shares (%)
PAGE 5/41
BESPAR Crédit Agricole Bradport Credit Suisse Group Previsão
Fundo de Pensões
BES
Hermes Pensions
Management Free Float
The Brazilian operations are focused only on Investment and Private Banking activities, with the Institutional division being one of the most dynamics of the bank, dealing with the major public infrastructures construction processes.
London is a special case, as its activities are originated in other locations, and then registered there to benefit from particular conditions. These operations are restricted to Institutional investors and big Companies. This division also aims to enable the Group with access to Financing Markets.
Net Income generated by Group’s activity in 2008 is allocated in the different operations as follows:
Graph 2: Net Income Breakdown (2008)
We will further explore the characteristics and details of these different markets on the section “BES Operations”.
Shareholder Structure
BES Shareholder Structure in 2008 is almost identical to the previous year, with the unique difference being the entry of the Credit Suisse Group with 2,7% of the bank’s shares. Actually the Shareholder Structure is:
BESPAR 40,0%
Crédit Agricole 10,8%
Bradport 3,1%
Credit Suisse Group 2,7%
Previsão 2,6%
Fundo de Pensões BES 2,2% Hermes Pensions Management 2,0%
Free Float 36,6%
Domestic 75%
Angola 12%
Brazil 7%
Other 6% International
25%
Source: Company Reports
Graph 3: Shareholder Structure (2008)
PAGE 6/41 As of December 31st, 2008, BES had a free float of 36.6%, considering as reference shareholders the Espírito Santo Financial Group (through BESPAR), Crédit Agricole, Banco Bradesco (through Bradport) and Portugal Telecom (through Previsão – Sociedade Gestora de Fundos de Pensões).
We do not expect a significant change in this structure as the recent capital increase let the bank in a comfortable capital position, putting aside the possibility of a merger with another company or the entrance of a big Private or Institutional investor whit a significant stake. In the future we expect the bank to generate results that comply with the capital needs, supporting the evolution of the activity with the results generated internally.
Capital Increase
During the first quarter of 2009 BES performed a € 1,2 billion Rights Issue, these are the facts:
• Proceeds up to € 1,2 billion as BES issued 4 new shares per each 3 old shares.
• Issue price of € 1,8 per share, which implied 617 million new shares and total number of shares post capital increase of 1167 million.
• Core shareholders (ESFG, Crédit Agricole, Bradesco and Portugal Telecom) that control a 57% stake in BES were supportive of the transaction and fully subscribed their stake. Bradesco even slightly increased their stake during the operation.
• The rationale of capital increase is driven by:
business performance, since 2005 Risk Weighted Assets have increased by 14% yearly, hence BES needed capital to support future activities regulatory demand, given that Portuguese Central Bank recently set the
new benchmark for Tier I at 8% (to be reached by Sept 09). BES Tier I Ratio in 2008 was at 7.1%, changing to 9,3% after the Capital increase relative position, as BES will became a very well-capitalized bank in
Iberia in terms of Core Capital
the support manifested from core shareholders.
PAGE 7/41
0 500 1000 1500 2000
2500 AEX FINANCIALS PSI FINANCIALS CAC FINANCIALS BEL FINANCIALS
0 5 10 15 20 25
BES PSI FIN*
The Sector
2008 was an exceptionally difficult year for the Capital markets in general and for the Equity markets in particular. The continuous unfolding of the financial crisis had visible consequences on the real economy along the year, leading to the sharp devaluation of the main stock market indices in the world. Being at the very epicenter of the crisis, the banking sector was naturally penalized during the year.
Graph 4 & 5: Evolution of the main Financial Sector Indices (Jun-07 to Jun-09)
In this very difficult scenario and with the PSI Financials index plunging by 64,4%, the BES shares lost 55,4%, outperforming the sector by 9%. This relatively better performance reflects to a certain extent the market’s positive judgment of BES’ exposure to the risks that triggered the current international financial crisis. Volatility was 86,1%, with the share price fluctuating between a minimum of € 2,77 in March 2009 and a maximum of € 11,2 in July 2007.
PAGE 8/41 ‐6%
‐4%
‐2% 0% 2% 4% 6%
Portugal Spain UK
BES Operations
For European Operations we consider, besides Portuguese operations, London and Spain. This decision was made since Spanish operations (basically corporate credit) are somehow similar to this activity in Portugal, in that they rely mainly on Corporate Credit granting to Portuguese companies with operations in Spain. London operations were included due to their Investment Banking nature that we opted to included in Espirito Santo Activos Financeiros. This decision was also based upon the fact that both countries operations are considered divisions of the Group, and not subsidiaries, as Angola or Brazil.
European Operations account for 84% of the Group’s value and in our opinion they will be the ones with more stable evolution due to the more mature and broad nature of the operations in these countries which have well established Banking systems (ratios of Deposits and Credit over GDP well above 100%). On the other hand profitability will also be in line with the market characteristics for the countries considered (lower ROE), and therefore lower than international operations in high growth potential countries.
Credit Activity
With the current crisis stemming from problems related with credit portfolios of financial institutions, banks are now implementing stricter credit rationing policies, with an increasing pressure to reduce the risks inherent to their portfolios. Considering these rationing policies along with the recession scenarios in the near future (see Graph 6) for the major economies (Portuguese GDP growth rate estimated to be -4,1% for 2009 and -0,5% in 2010), we firmly believe that we will assist to a slowdown of the credit granting activity.
In the near future we anticipate that bank’s regulation will be tighter, and as a consequence banks will be required to implement risk assessment models and policies more accurate. As a result banks will necessarily be more cautious on granting credit, with the penalty of higher Risk Weighted Assets being recognized, with the consequent detrimental impact on Capital Ratios.
Under this new context, we expect a slowdown in the growth rate of credit portfolio and we assume a more stable and sustainable evolution (growth rates between 5% and 8% instead of rates that were ranging between 20% and 40% as recently observed in the market). A special situation is expected for the next couple of years due to abnormal economic conditions that will imply a lower credit portfolio in 2009 than it was in 2008, as the new credit granted will be insufficient to cover the
E
UROPEANO
PERATIONSGraph 6: Real GDP growth rate (%)
Source: IMF
PAGE 9/41
0% 20% 40% 60% 80%
100% Corporate Mortgage
expiring credit. The main contributor to this situation will be the shrinkage in volume of new credit granted implied in the current recession scenarios expected.
The value of Held to Maturity Investments is also included in this section because it is equivalent to credit granted by the bank (bonds and commercial paper issued by the bank to some of its clients). This portfolio changed significantly in 2008 (€ 390 million in 2007 vs € 1,8 billion in 2008).
On the following table we present the expected evolution of the credit portfolio.
Table 1: Credit Portfolio Evolution (€ '000)
2008 2009E 2010E 2011E 2012E 2013E 2014E 2015E
Loans and advances to customers 39 049 784 38 343 435 38 445 850 39 242 008 40 898 154 43 597 899 45 775 947 49 021 696
Corporate 23 737 531 22 954 496 22 364 160 22 697 665 23 711 382 25 706 985 27 081 670 29 376 093 Mortgages 12 155 721 11 750 868 12 206 809 12 517 439 12 976 445 13 487 352 14 151 608 14 957 902 Consumer and Other 3 156 533 3 638 071 3 874 881 4 026 905 4 210 327 4 403 561 4 542 670 4 687 701
Held to maturity investments 1 806 473 2 162 235 1 411 695 949 761 681 880 723 192 754 831 825 232
We expect an increase in the weight of Mortgages in the total credit portfolio (see Graph 7), since in general it has higher collateral associated, thus reducing risk. The fact that Mortgage credit has lower default rates also contributes for risk reduction.
Regarding Consumer credit, we estimate a smaller growth rate in the future, since the adoption of more prudent risk management policies, will imply a cut in the segment on which a higher percentage of NPL occurs relative to the others. Moreover the level of indebtedness of families is already at historically high levels, and so they will be forced to reduce their dependence on credit. Banks will also be more cautious on providing credit to extremely indebted families, putting also a limit on the total amount of credit some families can afford. This effect will contribute to a rationing of credit application by families, as the major part of them needs to rely on Mortgage credit, and so they need to cut on Consumer credit.
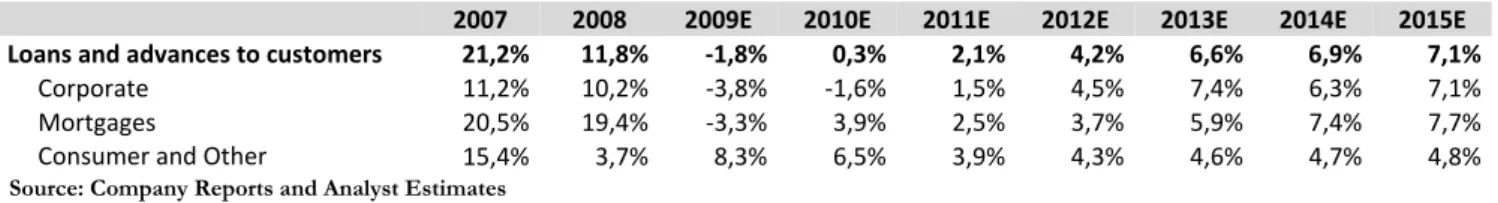
We present now the expected growth rates for the Credit portfolio.
Table 2: Credit Portfolio Growth Rates (%)
2007 2008 2009E 2010E 2011E 2012E 2013E 2014E 2015E Loans and advances to customers 21,2% 11,8% ‐1,8% 0,3% 2,1% 4,2% 6,6% 6,9% 7,1%
Corporate 11,2% 10,2% ‐3,8% ‐1,6% 1,5% 4,5% 7,4% 6,3% 7,1%
Mortgages 20,5% 19,4% ‐3,3% 3,9% 2,5% 3,7% 5,9% 7,4% 7,7%
Consumer and Other 15,4% 3,7% 8,3% 6,5% 3,9% 4,3% 4,6% 4,7% 4,8%
The major implications of the current conjuncture will be reflected on the Corporate portfolio. We will assist to a slowdown of not only credit availability, but also credit demand ("real economy" corporations delaying investments). This effect will account for a reduction of 3,8% and 1,6% in 2009 and 2010 respectively. The higher
Graph 7: Credit segments as a percentage of Total Credit
Source: Company Reports and Analyst Estimates
Source: Company Reports and Analyst Estimates Source: Company Reports and
PAGE 10/41
0% 5% 10% 15% 20%
25% Portugal Spain UK
0,0% 0,5% 1,0% 1,5% 2,0% 2,5%
risk weighting that we expect to observe in terms of the credit portfolio will also be responsible for the deceleration of these growth rates.
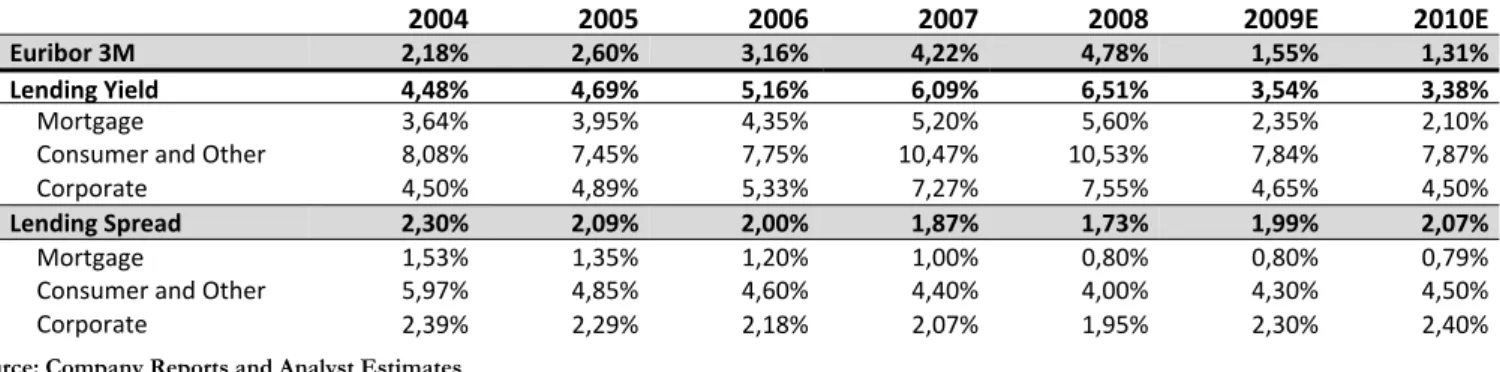
Credit Margins
The changes in the characteristics of the credit portfolio will also imply some changes in the margins charged on the different segments of the portfolio. The most significant change that we expect to prevail in the future is related to the Corporate segment. We expect the bank to charge higher margins on the new credit granted to corporations, but also we expect to see a re-pricing effort on the existing portfolio in order to adjust the price with the current risk conditions of the companies.
As expected the margins on Mortgage credit will be lower than for the other segments due to the different value and level of collateral given. In order to keep attracting new credit in this valued segment banks will refrain from excessively increasing mortgage credit margins. In terms of the Consumer credit margins we also anticipate an increase as a response to the high level of indebtedness of families and the increasing preoccupation of the bank high its risky assets.
Table 3: Credit Margins Evolution (%)
2004 2005 2006 2007 2008 2009E 2010E
Euribor 3M 2,18% 2,60% 3,16% 4,22% 4,78% 1,55% 1,31%
Lending Yield 4,48% 4,69% 5,16% 6,09% 6,51% 3,54% 3,38%
Mortgage 3,64% 3,95% 4,35% 5,20% 5,60% 2,35% 2,10%
Consumer and Other 8,08% 7,45% 7,75% 10,47% 10,53% 7,84% 7,87%
Corporate 4,50% 4,89% 5,33% 7,27% 7,55% 4,65% 4,50%
Lending Spread 2,30% 2,09% 2,00% 1,87% 1,73% 1,99% 2,07%
Mortgage 1,53% 1,35% 1,20% 1,00% 0,80% 0,80% 0,79%
Consumer and Other 5,97% 4,85% 4,60% 4,40% 4,00% 4,30% 4,50%
Corporate 2,39% 2,29% 2,18% 2,07% 1,95% 2,30% 2,40%
Asset Quality
Concerning the quality of the assets held on the Credit portfolio we foresee a slight deterioration of all the quality indicators.
The major source of this deterioration comes in the short term, with the significant increase in Non-Performing Loans (NPL) due to the unpropitious economic conditions (see Graph 9). The difficulties felt by families and corporations due to the recession and unemployment scenarios expected (see Graphs 6 and 8) are directly translated into the banking business in the form of higher NPL, as the difficulties in meeting the obligations with the bank rise.
With higher default on the payments received by the bank related to its credit portfolio, the bank also needs to recognize higher Loan Loss Impairments, hurting
Graph 8: Unemployment Rate (%)
Graph 9: NPL/Total Loans Ratio (%)
Source: Company Reports and Analyst Estimates
Source: Company Reports and Analyst Estimates
PAGE 11/41
0% 20% 40% 60% 80% 100% 120% 140%
‐
50
100 150
200
250 300
Source: Company Reports and Analyst Estimates
profitability. The fall in house prices implies a decrease on Mortgage collateral leading to a extra provisioning effort for this specific portfolio in 2009 and 2010.
As we have already mentioned, we expect this situation to change as economies start to recover from the actual recession scenarios, but the need to put in practice more accurate risk models will make banks to better access the probability of default of a given client, and the loss given default in the case such situation occurs. The higher accuracy in accessing risks will involve a more cautious recognition of either more NPL’s or Loan Loss Impairments in the future, deteriorating the indicators, but increasing the strength and reliability of its own controlling and monitoring policies and methodologies. Some indicators are presented on the following Table.
Table 4: Asset Quality Indicators (%)
2005 2006 2007 2008 2009E 2010E 2011E 2012E 2013E 2014E 2015E
NPL/Total Loans 1,59% 1,34% 1,20% 1,56% 1,74% 1,92% 1,77% 1,68% 1,61% 1,54% 1,47%
Impairments/Total Loans 0,81% 0,67% 0,59% 0,58% 0,70% 0,72% 0,68% 0,64% 0,61% 0,59% 0,58%
Coverage of NPL 109,5% 102,6% 122,4% 123,8% 113,1% 112,7% 118,4% 120,9% 119,8% 119,7% 118,8%
Despite this long term behavior that we expect to observe along with the banking activity evolution, on the short term the quality of the bank’s assets will unquestionably decline. This considerable decline that we anticipate, mainly in 2009 and 2010, is a mirror of the economic conditions, but also of the errors that current risk management models have.
All these effects on the asset quality were already felt on the first quarter results (NPL equal € 560,8 million and Impairments equal to € 238,7 million for 1Q09 vs € 506,7 million and € 226 million on 4Q08).
The evolution of Non-Performing Loans Ratio can be subdivided according to the composition of the credit portfolio into:
Table 5: NPL Ratio Decomposition (%)
2005 2006 2007 2008 2009E 2010E 2011E 2012E 2013E 2014E 2015E
NPL Ratio 1,59% 1,34% 1,20% 1,56% 1,74% 1,92% 1,77% 1,68% 1,61% 1,54% 1,47%
Corporate 1,40% 1,30% 1,25% 1,64% 1,84% 2,06% 1,87% 1,76% 1,66% 1,57% 1,49% Mortgages 1,20% 0,70% 0,65% 0,94% 1,04% 1,16% 1,06% 1,00% 0,94% 0,90% 0,86% Consumer and Other 4,90% 3,20% 3,15% 3,39% 3,42% 3,46% 3,43% 3,41% 3,39% 3,37% 3,36%
We expect companies to feel more difficulties in the future, especially over the crisis period, which will raise defaults on the loans granted to these institutions. We believe that the bank will be more cautious in granting credit, which will be translated to decreasing NPL ratios, but on average, higher ratios than is the past.
Graph 5: Coverage Ratio (%)
Source: Company Reports and Analyst Estimates
Graph 10: Loan Loss Impairments and Provisions Evolution (€ million)
Source: Company Reports and Analyst Estimates
PAGE 12/41 Bradesco
37%
Port.
Telecom 34%
EDP 28%
BMCE 1%
Graph 62: Non-Performing Loans Evolution (€ '000)
In terms of the division of the NPL to the respective credit segments, we do not expect major changes, as the Consumer segment is likely to the one presenting higher default rates, followed by the Corporate segment and with the lowest default rates the Mortgage portfolio. We should stress that in Table 5 we expect higher NPL Ratios for all the segments than in the years up to 2007, which, along with the fact that we expect banks to be more prudent on granting credit means that they will start to recognize a higher percentage of NPL’s to the credit portfolio.
Financial Assets Available for Sale and Held for Trading
Both these portfolios have a similar composition respecting the type of assets held in each one, but the main difference between them resides on the purpose of each. Both portfolios are composed by bonds, stocks and also some derivative instruments, but on the Held for Trading portfolio they are held for trading purposes on a day to day basis, on the Available for Sale (AFS) portfolio we find only the assets that are considered strategic for the bank (see Graph 13). These stakes were already assumed publically to be strategic, but nevertheless they are available for sale at any moment, though it does not mean that the bank will do it unless the strategic view changes or some especially unfavorable situation occurs.
These portfolios suffered a significant change on its composition (see Graph 14), namely the switch from stocks to less risky assets, such as fixed income instruments, to offset the major losses on the participations of the Group. We predict this higher investment on bonds to be gradually reduced as the stock market confidence will be recovered and the major participations restore their value.
Graph 14: AFS and Held for Trading portfolios composition (%)
‐
100 000 200 000
300 000 400 000
500 000
2006 2008 2010E 2012E 2014E Corporate Mortgages
Consumer and Other
Bonds 62% Stocks
32% Other
6%
2007
Bonds 74% Stocks
17% Other
9%
2008
Source: Company Reports and Analyst EstimatesSource: Company Reports
Graph 13: Decomposition of the stocks on the AFS portfolio
Source: Company Reports
Higher NPL Ratios expected
PAGE 13/41
0% 1% 2% 3% 4% 5% 6%
The unusual cut in interest rates is also responsible for this variation, since extremely low interest rates increase substantial the value of the existing portfolio of bonds, boosting its value without new investments being made.
Considering the substitution effect between assets, the value of the overall portfolio will slightly decrease until 2012 reflecting the effect of the bonds investment returning to their previous levels (€ 2,2bn in 2006, € 2,8bn in 2007 and € 5,3bn in 2008) along with the recovery in value of the major stakes of the Group. This gradual effect will also be reproduced on the fair value reserves that will rise to accommodate the gain in value of the stakes hold.
Interbank Market
Surprisingly, in the past, the evolution of Loans and Deposits with other banks had opposite moves, suggesting a negative correlation between them. The reason for this behavior relies on the fact that when banks want to adjust its individual liquidity levels, these two items have a negative correlation between them. When a bank wants to increase its liquidity, there is pressure to increase Deposits and reduce Loans, when it wants to reduce it, the opposite holds. Taking this into account we believe that both accounts will evolve in a similar way, however we expect a higher growth on the assets side, as the bank will face some difficulties in placing its money on other less riskier assets. On the long term we expect both items growth to converge to similar rates.
Table 6: Evolution of Loans and Deposits with other banks
2006 2007 2008 2009E 2010E 2011E 2012E 2013E 2014E 2015E
Loans to banks 30,58% 5,79% ‐31,37% ‐2,74% 4,25% 5,12% 5,75% 6,08% 7,21% 8,38% Deposits from banks 8,47% ‐4,56% 8,36% ‐3,14% 3,35% 4,32% 4,50% 5,00% 6,50% 8,25%
For 2009 we expect a continuation of the effect observed in 2008, that is, the liquidity constraints that all banks are facing will remain, although not so extreme. These constraints reduce the incentives to place assets on other banks, considering that these are the type of assets that the bank will first count upon a liquidity shortfall. Although in 2011 we expect these values will start to recover as the confidence on capital markets will be re-established and banks can rely more on this source of capital to accommodate its liquidity needs.
The actual interest rates are at historically low levels (see Graph 15), imply lower profitability on the capitals that banks place on other financial institutions, representing another disincentive to Interbank operations.
Graph 15: Evolution of 3m EURIBOR since Jan-08 to Jun-09
Source: Banco de Portugal
Source: Company Reports and Analyst Estimates
Substitution from stocks to bonds to offset losses
PAGE 14/41
0% 50% 100% 150% 200%
Deposits
Concerning Deposits we expect banks to direct its major efforts at capturing as much customer’s funds as possible, as capital markets will not provide as much funding as needed. This source of funding will be the main focus of attention for the management of the bank. Although we expect banks to engage in a battle for deposits, we do not expect this value to change significantly, and it may even decrease in 2010, as the major part of the Portuguese population (Spain and London do not have a meaningful amount of deposits on their Balance Sheets) will not enjoy significant disposable income to place on banks, due to the current and expected macroeconomic conjuncture.
Deposits represent an important and profitable source of funding for the bank, but with the pressure implied by the liquidity constraints of the Interbank Market, banks will devote their efforts to gather as much deposits as possible, and consequently changing this business from profitable to unprofitable on the short term, as can be seen on Table 7. The switch from more safer sources of funding makes all the sense given the actual economic situation, but the levels of savings available to place in banks and the bad cycle banks are crossing (especially given the disbelief that we see in Portugal, with some banks becoming insolvent and retaining their customers deposits) does not helps in any way the bank’s attempts. This increasing difficulty in attracting Deposits is reflected on an higher Loans-to Deposits Ratio (see Graph 16) and we expect this trend to continue in the long term.
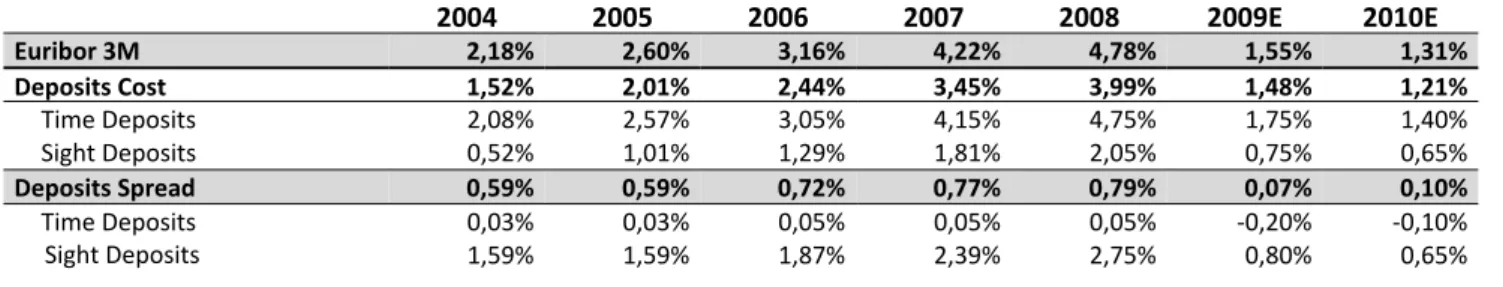
Deposits Margins
Given the Deposits gather effort referred above, we expect to see negative margins on Time Deposits for 2009 and. The need to tie customer’s funds for long horizons (Time Deposits) in order to finance the banks operations will cause the margins to decline, transforming deposits in a less profitable activity than before. Despite the lower profitability of Deposits, they will continue to represent an important source of income, and the ability to transform them into Loans in an efficient way will be crucial for the profitability of the bank.
Table 7: Deposits Margins Evolution (%)
2004 2005 2006 2007 2008 2009E 2010E
Euribor 3M 2,18% 2,60% 3,16% 4,22% 4,78% 1,55% 1,31%
Deposits Cost 1,52% 2,01% 2,44% 3,45% 3,99% 1,48% 1,21%
Time Deposits 2,08% 2,57% 3,05% 4,15% 4,75% 1,75% 1,40%
Sight Deposits 0,52% 1,01% 1,29% 1,81% 2,05% 0,75% 0,65%
Deposits Spread 0,59% 0,59% 0,72% 0,77% 0,79% 0,07% 0,10%
Time Deposits 0,03% 0,03% 0,05% 0,05% 0,05% ‐0,20% ‐0,10%
Sight Deposits 1,59% 1,59% 1,87% 2,39% 2,75% 0,80% 0,65%
Deposits in the middle of attentions
Graph 7: Loans-to-Deposits Ratio Evolution (%)
Source: Company Reports and Analyst Estimates
Source: Company Reports and Analyst Estimates
PAGE 15/41 ‐
5 000
10 000
15 000 20 000
25 000
Debt Securities
The Debt Securities market is now experiencing an unusual performance as the yields at which companies are issuing bonds on the market are at very high levels (last BES bond issue at 5,625%) reflecting mainly the higher risks attributed to each company (especially credit risk), and the downgrade that the major part of companies suffered from credit rating agencies.
On the short term we expect a slight fall on the value of this portfolio, mainly because capital markets will not provide as much capital as the bank would like to rise, but also due to the unattractiveness of this market under the current conditions.
Since we expect some difficulties to arise the next two years on BES sources of funding, the recent € 1,2bn capital increase will be the main driver to support the assets evolution.
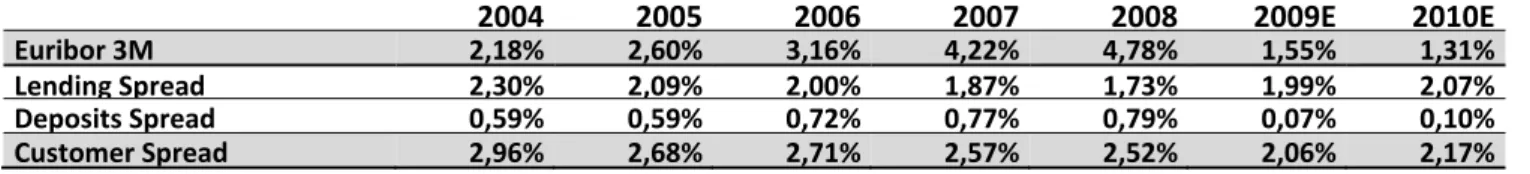
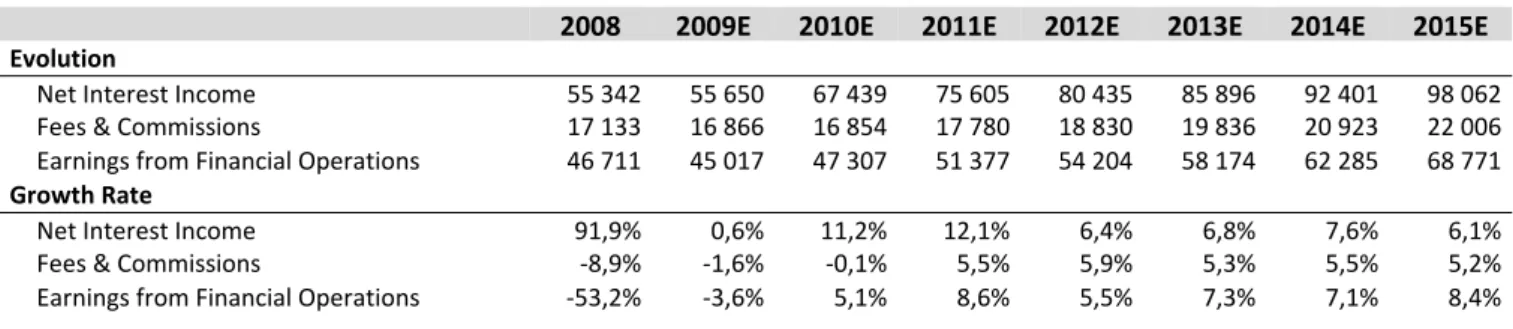
Results
As a consequence of the efforts made by the bank both on Deposits gathering and on Credit granting, the margin the bank achieves from the transformation of Deposits into Loans will suffer a severe hit in 2009 (see Table 8). We expect such margin to increase in 2010, given the extra effort this year represents on the recovery of the business. The increase in spreads on all the segments of the Credit portfolio will not be sufficient to compensate the decrease in Deposits margins mainly due to the deceleration effect in volume expected for the Credit portfolio.
We expect that the level of margins we observed in the past will no longer be possible in the future, as the bank will face harder conditions on Deposits, which obviously will be reflected on profitability. In conclusion, we expect that margins between 2,25% and 2,45% will prevail in the future for the intermediation between Deposits and Loans.
Table 8: Customer Spread Evolution (%)
2004
2005 2006 2007 2008
2009E 2010E
Euribor 3M 2,18% 2,60% 3,16% 4,22% 4,78% 1,55% 1,31% Lending Spread 2,30% 2,09% 2,00% 1,87% 1,73% 1,99% 2,07% Deposits Spread 0,59% 0,59% 0,72% 0,77% 0,79% 0,07% 0,10% Customer Spread 2,96% 2,68% 2,71% 2,57% 2,52% 2,06% 2,17%
In terms of Net Interest Margin, in which we include all interest bearing and interest paying assets and liabilities, we anticipate a similar evolution, though with a significant drop for the incoming years mainly due to the higher costs of funding
€ 1,2bn capital increase will support 2009 operations
Graph 17: Debt Securities Issued (€ millions)
Source: Company Reports and Analyst Estimates
Source: Company Reports and Analyst Estimates
PAGE 16/41
0,0% 0,5% 1,0% 1,5% 2,0% 2,5% 3,0%
0% 10% 20% 30% 40%
0% 10% 20% 30% 40% 50% 60%
and the lower return on the investments made. The expected evolution of Net Interest Margin is illustrated on Graph 18.
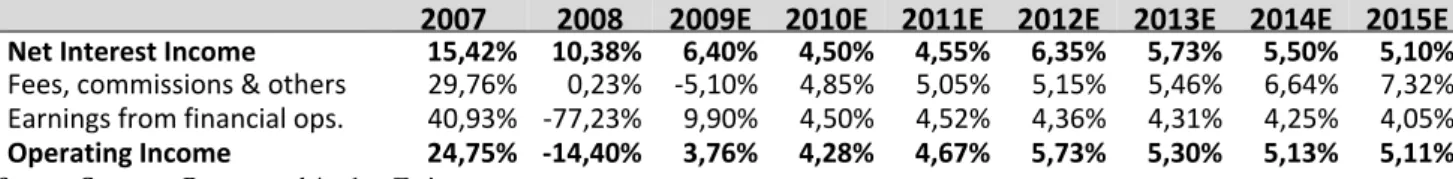
Concerning Fees and Commissions, we expect banks to rely more in this source of income, as it is more stable and less influenced by market conditions (although it is at some extent). In the future we believe that Fees and Commission will represent a larger slice of the bank’s revenues, increasing its percentage on the income generated (see Graph 19). We also expect Fees and Commissions to be the source of income with higher growth, stabilizing in the future with growth rates around 7%. Despite this trend in increasing Fees and Commissions income on the long term, for the next few years we expect to observe the same path initiated in 2008, with this source of revenues decelerating its growth or even falling as the current market conditions are not favorable to the proliferation of business that provide more Fees and Commissions (such as Credit, Pension and Mutual Funds, etc…).
Table 9: Evolution of Operating Income and its components (%)
2007
2008 2009E 2010E 2011E 2012E
2013E
2014E 2015E
Net Interest Income 15,42% 10,38% 6,40% 4,50% 4,55% 6,35% 5,73% 5,50% 5,10%
Fees, commissions & others 29,76% 0,23% ‐5,10% 4,85% 5,05% 5,15% 5,46% 6,64% 7,32%
Earnings from financial ops. 40,93% ‐77,23% 9,90% 4,50% 4,52% 4,36% 4,31% 4,25% 4,05%
Operating Income 24,75% ‐14,40% 3,76% 4,28% 4,67% 5,73% 5,30% 5,13% 5,11%
Operating expenses are expected to be reduced in the near future, expressing the higher importance given to cost efficiency. This special effort is paying off, as the cost-to-income ratio decreased in 2008, and we also foresee a decrease in 2009. Despite this effort, the impact of the cost reduction policies will not be as significant as for other banks, since BES is already the most cost efficient bank operating in Portugal and also one of the most efficient in Europe (average Cost-to-Income ratio of 50% against 61% for its domestic peers). As a key driver we anticipate that all banks will devote special attention to capital “wastage” and implement more rigorous cost contention policies.
We expect personnel and general expenses to fall in the next two years, as a consequence of the aforementioned cost reduction policies, and then we expect them to grow between 1% and 1,5% over inflation. We do not expect major changes on this type of expenses, as BES has already a physical network developed on the major part of the country, and was already made public that no major investments will be made on the branch expansion, since a significant part of the bank’s new clients are being channeled through the cooperative distribution concept launched in 2008 by BES and Tranquilidade.
Graph 8: Net Interest Margin (%)
Source: Company Reports and Analyst Estimates
Graph 19: Percentage of Fees & Com on Operating Income (%)
Source: Company Reports and Analyst Estimates
Graph 20: Cost-to-Income Ratio (%)
PAGE 17/41
Profitability Indicators
ROE will suffer a significant drop in 2009 continuing the tendency of 2008, in which it has shown a lower than average value. In 2008 the ROE was supported mainly to a significant increase in leverage, since the ROA was clearly below previous values. For 2009 leverage will be lower than before, as business models that require/use high leverage become less attractive due to revaluation of risks, leading to a reduction of leverage to more sustainable levels.
The fact that the Portuguese Central Bank changed the minimum Tier I Capital Ratio requirement from 6% to 8% during 2009 will force banks to reduce leverage. In the future banks cannot count so much with the leverage effect to boost ROE, so they need to enforce better efficiency policies to maintain ROE on previous levels.
We expect BES to follow with these practices in such way that these indicators will converge to their long-term average values, as demonstrated on the following graph:
Graph 29: Profitability Indicators (%)
With the evolution of the Banking business and regulation imposing limits on the leverage of banks, we expect to observe a decrease in ROE for the Portuguese Banking system in general, following the deleveraging effect and a slight increase on the ROA as a consequence of the higher efficiency expected.
BES is present in Angola through its major subsidiary, BES Angola, which started its operations in 2001 aiming to explore the immense growth potential of the region in the last decade. Angola is still one of the countries with higher GDP growth rate and is an economy mainly based on international trade. Oil and diamonds exports alone represent 95% of GDP, thus the performance of the economy is extremely
0 2 4 6 8 10 12 14 16 18 20
0% 2% 4% 6% 8% 10% 12% 14% 16%
18% ROE (lhs) ROA (lhs) A/E (rhs)
Source: Company Reports and Analyst Estimates
ROE will continue to fall in 2009
No longer room for such highly leveraged operations
PAGE 18/41 dependent on the prices of those two goods. Presently BES Angola accounts for 12% of the Group’s Net Income, and we expect it to represent 19% in 2015.
As a recent bank, BES Angola is now enlarging its operations and has initiated its Retail Banking activities recently, which is clearly reflected on its Balance Sheet, with the “usual” Retail Banking accounts (deposits, credit, etc...) now becoming significant. Despite this recent start, BES Angola is establishing as a major player in the Angolan market (market share of 10,1% in Deposits and 22,2% in Credit activities), capturing significant customer’s funds, and taking advantage of the know-how BES has in this kind of Banking services, its recognized efficiency (lower than Peers Cost-to-income ratios), the relation that Angola and Angolan companies have with Portugal and the Portuguese investors and entrepreneurs that are exploring the Angolan potentialities. Another advantage that we expect BES Angola to fully exploit during 2009 is the creation of the Angolan Stock Exchange, that will allow BES Angola to take advantage of all the qualities and recognition that BES have on Investment Banking services to capture a large share of those operations that will appear with the creation of the Stock Exchange.
Before the expansion for the Retail Banking, BES Angola relied on activities such as supporting the Angolan Government to place its securities on the market, conceding credit to local governmental institutions, and helping local institutions with the development of infrastructures. Those activities played an important role for BES Angola to secure its presence in the market, and especially the relation that BES Angola has with the Government (placing its securities on the market) ensured BES a significant growth of its Balance Sheet. We expect these activities to continue in the future, although they will not be as significant to the Balance Sheet as before, they will still represent a considerable portion of the bank’s revenues and operations.
Credit Activity
The evolution of credit activity in Angola can be explained by the situation of underdevelopment in the country. Since a substantial percentage of the Angolan population lives in precarious conditions, we do not expect Mortgage credit to significantly increase in real terms, as the population does not have means to access this market, or even because they have no information about it.
The same applies to Consumer & Other credit that will not evolve in the same way than it would grow in a developed country. Angola is characterized by low bancarization levels (deposits/GDP is 24% and credit/GDP is 12%,1 contrasting
with ratios above 100% in Europe), but we do not expect those indicators to change
1Source: Banco Nacional de Angola (BNA)
BES Angola is starting its Retail and Investment Banking activities
Main objective: provide support to the Portuguese companies operating in Angola
PAGE 19/41 0 50 100 150 0% 5% 10% 15% 20% ‐5% 0% 5% 10% 15% 20%
25% GDP growth
rate Inflation ‐ 2 4 6 8 ‐ 5 10 15 20
25 NPL (lhs)
P&L Provisioning (rhs)
significantly given the emerging condition of the country. The precarious life conditions of the population represent a major barrier to the credit, as only a small percentage of the population have social conditions to benefit from it.
On the corporate side we expect some growth, as multinational companies start to expand their operations to Angola and may rely on local financial players to support business. But we also need to take into account that almost all companies operating in Angola are multinational companies that have access to other markets to finance their activities. The downward trend of oil prices since 2008 (see Graph 22) is also carrying higher pressure for 2009, as it implies a poor performance of the overall economy (see Graph 23) and the economic implications that such slowdown brings to companies operating in Angola will negatively impact the Credit activity.
The credit portfolio of BES Angola is expected to growth, that is, new credit granting opportunities will appear, but this market is already fully explored under its own circumstances, leaving no margin for surprising evolutions on this field. To conclude with, we do not expect credit activity to growth significantly and representing one of the main drivers for the evolution of BES Angola. It is important to refer that though we do not expect credit granting activity to increase significantly, this is not synonymous that the margins charged on this activity will deteriorate radically, or that this activity will become unattractive (see Graph 24). What we really anticipate is that banks will not be able to lend as much as they which, given the attractiveness of the activity.
Asset Quality
In terms of the quality of its assets we believe that BES Angola is in good position to face adverse conditions. The NPL ratio is below the observed in European Operations, and we do not foresee a major escalation of NPL in the long term. We believe that credit risk will come mainly from the Corporate side, with the companies that are significantly dependent and influenced by exports and oil sectors facing serious difficulties to meet their obligations with the bank. Despite this long term expectation, NPL will raise indubitably in the next years (see Graph 25), but soon its growth will come back to values near the ones observed before the crisis start. In our opinion, bad credit will not have the same importance in Angola than it has in other developed countries (indebtedness level of families much lower than in Europe and companies financing their operations outside).
Loan Loss Provisions and Impairments will follow the same pace of NPL’s, as we do not see any reason that may lead the bank to significantly increase the amount of Impairments charged to the Loan portfolio. Default rates will become lower than in
Graph 22: Evolution of Oil Prices (Jan-07 to May-09)
Source: World Bank
Graph 24: Credit Spread Evolution (%) Graph 23: GDP and Inflation
Evolution (%)
Source: IMF
Source: Company Reports and Analyst Estimates
Graph 25: Evolution of NPL and P&L Credit Provisioning (US $ millions)
PAGE 20/41
0% 5% 10% 15% 20%
Europe and no important regulation is expected that may induce the bank to change its policies and methods of credit risk attribution. We believe that BES Angola will maintain the bad credit under control, obviously fluctuating according to the business cycles, but under values that do not trigger major concerns.
Table 10: Asset Quality Indicators (%)
2005 2006 2007 2008 2009E 2010E 2011E 2012E 2013E 2014E 2015E
NPL/Total Loans 0,68% 0,89% 0,77% 0,75% 0,93% 1,01% 1,13% 1,17% 1,03% 1,04% 0,98% 0,96%
Impairments/Total Loans 1,30% 2,16% 1,12% 0,45% 0,49% 0,63% 0,52% 0,51% 0,51% 0,51% 0,50% 0,46%
Coverage of NPL 141,8% 154,8% 123,9% 126,8% 146,6% 148,5% 136,6% 138,0% 131,7% 126,3% 122,4% 121,2%
Investment Banking Activity
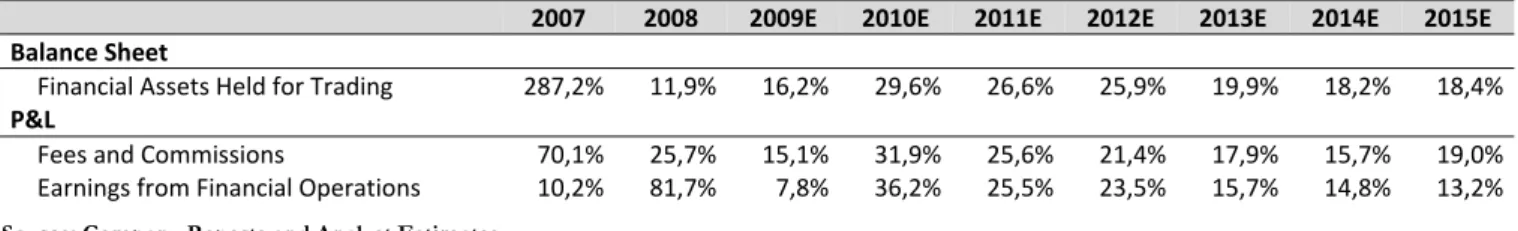
The Investment Banking activity will fully start in 2009 with the creation of the Angolan Stock Exchange, with clear impact on the portfolio of Assets Held for Trading and on Fees and Commissions along with Earnings from Financial Operations rubrics on the P&L (see Graph 26).
Table 11: Main changes implied by the development of Investment Banking Activity (%)
2007 2008 2009E 2010E 2011E 2012E 2013E 2014E 2015E
Balance Sheet
Financial Assets Held for Trading 287,2% 11,9% 16,2% 29,6% 26,6% 25,9% 19,9% 18,2% 18,4%
P&L
Fees and Commissions 70,1% 25,7% 15,1% 31,9% 25,6% 21,4% 17,9% 15,7% 19,0%
Earnings from Financial Operations 10,2% 81,7% 7,8% 36,2% 25,5% 23,5% 15,7% 14,8% 13,2%
We expect Earnings from Financial Operations to have a higher impact on the Results in the short term loosing then some of the amazing growth expected in the next couple of years. This source of revenues decreases as the activity becomes more developed and more banks enter in the market. Nevertheless we expect interesting growth rates on the long term, for this activity. It is important to stress that we expect Earnings from Financial Operations to grow only 7,8% in 2009 because the current financial crisis most likely will imply negative repercussions to newly created Stock Exchanges, letting small chances of initial impressing results.
A different situation is expected for the evolution of Fees and Commissions income since the possibility of launching new products like Pension Funds, Mutual Funds among other type of Funds, will allow the bank to increase and maintain Fees and Commissions extracted from this activity. We expect that on the long term, Fees and Commissions will be the item with higher growth rate of the P&L due to the stability of this type of income and the credibility and recognition BES has in this area (bank with higher market share in Investment Banking and Brokerage services in Portugal). Another important contribution for this effect relies on the regulation Source: Company Reports and Analyst Estimates
Angolan Stock Exchange: a window of new
opportunities
Fees & Commissions and Earnings from Fin. Opr. expected to growth 31,9% and 36,2%, respectively, in 2010
Graph 26: Impact of Investment Banking Activities on Banking Income (%)
Source: Company Reports and Analyst Estimates
PAGE 21/41
0% 10% 20% 30% 40% 50% 60% 70% 80%
0% 20% 40% 60% 80% 100% 120% 140% 160%
0% 2% 4% 6% 8% 10%
of this activity (Funds, regulation on the commissions charged, etc…), as we do not anticipate this activity to be as regulated in Angola, as it is in other developed countries (at least in the near future), leaving room for charging abnormally high values. A problem that may drive this source of income down is competition, but we also expect it to be low due to the small number of players with the expertise of BES in Investment Banking activities with presence in Angola.
The Investment Banking activity will also increase Interest and Similar Income, since we expect BES Angola to develop further the activity of trading for its own account, though generating extra profits from the trading process.
Deposits
We expect that capturing Deposits will be a difficult task for the bank, as the economic conditions of the country’s population and the low bancarization levels represent a big barrier. Given that a significant proportion of the population lives with income below subsistence levels, it is not expected that BES Angola would be able to capture the savings of those populations, simply because they do not exist.
On the Corporate side, companies will only held on banks the amounts needed for the day to day operations, since the money placed in the bank does not generate significant returns (only the interest rate offered by the bank).
Given those facts, Deposits capturing seems a difficult task for the bank that needs attention, or otherwise the bank must rely on the Interbank and Capital markets to finance its operations. Even with an effort made in cutting margins on Deposits we do not expect a significant increase in volume (demand for Deposits relatively insensitive to the rate offered), making this an inglorious battle for the bank.
This difficulty in Deposits capturing has its reflects on the difference between the market share in Credit granting activity and Deposits over 10% (22,2% vs 10,1%). This is a clear worrying sign for the bank’s profitability, as it will need to rely more on other, less profitable, sources of funding to support the assets evolution.
Results
We expect the Angolan market will continue to provide a constant level of margins (see Graph 29), which is coherent with the growth status of the country. With the Banking market enjoying from its premature situation, and the arrival of new activities that contribute for the slow expansion of the market without saturating it fast, will allow banks to benefit from such margins in the future. On the long term, as the market develops itself and banks continue to enjoy from such margins and profitability levels will inevitably attract more players to the market, driving margins
Graph 27: Loans-to-Deposits Ratio Evolution (%)
Source: Company Reports and Analyst Estimates
Graph 28: Deposits growth rate evolution (%)
Source: Company Reports and Analyst Estimates
Graph 29: Net Interest Margin (%)
PAGE 22/41
0% 10% 20% 30% 40% 50% 60%
0% 20% 40% 60% 80% 100%
‐
50 100
150 200 250
300 Evolution (lhs)
Growth Rate (rhs)
down. We expect this effect to be felt from 2014 on, with a gradual decrease of the margins.
On the cost side, we expect costs to rise with the introduction of the new activities, deteriorating the Cost-to-Income ratio (see Graph 30), as costs outweigh revenues for these new activities. This indicator has been low in the previous years (around 40%), but with the start of Investment Banking operations we expect it to rise and states around 50%. Despite this increase, we believe that there are margin to a favorable evolution in the future, as some expertise will be achieved, and some economies of scale arise.
Concerning Tangible Assets, we do not foresee a major expansion in terms of the physical network, since BES Angola is already present in the most important urban areas of the country. We consider that BES Angola will not expand to other regions, since it is not profitable to engage in such expansion due to the low development of the major part of the country. The regions on which makes practical sense to be physically present, BES Angola is already established. Despite this, the investment in physical assets will continue in order to improve the offered conditions and accommodate business expansion. These two effects justify the fact that we do not observe a jump in tangible assets and fixed costs as it would be expected under normal circumstances to comply with the high growth rates. We expect those items to rise in 2010 above other year’s values, as the development of Investment Banking activities implies higher costs in terms of tangible assets and personnel expenses.
Profitability Indicators
For Angola we expect ROE to show considerably high values in the following years, supported mainly to a significant increase in leverage, reflecting the opposite effect of the one expected in European Operations. We expect banks to take advantage of the low regulation in Angola to maintain its ROE in high levels, but at the expense of highly leveraged, and consequently more risky operations. With the deterioration in margins implied by the further development of the Banking activity and the reasons explained on the Results section, this level of ROE is not sustainable for the entire life of the Angolan operations, but it will take some time to be eroded.
Resuming, all these indicators are well above the values that we observe in more developed and mature markets, but due to the economic growth that the country has been showing and all its potential, for now, they make sense. Although on the long term it is impossible to maintain such high values, and consequently they will be pulled down towards more sustainable levels, but the time this adjustment may take remains unknown, as the country is characterized by political instability, and at
Graph 30: Cost-to-Income Ratio (%)
Source: Company Reports and Analyst Estimates
Investment Banking activity will deteriorate the Cost-to-Income ratio
Graph 31: General and Personnel Expenses Evolution (US $ million)
PAGE 23/41 any time some revolution or rebellion might occur and regulation can change radically, or even worst scenarios may happen.
Graph 32: Profitability Indicators (%)
BES is present in Brazil through a subsidiary of BES Investimento. BES Investimento do Brasil (BESI Brazil) is focused on Investment Banking activities, and has as a main partner Banco Bradesco, the largest Brazilian private bank. The main objective of the Group when it started its operations in Brazil was to provide services and support Portuguese companies with commercial relations with Brazil, along with being an alternative way to provide access to European Capital Markets for companies with operations in South America.
The main business areas of BESI Brazil are linked to corporations or governmental institutions. Those activities are spread through Risk Management, Project Finance, Corporate Finance, Capital Markets and Fixed Income trading, among others. In terms of Project Finance, BESI Brazil has been playing an important role in giving support to the Brazilian government in the construction of public infrastructures, such as, railways, power plants, subway lines, and others. BESI Brazil operations are only confined to Investment and Private Banking activities, without Retail or Commercial Banking operations. As natural for a business that is fully dependent on financial markets, BESI Brazil was seriously hurt by the current crisis. Being BESI Brazil an Investment Bank that had been growing very fast in previous years, these adverse conditions appeared in the form of low growth rates when compared to the ones observed in the recent past.
Brazil had been showing above average real GDP growth rates presenting characteristics that are halfway between an emerging and a developed country. Considering such characteristics, the option of being present in the country makes perfect sense, especially for Investment Banking activities. As the country moves
0 2 4 6 8 10 12 14
0% 10% 20% 30% 40% 50% 60% 70% 80% 90% 100%
2005 2006 2007 2008 2009E 2010E 2011E 2012E 2013E 2014E 2015E
ROE (lhs) ROA (lhs) A/E (rhs)
Source: Company Reports and Analyst Estimates
Brazil: Investment and Private Banking activities
High exposure to financial markets
B
RAZILO
PERATIONSPAGE 24/41
76% 78% 80% 82% 84% 86% 88% 90% 92%
‐2% 0% 2% 4% 6%
8% GDP growth rate Inflation
forward, more and more people would like to have access to financial markets, and even more important, companies present sustainable growth rates which imply that as companies became bigger and developed, they need more complex services and support from banks, but also more help and assistance to finance their growth.
BESI Brazil has a strong presence in the Brazilian market benefiting from the presence of its partner (Banco Bradesco) to capture market share on Investment Banking activities (9,6% in 2006, 10,2% in 2007 and 9,9% in 2008). BESI Brazil represented in 2008 6,8% of the Group’s Net Income.
Investment Banking Activity
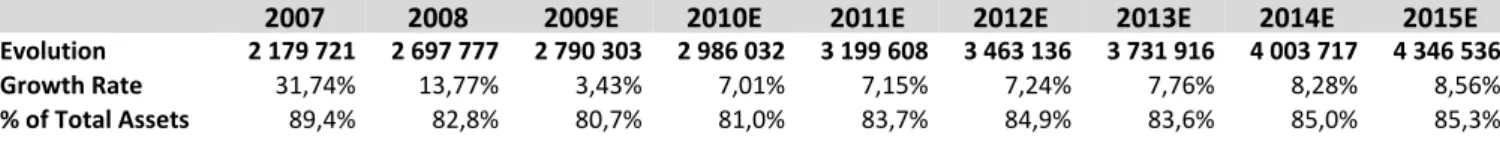
The core assets of BESI Brazil are Financial Assets Held for Trading (see Graph 33) that have been growing at impressive rates in the past, reflecting the growth of the country’s economy and the market share gains of the bank. Being so dependent on financial markets makes the Balance Sheet of the bank very risky, fluctuating in parallel with the market intrinsic volatility.
With the activity focused only on this segment, the evolution and profitability of the bank depend on the performance of the stock market. Given the behavior of the market and the necessary improvements that the bank needs to make to gain a higher market share, we do not expect to observe again growth rates above 20% as it was common in the last few years. We expect this activity to growth slowly from now on, reveling no significant gains or losses on market share and with a special focus being directed to Finance Project activities in which BESI Brazil recently contributed with two projects for the Top 5 major projects in Brazil, gaining a good position to continue with this activity.
Table 12: Financial Assets Held for Trading Evolution (Real '000)
2007 2008 2009E 2010E 2011E 2012E 2013E 2014E 2015E
Evolution 2 179 721 2 697 777 2 790 303 2 986 032 3 199 608 3 463 136 3 731 916 4 003 717 4 346 536 Growth Rate 31,74% 13,77% 3,43% 7,01% 7,15% 7,24% 7,76% 8,28% 8,56%
% of Total Assets 89,4% 82,8% 80,7% 81,0% 83,7% 84,9% 83,6% 85,0% 85,3%
On the short term the evolution of this portfolio will reflect the economic conditions of the country (see Graph 34) and the impact of the current financial crisis on the market. It is difficult for the bank to have good results when 80% of its assets performance is dependent on the stock market, and the latter is going through one of the largest crisis in history. In our perspective, the growing economy status of Brazil will help to attenuate the negative effects of the crisis, and will make the recovery less painful.
Graph 33: Financial Assets Held for Trading as a percentage of Total Assets
Source: Company Reports and Analyst Estimates Source: Company Reports
and Analyst Estimates
Graph 34: GDP and Inflation Evolution (%)
PAGE 25/41
64% 65% 66% 67% 68% 69% 70% 71% 72% 73% 0% 20% 40% 60% 80% 100%
Since BESI Brazil has no Retail Banking activity at all, Loans and Advances to Customers item on the Balance Sheet comprises only some loans the bank made to its clients, in terms of the normal evolution of its Investment Banking activities, like clients that entered in some position without having advanced the money, or because the counterparts do not comply for some reason with the payment agreement. It is natural that the evolution of this item is strongly linked with the evolution of the trading activity of the bank, without representing a significant percentage of the bank’s assets.
Held to Maturity Investments are mainly bonds held for risk management purposes, and its evolution is equally linked to the evolution of the activity, being continuously updated to ensure that risk management policies are met. Since they are kept on the Balance Sheet until its maturity, they represent an additional source of risk for the bank, as interest rates might change, but the low volume also makes this risk small.
Financing Sources
BESI Brazil finances its operation mainly with its clients deposits that we expect to grow more or less proportionally with the assets the bank held’s for trade, due to their interrelated nature.This source of funds have been decreasing in terms of the assets it represents on the Balance Sheet (see Graph 35) which is a sign that the bank is relying more on other sources to finance its activities. It is important to stress that we are talking mainly about corporate and institutional Deposits, as the proportion of individual Deposits is quite small. Given the inability of the bank to capture “usual” customer Deposits, we expect this origin of funds to lose some of its importance, as the bank will count more with other types of funds, namely from Capital and Interbank markets.
On the short term, we expect Deposits to growth less in 2009 following the observed trend of 2008 as a consequence of the low liquidity situation of companies, and the pessimism about Financial Markets. Before the stock market starts a clear upward trend, we do not expect a significant amount of clients placing more money in the bank.
Another important source of funding for the bank relies on the Debt Securities it issues but also Open Market Operations, that combined have almost the same importance of Deposits. The bank relies on this source of financing to fill the gap of the assets that is not supported by Deposits, in order to maintain its organic growth. With the overall growth trend of Investment Banking services in Brazil, we expect BESI Brazil to slightly increase the dependence on those types of sources of funding relative to clients Deposits (see Graph 36).
Assets under management will fall due to the financial crisis
Graph 36: Securities Issued as a percentage of Deposits
Source: Company Reports and Analyst Estimates
Graph 35: Deposits as a percentage of the Held for Trade portfolio (%)