A Work Project, presented as part of the requirements for the Award of a Master Degree in Economics /
Finance / Management from the NOVA – School of Business and Economics.
SPOTIFY’S EQUITY RESEARCH
AFONSO BALDAQUE MARINHO PESSANHA | 34444
FRANCISCO MARIA KOEHLER MONTEIRO DA
SILVA | 33910
A Project carried out on the Master in Finance Program, under the supervision of:
Francisco Martins
Abstract
The report consist in an Equity Research on Spotify, which is the largest
platform that allows users to listen music and podcasts. The music streaming
market is expected to grow at CAGR of 14.6% until 2026. Spotify has a clear
competitive advantage in relation to its competitors as its platform offers more
features and its prices are in line with them. Spotify has exposure to the Chinese
market through its 9% investment in TME, which is the largest music streaming
company in China. Therefore, we expect a price per share of 182.24$, which
corresponds to a 21.9% return in 2020.
Keywords
Music Streaming
Podcasts
Emerging Markets
Competitive Advantage
This work used infrastructure and resources funded by Fundação para a Ciência e a Tecnologia
(UID/ECO/00124/2013, UID/ECO/00124/2019 and Social Sciences DataLab, Project 22209), POR
Lisboa (LISBOA-01-0145-FEDER-007722 and Social Sciences DataLab, Project 22209) and POR Norte
(Social Sciences DataLab, Project 22209).
MASTER IN FINANCE
THIS REPORT WAS PREPARED EXCLUSIVELY FOR ACADEMIC PURPOSES BY AFONSO PESSANHA AND FRANCISCO KOEHLER,MASTER IN FINANCE STUDENTS OF THE NOVA SCHOOL OF BUSINESS AND ECONOMICS.THE REPORT WAS SUPERVISED BY A NOVA SBE
FACULTY MEMBER, ACTING IN A MERE ACADEMIC CAPACITY, WHO REVIEWED THE VALUATION METHODOLOGY AND THE FINANCIAL
MODEL.
(PLEASE REFER TO THE DISCLOSURES AND DISCLAIMERS AT END OF THE DOCUMENT)
Page 1/32
The online music streaming market is expected to grow
14.6% annually between 2017 and 2026, reaching a value of $45.4 billion in 2026. Spotify is expected to grow faster than the market due its competitive advantages. We forecast Spotify’s market share to grow from 30% to 46%.
Spotify has 113 million subscribers, almost twice as
Apple, the second largest global music subscription service. We
estimate a premium subscribers’ CAGR18-30 of 14.5%.
Spotify’s expansion to emerging markets will sustain
growth in users for a long time. For instance, the entrance in India, which occurred in February 2019, achieved 2 million MAUs in one month.
The churn rate is expected to decrease to 4% due to
growth of Family/Student plans and the wide variety of features Spotify is introducing (podcasts, music videos, radio stations).
Spotify has a 9% investment in TME, the leading online
music entertainment platform in China, which we valued at 927 million €.
Spotify has an active position in the market, having
bought Gimlet Media and Parcasts and made a partnership with HigherGround, which reinforced its position in Podcasting market.
Company description
Spotify was launched in 2008 and it is a platform that allows its users to listen music and podcasts in computers, tablets and mobile devices either for free or through a paid premium version. It is present in 79 countries all over the world and it has 248 million Monthly Active Users and 113 million subscribers.
S
POTIFY
T
ECHNOLOGY
S.A.
C
OMPANY
R
EPORT
M
USIC STREAMING
03
J
ANUARY2020
A
FONSOP
ESSANHA|
F
RANCISCO KOEHLER[email protected] | [email protected]
Spotify’s dominance in the market
The largest global mus
ic subscription service…
Recommendation: BUY
Price Target FY20: $ 182.24
Price (as of 31-Dec-2020) $149.55
Reuters: SPOT.N, Bloomberg: SPOT US Equity
52-week range ($) 109.02-157.66 Market Cap ($b) 26.88 Outstanding Shares (m) 179.74 2020 Shareholder’s return 21.9% Source: Bloomberg Source: Bloomberg
(Values in € millions) 2017 2018 2019E
Revenues 4,090 5,259 6,802 EBITDA (324) (11) 90 Net Profit (1,235) (78) 21 EPS (7) (0.44) 0.12 P/E (19) (307) 1,139 Capex n.a. 145 670 R&D expenses 396 493 613
Sales & Marketing expenses 567 620 762
SPOTIFY TECHNOLOGY S.A. COMPANY REPORT PAGE 2/32
Table of Contents
COMPANY OVERVIEW ... 3
COMPANY DESCRIPTION ... 3 BUSINESS MODEL ... 3 FINANCIAL OVERVIEW ... 4SHAREHOLDER STRUCTURE AND RETURN ... 5
INDUSTRY OVERVIEW ... 6
MACROECONOMIC OUTLOOK ... 6
MUSIC STREAMING SECTOR ... 7
PEERS ... 10 PRESENCE OF SPOTIFY ... 11 INVESTMENT RISKS ... 14
VALUATION ...15
KEY VALUE DRIVERS ... 15 FORECASTING ... 17 CONTINUING VALUE ... 20DISCOUNT RATE ESTIMATION ... 21
DISCOUNTED CASH FLOWS METHOD (DCF) ... 22
SENSITIVITY ANALYSIS ... 23
SCENARIO ANALYSIS ... 24
RELATIVE VALUATION ...25
FINAL RECOMMENDATION ...25
APPENDIX ...26
REVENUE FORECASTING MODEL ... 26
INCOME STATEMENT ... 27
BALANCE SHEET ... 28
CASH FLOW STATEMENT ... 29
DISCLOSURES AND DISCLAIMERS ...30
SPOTIFY TECHNOLOGY S.A. COMPANY REPORT
PAGE 3/32 Figure 1: Spotify's logo
Source: Google images
Company Overview
Company Description
Founded by Daniel Ek and Martin Lorzenton in 2006, Spotify Technology S.A.1 is
a Swedish company that revolutionized the music listening. Launched in 2008, Spotify2 is a platform that allows its users to listen music and podcasts in
computers, tablets and mobile devices either for free or through a paid premium version. With approximately 4,000 full-time employees3 spread in 23 countries,
the company’s mission is to “unlock the potential of human creativity by giving a million creative artists the opportunity to live off their art and billions of fans the opportunity to enjoy and be inspired by these creators”.
In order to reach its mission, Spotify has paid more than 10 billion euros in royalties to rights holders and, currently, has more than 50 million tracks available in the platform. In that context, the company reached today approximately 248 million MAUs (Monthly Active Users) and 113 million subscribers. As a consequence, Spotify has become the largest global music subscription service, followed by Apple, the second largest with 60 million subscribers, which has almost half of the Spotify’s subscribers.
Spotify is a global platform that is present in 79 countries all over the world and is growing in each of the four geographic regions. Europe is the largest one with 76 million MAUs, which represent 35% of the total MAUs, followed by North America with 27% of the total MAUs. However, the two fastest growing regions are the Latin America and the Rest of the World with 22% and 16% of the total MAUs, respectively. In addition, the three largest markets in terms of MAUs are the United States, Brazil and United Kingdom. (Figure 2)
Business Model
In the past, before the appearance of Spotify, the music industry was a “transaction-based” experience where the users needed to buy music to own them. Or, as an alternative, users could also listen music in the traditional radios, which is a “linear distribution” model where the channels are programmed to deliver a limited song selection with no choice to its users. Nowadays, Spotify
has transformed the way people access music by implementing an
“access-based” model, which offers an unlimited music streaming.
1 Spotify Technology S.A. is the legal name.
2 Spotify is the commercial name, which is the one that will be used throughout the report.
3 Most of the full-time employees are located in the United States, Sweden and United Kingdom.
Largest global music streaming subscription service…
Spotify has transformed the way people access and enjoy music…
Figure 2: Spotify’s presence all over the world
SPOTIFY TECHNOLOGY S.A. COMPANY REPORT
PAGE 4/32 Graph 1: Revenues vs Net income in
million € (2016-2018)
Source: Spotify’s annual report
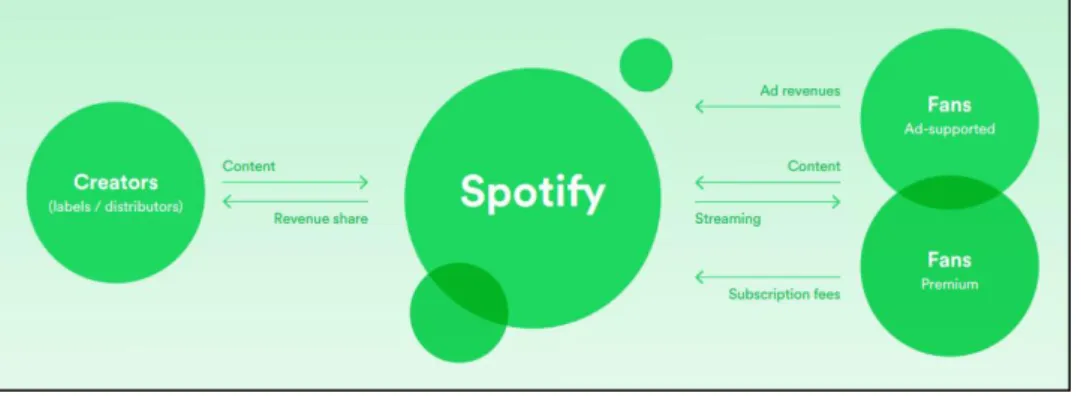
The business is composed by two segments – the premium and the
ad-supported service, which is a free offering. Despite the price, the main differences are that the free service is supported by ads, is only available online and, in the mobile app, it is only possible to listen on shuffle mode or pre-made playlist as it is not possible to select the track you want to listen. In contrast, the premium service has no ads, is available both online and offline and it is possible to listen any track you want in the mobile app. In addition to this, the ad-supported service is only available on computers, tablets and mobile devices, while the premium users can also connect through speakers, receivers, televisions, cars, game consoles and smart watches. Also, the premium service has a better audio quality when compared to the ad-supported.
In fact, both segments live independently but they are somehow correlated since engagement drives conversion. In that context, the ad-supported service serves as a way to convert users into the premium service. Therefore, as of December 2018, approximately 50% of the MAUs became premium subscribers with 36 months on average.
In sum, the business model is simple to understand. On one hand, Spotify receives content from the creators and gives them royalties. On the other hand, the company receives ad revenues from the ad-supported users and subscription fees from the premium users and gives both an unlimited music streaming with the differences between services already mentioned. (Figure 3)
Financial Overview
Revenues are growing at a high pace in the recent years. In fact, revenues grew 52% in 2016, 39% in 2017 and 29% in 2018. Despite this exceptional growth, the net income continues to be negative year after year. This is due to the fact that the cost of revenues, which mainly comprises royalties to rights holders, were almost 80% of the total revenues, on average. It is important to state that, in 2017, the net income was affected by a high amount paid related to finance costs (974
Engagement drives conversion…
Figure 3: Spotify's business model Source: Spotify’s sustainability report
Ad-supported vs premium…
SPOTIFY TECHNOLOGY S.A. COMPANY REPORT
PAGE 5/32 Graph 2: Revenues per business
segment in % (2018)
Source: Spotify’s annual report
Graph 4: Revenues per region in % (2018)
Source: Spotify’s annual report Graph 3: Revenues per business segment in million € (2016-2018) Source: Spotify’s annual report
Graph 5: Revenues per region in million € (2016-2018)
Source: Spotify’s annual report
million €). Conversely, in the third quarter of 2019, Spotify had a positive net income for the first time, which is related to the finance income of 226 million € in that period.
Regarding the revenues per business segment, in 2018 the premium service represented 90% of the total revenues, while the ad-supported service represented only 10%. (Graph 2)
Despite the fact that the revenues generated by the premium service are much larger, the revenues generated by the ad-supported service have been growing at a higher pace. In fact, the revenues from the ad-supported service grew 41% in 2017 and 30% in 2018, while the revenues from the premium service grew 38% in 2017 and 28% in 2018. Therefore, the ad-supported service has the stability and the potential to continue to grow. This is relevant since, as mentioned before, the ad-supported service is a driver for the growth in the number of premium users. (Graph 3)
In terms of revenues per geographical region, Spotify segments its revenues between United States, United Kingdom, Luxembourg and Other Countries. In 2018, the majority of the revenues were generated from users in Other Countries (51%), followed by the United States (38%), United Kingdom (11%) and Luxembourg (0%) with almost no impact. (Graph 4)
In addition, in every location the revenues have been growing in the past years. However, the region with the highest growth was Other Countries, which grew 44% in 2017 and 31% in 2018. In the United States the revenues grew 34% in 2017 and 25% in 2018, while in the United Kingdom the growth was 30% in both years. (Graph 5)
Shareholder Structure and Return
On April 3, 2018, Spotify completed a direct listing of the company’s ordinary shares on the NYSE under the symbol “SPOT”. Its initial public offering started with a share price of $147.92 and since then, it has been very volatile. In fact, the price has ranged from $103.29 to $198.99, causing a return of -30% and 35% in the worst- and best-case scenario, respectively, assuming that an investor holds
the stock since the IPO. Currently (as of 31th December 2019) Spotify’s market
cap is $26.88 billion, which corresponds to 179.74 million shares outstanding at a price of $149.55. (Graph 6)
Regarding the capital structure, Spotify is financed by debt (adoption of IFRS 16 regarding leases) and equity. In fact, the D/E of Spotify is 31.82%, assuming no excess cash. However, the company has a high amount of excess cash, leading
Large amounts of excess cash…
Graph 6: Spotify's stock price in $ (2018-2019)
SPOTIFY TECHNOLOGY S.A. COMPANY REPORT
PAGE 6/32 Graph 7: Percent of total voting power
(2018)
Source: Spotify’s annual report
to a negative net debt. Besides this, the company has never paid any dividends and it is not expected to pay in the foreseeable future.
As of December 31, 2018, the founders Daniel Ek and Martin Lorentzon owned the majority of the ordinary shares and beneficiary certificates, representing 77.9% in the aggregate of the combined voting power of all the voting securities. The rest is hold by Other (14.8%), Baillie Gifford & Co (3.2%), Tiger Global (2.3%) and Entities affiliated with TCV (1.8%). (Graph 7)
Since the beginning, the founders created Spotify with the purpose of continuing as majority shareholders. Aligning this with their background in entrepreneurship and technology, its presence is considered to be beneficial for the company. In addition, Daniel Ek and his management team have a proved track record:
Daniel Ek (CEO): CTO of Stardoll, which is one of the largest online
fashion communities, and the CEO of μTorrent.
Martin Lorentzon (Co-founder): founder of TrableDoubler (an internet
marketing company) and member of the board of directors of Telia Company AB (Sweden’s main telecom operator).
Barry McCarthy (CFO): CFO of Netflix and member of the board of
directors of several companies such as Pandora (Spotify’s competitor).
Industry Overview
Macroeconomic Outlook
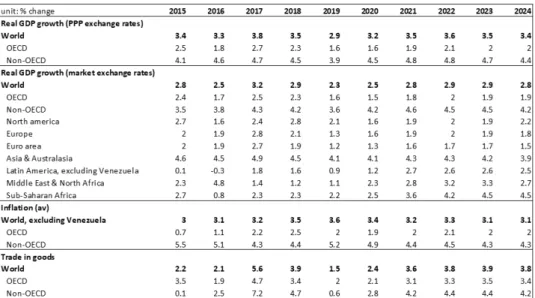
Since the end of the great depression in 2007 and the sovereign debt crisis in Europe in 2012, the world has experienced a strong growth, both in developed markets and developing markets. This expansion cycle has broken apparently this year, 2019, where the major economies in the world experienced a slower growth. According to the Table 1, the real GDP growth is estimated to slow down in every region across the globe in 2019, with no exception. It is important to highlight that in Europe the real GDP growth had already decreased in 2018, in comparison with 2017. The percentage change in the trade of goods also experienced the slowest growth in 2019 (1.5%), when compared with the previous and following periods under analysis.
World GDP growth slowed down in 2019…
Spotify has a qualified management team…
SPOTIFY TECHNOLOGY S.A. COMPANY REPORT
PAGE 7/32
Despite the 2019’s slowdown, the World real GDP growth is expected to
increase its growth from 2020 onwards. This growth will be sustained by the emerging markets, which are expected to have a stronger growth. North America is expected to slow down even more in 2020. After that, it is expected to recover, but not reaching previous year’s results in the forecasted time horizon. Similar trends are expected in Asia due to US-China trade war that is already severely
affecting these two economies
.
Music Streaming Sector
Before diving into the music streaming sector, it is important to make a brief overview of the global recorded music industry, which is made of not only digital content and streaming, but also physical content, performance rights and synchronization.
After more than 14 years in decline, the industry started recovering in 2015, reaching $19.1 billion revenues in 2018. The evolution was the result of the transition from physical products to streaming content, which is sustaining the rapid recovering of the industry. It peaked in 1999 with $24 billion revenues and it did not exceed this value until today, which shows the potential growth it has after this period. (Graph 8)
Moreover, as the music sector is included in the entertaining industry, whose growth tends to be correlated with the business cycle, this potential growth also indicates that this sector may not be affected severely in case the economy contracts. In fact, the sector is near historical lows and have strong growth dynamics, as it will be shown in the next paragraphs, which will sustain growth in the coming years.
A recovery is expected though…
Table 1: World economy indicators Source: Economist Intelligence Unit
Graph 8: Global recorded music industry revenues in billion $
SPOTIFY TECHNOLOGY S.A. COMPANY REPORT
PAGE 8/32 Graph 11: Number of paying online music
service subscribers worldwide in million € Source: IFPI
Graph 10: Global smartphone ownership and penetration
Source: PwC Global Media and entertainment Outlook
Moving to the music streaming market, it is made of revenues coming from subscription service fees and ad-supported (advertising-related). This market has experienced very strong growth in recent years, reaching $19.6 billion revenues in 2018, with the subscription segment representing 83.6 % and the ad-supported segment 16.4%. (Graph 9)
The growth of this sector has been driven not only by the expansion of high-speed internet, connected devices and cloud technologies, but also by the emergence of technologies in music streaming delivery. In fact, the increase on the global smartphone penetration explains, in part, the evolution of the sector. (Graph 10)
As a result of a growing sector, a number of players have entered the market. Spotify is the market leader, however some companies such as Apple, Google and Amazon has been extending its services to include music streaming as well as small new players (e.g. Pandora and Tidal).
One of the main threats against the sector is the value gap, which is the mismatch between the value obtained by digital service providers (such as Youtube) on their platforms and the revenue returned to the artists. This is also related to websites where it is possible, illegally, to download music content for free. This creates unfair competition against music streaming platforms. However, it is expected that stricter laws and regulation will appear to prevent this hurdle. According to a report of International Federation of the Phonographic Industry (IFPI), 38% of music consumers are still downloading or using illegal means to listen to music, which shows the potential of music streaming market. In spite of value gap threat, the number of paying online music service subscribers globally has increasing significantly from 2010 to 2018, having increased almost thirtyfold. (Graph 11)
This shows that value gap is not preventing the growth of the sector and that consumers are more willing to pay for content that is free of advertisements. In fact, it is expected a global online music streaming market’s compound annual growth rate between 2017 and 2026 of 14.6%, reaching revenues of $45.4 billion in 2026. (Graph 9)
This growth will be sustained not only by the reasons presented above, but also, and essentially, by the growth in countries where there is today a low penetration rate of 4G LTE, due to the improvement of the internet connection and mobile penetration in the future, which will make accessible to the population online music streaming services. Moreover, the 5G technology will also drive growth, given the improvement of internet connectivity across the globe.
Value gap is threating the sector…
Internet penetration, 4G and 5G will boost the sector…
Graph 9: Global online music streaming revenues forecast in billion $
SPOTIFY TECHNOLOGY S.A. COMPANY REPORT
PAGE 9/32 Graph 12: Global online music streaming
market grography segmentation Source: Marketline
In terms of geographic segmentation, the United States represents almost two-thirds of this market. Germany, France and Japan are far behind the US, with together 24.1% of the market. In Germany and Japan physical sales are still popular, however music streaming has already had a strong growth. Areas such as Asia-Pacific are expected to have a significant growth in the coming years as internet connectivity and penetration are extremely low compared to US and Europe and outstanding improvements are expected. (Graph 12)
Five Forces Analysis
In this analysis, online music streaming companies are being referred as players, individual consumers as buyers and producers and license holders as suppliers. Buyers are small and numerous. They are able to cancel for free subscriptions. Therefore, and knowing that there is little differentiation between players, they easily move from one to another based on price, recommendations and brand image. The competition may drive the price down, but buyers individually cannot affect prices. So, their bargaining power is considered moderate.
Suppliers are large, multinational and powerful companies. Their industry operates as an oligopoly. Universal Music, Sony Music and Warner Music represent approximately 70% of the total recorded music market and 50% of the publishing market. This gives them an enormous control over music content. There are a small number of independent record companies, which helps reduce the market dominance, however it is not enough and even the artists that create the content have minimal power. Nonetheless, record labels are being criticized for not paying enough money to artists and making deceiving contracts with them. Moreover, recent trends such as rise of home recording, crowdfunding, social networks and music TV shows have been creating alternatives for artists to spread their music and become famous without depending on record labels. There are also emerging companies that do not keep the music rights, just charging a fee for the services artists want. This is good for artists that are already known in the market (the rise of social networks eased this as said before), which do not need advances and development. As a result, and knowing that music streaming companies cannot provide their services without the rights, suppliers have a strong bargaining power. Nonetheless, with the decline of the market share of record labels that keep the rights of the artists, streaming companies will have more power in the negotiation and the fees paid will decline due to “disintermediation”.
New entrants. The supremacy of current players makes it difficult for new entrants, especially if they do not have enough financial power to take over the mass market. Current players have a good image towards the buyers and are
Buyers bargaining power is moderate…
Suppliers bargaining power is high…
The threat of new entrants is moderate…
SPOTIFY TECHNOLOGY S.A. COMPANY REPORT
PAGE 10/32
trusted, which makes easier to obtain contracts with suppliers. Therefore, we believe it is possible to enter this market as a small niche offering or an existing company expanding its operations (what Apple, Google and Amazon did). In fact, the strong growth expected in this sector may attract new players and, therefore, the threat of new entrants is moderate.
Threat of substitutes. CDs continue in a sharp decline. Vinyl sales have increased in recent years. Youtube is seen as the biggest substitute of online music streaming as it provides a similar service and has increased twofold its revenues between 2013 and 2016. Moreover, online music streaming is considered as a leisure product and so it has indirect competition from other recreational goods, such as gaming, museums and social networking. Therefore, the threat of substitutes when considering music streaming as an entertainment activity is strong.
Rivalry. This market is highly concentrated, with a small number of large, multinational companies, such as Spotify, Google, Apple, Amazon, Pandora, Tidal, among others. As buyers can change easily between them, rivalry between them is stimulated. Therefore, and as there is little differentiation in its core service, companies need to come up with different offerings to attract and retain buyers and the competitors need to be cautious to not be behind them. For example, the development by Apple and Amazon of smart speakers led Spotify to start developing a smart speaker. Moreover, the market is relatively easy to exit as there is no physical products involved and most of the costs are variable. As a result, we consider the degree of rivalry moderate, considering it is reduced by the strong growth the overall market will likely have in the future.
Peers
Spotify competes for the time and attention of users with other content providers in a large number of factors, such as price, quality of experience, relevance and diversity of content, ease of use, accessibility, reputation, among others.
Nowadays, some of the competitors of Spotify are Apple Music, Google Play Music, Amazon Music, YouTube Music, Tidal, Pandora, Deezer, SoundCloud, Napster, Joox, among others. However, this might change very quickly since the industry is characterized by rapidly changing market requirements and emergence of new competitors.
The key differentiating factor between Spotify and other music content providers is their ability to predict music that the users will enjoy. This is explained by the advanced data analytics systems and algorithms that the company has.
The threat of substitutes is strong…
Rivalry is moderate, at least in medium-term…
Spotify competes in a large number of factors…
Spotify’s key differentiating factor…
SPOTIFY TECHNOLOGY S.A. COMPANY REPORT
PAGE 11/32
Spotify is making significant moves in Podcasting…
However, Spotify needs to enhance and improve the existing service in a continuous way, by introducing new services and features with additional technological advances and an adaptable platform to continue to be the largest global music subscription service.
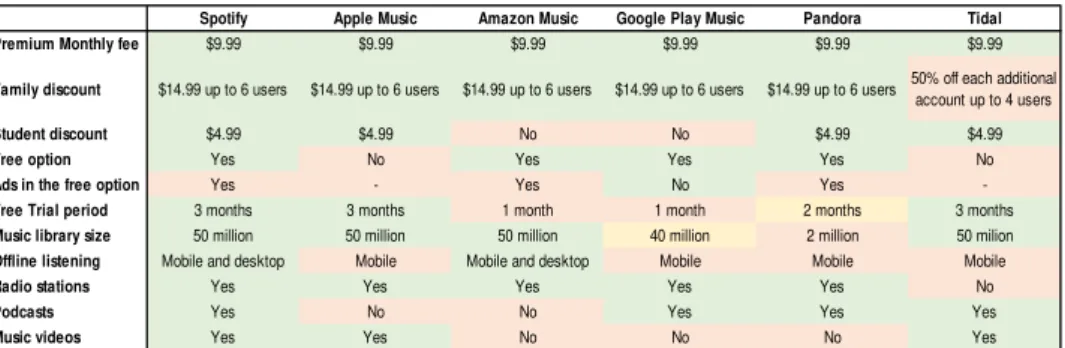
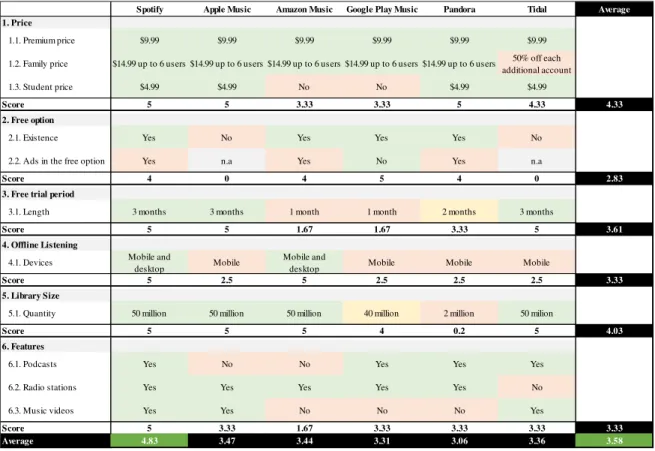
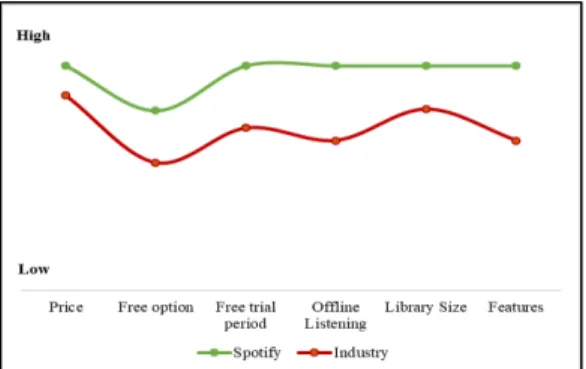
As it is possible to observe in Table 24, Spotify is the leader in most of the
factors of competition presented. In fact, when comparing with the main competitors, Spotify only loses to Google for the fact that its free service is supported by ads. Therefore, when aggregating all the factors, it is possible to conclude that Spotify has a competitive advantage among its competitors.
In relation to peer profitability analysis, the companies chosen were the comparables - the ones that are listed and that are offering a similar service or that have a similar cost structure (Netflix).
Apple, Amazon and Google are the ones with higher revenues5, which is
explained by the different businesses units each company has. In terms of EBIT Margin, Google has the highest one (19.2%), followed by TME (17.39%), Apple (11.6%), Netflix (10.2%), Amazon (5.3%), Spotify (-0.8%) and Pandora (-23.0%). Regarding the asset turnover (i.e. how efficient a company is using its assets to generate revenue), the most efficient is Amazon (1.4), followed by Spotify and Pandora (1.2), Apple (0.7), Netflix and Google (0.6) and TME (0.4). (Figure 4)
Presence of Spotify
Podcasting market
Spotify made several moves to get into Podcasting industry. The company bought Gimlet Media, which is a digital media company and podcast network, focused on producing narrative podcasts. It also bought Parcasts, which is a podcast network that specializes in crime, and Anchor, which is a platform where it is possible to distribute and monetize one’s podcasts for free. In addition, it made a partnership
4 The colour “green” means that the service is the best among the competitors and the “red” the worst. The “yellow” means that it is in
the middle.
5 The size of the bubble represents the revenues.
Improve the service in a continuous way…
Spotify’s competitive advantage…
Figure 4: Spotify and competitors’ profitability
Source: Companies’ Annual Reports
Table 2: Industry’s factors of competition Source: Companies’ websites
Spotify Apple Music Amazon Music Google Play Music Pandora Tidal
Premium Monthly fee $9.99 $9.99 $9.99 $9.99 $9.99 $9.99
Family discount $14.99 up to 6 users $14.99 up to 6 users $14.99 up to 6 users $14.99 up to 6 users $14.99 up to 6 users 50% off each additional account up to 4 users
Student discount $4.99 $4.99 No No $4.99 $4.99
Free option Yes No Yes Yes Yes No
Ads in the free option Yes - Yes No Yes
-Free Trial period 3 months 3 months 1 month 1 month 2 months 3 months
Music library size 50 million 50 million 50 million 40 million 2 million 50 milion Offline listening Mobile and desktop Mobile Mobile and desktop Mobile Mobile Mobile
Radio stations Yes Yes Yes Yes Yes No
Podcasts Yes No No Yes Yes Yes
SPOTIFY TECHNOLOGY S.A. COMPANY REPORT
PAGE 12/32 Graph 13: Monthly US podcast listeners in
millions
Source: Edison research
Graph 15: Music industry revenue in China from 2012 to 2018 in billion yuan Source: Statista
with Mr. Barack Obama and its wife Michelle Obama’s production company, Higher Ground, to produce exclusive content for Spotify.
Today, podcasting represents less than 10% of the streams, but audiences almost doubled since the beginning of 2019. Therefore, the entrance in this market not only attracts subscribers, but also increase consumer satisfaction through service differentiation, which improves users’ engagement and reduces the churn rate. All of this is reflected in profit margins due to economies of scale. This will not affect ARPU (Average Revenue per User) as there has been having some price-based competition, which put downward pressure on prices.
Finally, to have a grasp of this market, the US podcast monthly listeners have been increasing and are expected to increase in the future. The cumulative annual growth rate between 2014 and 2018 was 17.8% and between 2018 and 2021 is projected to be 12.3%. (Graph 13)
Chinese Market
Spotify has a 9% investment in Tencent Music Entertainment (TME) valued on its Balance Sheet at 1.7 billion € reported on the third quarter. TME is the leading online music entertainment platform in China, operating four highly popular and innovative music app in China: QQ Music, Kugou Music, Kuwo Music and WeSign. The first three apps are the largest music apps in China with a combined 700 million MAUs (Monthly Active Users). Recently, TME signed a deal with a NetEase, which is a Chinese digital giant, to share 99% of all content to which they hold rights. (Graph 14)
Therefore, Spotify has exposure in the rapidly growing Chinese market via this investment. TME is a public company trading on NYSE since December 12,
2018. In that year, it generated revenues of 2.45 billion €, a gross margin of 935
million €, a margin EBITDA of 21% and a net income of 230 million €6. The
upside potential of this investment comes from the fact that the copyright protection laws improved substantial in the last few years. As a result, knowing that the marketplace has been having a double digit growth and the music industry revenue at c. 7% annually, we believe that TME is going to continue to grow in the following years at a strong pace. (Graph 15)
TME’s current market cap is 17.22 billion €7, which corresponds to a market
value of Spotify’s 9% stake of 1.55 billion €. By using the same multiples (same industry, same comparables) presented in the relative valuation chapter, TME’s enterprise value is 10.30 billion €. Therefore, under this valuation method,
6 This values were converted at current Yuan to Euros exchange rate.
7This values were converted at current USD to Euros exchange rate.
Graph 14: TME’s revenue evolution from 2016 to 2018 in billion yuan
SPOTIFY TECHNOLOGY S.A. COMPANY REPORT
PAGE 13/32 Graph 16: Spotify’s client’s demographics
Source: Spotify’s annual report
Spotify’s stake is worth 927 million €, which will be the value used in our valuation for “Long-term investments” caption.
Spotify’s activity in the market
One of the main risks of streaming companies is the low power they have towards its suppliers, i.e., producers and license holders (record labels). As a consequence, we were alleviated when was released the new agreement of Spotify with two of its four major record label companies since a non-agreement would be mean less music offer for clients. Besides that, there is also a discussion ongoing with the two other record labels. Disclosure of the details of the deals were not made by management.
There is also another factor that gives us a positive feeling about Spotify’s future growth: young demographics of users. In fact, almost 50% of the users are under the age of 25 and more than 70% of the users are under the age of 35. This makes a long-term relationship more probable and with a higher average period. (Graph 16)
In addition to the acquisitions related to the Podcasts industry, there are other moves Spotify is making. In September, it acquired Soundbetter, which is a global audio production and collaboration marketplace helping creators worldwide connect and hire top audio professionals, with currently around 180,000 users.
Spotify also launched a product that transforms both artist and record labels as potential customers. The idea is that the platform would give a valuable information regarding optimization of tours, new artist discovery, and also allow the promotion of artist and albums, which, in the end, would allow a record label to give an advantage over its rivals. In case all record labels use the platform, the competitive advantage vanishes, but is still a win-win situation for all players. Therefore, we think that Spotify will maintain its current position, since it has a more global reach than its competitors and, although many deep-pocketed companies have tried to penetrate the market, it was able to grow at a strong pace due to its competitive advantage. Moreover, as said before, the expansion to emerging markets, such as India (occurred in February 2019), will sustain growth in users for a long time. Lastly, a business cycle contraction is expected not to affect Spotify very much as the music industry reached a bottom in recent years and strong growth dynamics are occurring in the sector. Hence, we believe that this is leading Spotify to a success cycle, where the rise in users and content consumed by them generates a lot of data, which is then used to improve user experience, increasing their satisfaction, reducing churn rate and leading, again,
Spotify’s acquisition of Soundbetter…
Spotify has entered into a success cycle…
Record labels can now use Spotify to take valuable information and promote artists…
SPOTIFY TECHNOLOGY S.A. COMPANY REPORT
PAGE 14/32
to increases in the number of users. All of this is sustained by not only organic growth through research and development, but also by acquisitions.
Investment Risks
There are some investment risks that investors should be aware of. This is a business where hit content does not last long, every player has access to the same music content and level of competition is moderate. However, as soon as the overall growth of the market reduces to a level that every player cannot grow at the desired levels, competition related problems may skyrocket.
Therefore, one of the main risks identified is competition from large, deep-pocketed players. The most dangerous one is Apple, which does not rely on music streaming for enterprise value creation and it is wealthy enough to tolerant losses for some periods. Moreover, Apple has the advantage of having its app pre-installed in all new IOS devices, which are extremely popular worldwide. In fact, in the last months Spotify increased the free trial period from 1 month to 3 months, which was already done by other competitors and it was a way to avoid subscriber shortfalls. The impact on valuation of this risks is explored in the peers section.
Secondly, and somehow related to the previous one, is that Spotify’s
differentiation points are those technological and related to data curation and analysis. This means that at any time Apple, Amazon, Google, among others, can acquire or even acquire that techniques. To keep pace with the market and avoid other player overtaking the number one position of Spotify, a constant investment and R&D is necessary.
Thirdly, music costs represent more than 74% of Spotify’s total revenue. Hence, any movement in these costs may reduce the expected profit. Royalty rates and contracts with record labels changes may also adversely affect Spotify. The way this risk impacts Spotify is explained above, in the suppliers part of the 5 forces analysis, and below, in the cost of sales forecasting part.
Another risk is related to the fact that most of the opportunities in this market are located in emerging markets, as discussed before. In these markets, GDPs and disposable incomes are effectively growing, but continue to be below to those of the developed markets, where Spotify currently has a stronger presence. Therefore, the entrance in these markets may increase the quantity of sales, but it might contract current average revenue per user (ARPU), as it is explained in the ARPU section below.
Finally, there is also the risk that Spotify’s investment in podcasting fails. In spite of good prospects towards this market, there is still some uncertainty due to lack
Spotify is facing multiple risks…
Too much dependence on powerful record labels…
Entrance in emerging markets might reduce ARPU…
There is a risk related to failed investments…
Multiple competitors in the market…
Technological differentiation points…
SPOTIFY TECHNOLOGY S.A. COMPANY REPORT
PAGE 15/32
of relevant track record. If investors perceive this investment as risky, the share price might be affected as Spotify’s profitability is affected.
Valuation
Key Value Drivers
In order to build a robust forecasting model, one should give an extra emphasis to revenues. In fact, the majority of the captions will be either directly or indirectly driven by revenues. That’s why one should devote a strong effort to arrive at a good revenue forecast model, especially in rapidly growing businesses.
As a result, the revenues’ key value drivers will be described and analyzed in this
Chapter. (See Appendix – Revenues Forecasting Model)
Monthly Ad-supported ARPU
The Monthly Ad-supported Average Revenue Per User is defined as the ad-supported revenue recognized in the year divided by the average ad-ad-supported MAUs (Monthly Active Users), which is then divided by 12 months.
In the past years, the Monthly Ad-supported ARPU remained relatively constant. In fact, in 2017 it was 0.41€ and in 2018 it was 0.43€, meaning that Spotify earned 0.41€ and 0.43€ per each ad-supported user in each month, respectively.
Conversion to Premium Rate
As previously mentioned, the ad-supported service serves as a way to convert users into the premium service. In that context, the Conversion to Premium Rate is a crucial driver to determine how many customers will move into the premium service, affecting negatively the ad-supported MAUs and positively the premium subscribers.
In the past, according to Barry McCarthy (CFO of the firm), Spotify had a Conversion to Premium Rate around 50%, meaning that half of the ad-supported MAUs moved to the premium service in each year.
New Ad-supported Customers Growth Rate
Contrary to the conversion to premium rate, the New Ad-supported Customers affects positively the ad-supported MAUs. As a result, by having the beginning and ending ad-supported customers and the lost customers (due to the conversion to premium), by difference, the new ad-supported customers were 54 million in 2017 and 70 million in 2018, representing an increase of 28.70%. This
Ad-supported ARPU has been stable…
The way to move from ad-supported to premium…
Key driver to be determined… Importance of revenues…
SPOTIFY TECHNOLOGY S.A. COMPANY REPORT
PAGE 16/32
growth rate is an important driver to be determined in the future, as it gives the new ad-supported customers in each year.
Monthly Premium ARPU
The Monthly Premium Average Revenue per User is defined as the premium revenue recognized in the year divided by the average premium subscribers, which is then divided by 12 months.
In the past years, the Monthly Premium ARPU had been declining. In fact, in 2017 it was 5.15€ and in 2018 it was 4.71€, meaning that Spotify earned 5.15€ and 4.71€ per each premium user in each month, respectively.
It is important to refer that the growth of Family and Student plans as well as the penetration in emerging markets and the increasing competition have decreased the Monthly Premium ARPU.
Monthly Premium Churn Rate
The Monthly Premium Churn Rate is the percentage of subscribers who discontinue their subscriptions within one month.
In the recent years, the Monthly Premium Churn Rate has been declining. In fact, it was 7.70%, 6.60% and 5.50% in 2015, 2016 and 2017, respectively. In addition, in the Annual Report it is mentioned that the Monthly Premium Churn Rate fell below 5% in 2018. Thus, it was assumed to be 4.75%.
It is important to refer that the growth of Family and Student plans as well as the introduction of podcasting services have been helping to improve the retention across the premium service, reducing the Monthly Premium Churn Rate.
New Customers from Bi-annual Trial Campaign and
others
The Bi-annual Trial Campaign usually occurs in the second and fourth quarters of each year and it typically offers the premium service for free or at a discounted price for a period of time.
Contrary to the monthly premium churn rate, the New Customers from Bi-annual Trial Campaign affects positively the premium subscribers. Therefore, by having the beginning and ending premium subscribers, the new customers (due to the conversion to premium) and the lost customers (from the monthly premium churn rate), by difference, the new premium customers from bi-annual trial campaign were 16 and 19 million in 2017 and 2018, respectively.
It is important to refer that not all the new premium customers come either from the ad-supported service or from the bi-annual trial campaign. In that context, in
Premium ARPU has been decreasing…
Churn rate has been decreasing…
The campaigns occur in the 2nd and 4thquarter…
SPOTIFY TECHNOLOGY S.A. COMPANY REPORT
PAGE 17/32
this driver it is also included other new premium customers who are not coming from the latest.
Forecasting
Before starting to forecast individual line items, it is necessary to determine how many years of explicit forecast it will be done and when to apply the perpetuity formula. Consequently, it was decided to develop an explicit forecast until the company reaches a steady performance, meaning that the Return on Invested Capital and the Reinvestment Rate should reach a steady state.
It is important to point out that the financial statements were reformulated, meaning that they were divided into operating business, non-operating business and financial activities. In that context, the focus in this Chapter will be the operating business since the non-operating business will be valued at book value.
Revenues
Now that the revenue model was built for 2017 and 2018, to arrive to the revenues for the following years, one needs to estimate the key value drivers for the future.
In the ad-supported segment, the Monthly Ad-supported ARPU is not expected to vary from the past. Consequently, it was forecasted as 0.43€8 for 2019. For
the future, it is still the average of past years growing at a nominal rate equal to expected inflation rate (i.e. zero real growth). Therefore, the Ad-supported ARPU
is expected to reach 0.58€ by 2030. The Conversion to Premium Rate was also
forecasted in line with what happened in the past – 50%. Finally, for the New
Ad-supported Cusomers Growth Rate, it was assumed to be the same rate as the MIDiA Research9 predicted for the whole music streaming market revenues –
20% in 2019, falling to 10% in 2022 and decreasing 1 p.p. onwards. Therefore, knowing that Spotify has a competitive advantage over its peers, we are being conservative when using the expected industry’s revenue growth rate.
In the premium segment, the Monthly ARPU is expected to decrease due to the growth of the Family and Student plans, increasing number of users in emerging markets (where the price is lower) and increasing competition. However, it is not expected to fall below 4.00€, otherwise the margin would decrease to a level not acceptable by shareholders (analyst consensus). The Monthly Premium Churn
8 0.43€ was calculated assuming a Monthly Ad-supported ARPU in 2019 Q4 of 0.52€ since there is seasonality in this driver, meaning
that in the Christmas time the Ad-supported ARPU tends to increase substantially.
9 When building the revenue forecast model, one of the findings was that the New Ad-supported Customers Growth Rate of Spotify was
28.70% in 2018, which is what the MIDiA Research predicted for growth of the industry’s revenues – 29%. Hence, it was considered to
be a strong benchmark for this driver, taking into consideration the competitive advantage that Spotify has.
Forecasting explicitly until reaches a steady state…
Ad-supported segment’s value drivers forecast…
Premium segment’s value drivers forecast…
SPOTIFY TECHNOLOGY S.A. COMPANY REPORT
PAGE 18/32 Graph 17: Ad-supported and premium
revenues in million € (2017-2030)
Rate is decreasing year after year, so it was forecasted following that reasoning, but never falling below 4%. In fact, the Churn Rate should decrease because Spotify is putting effort to improve users’ engagement by introducing Podcasts in the platform. This, aligned with the Student and Family Plans, will increase engagement and, as a consequence, will decrease the Churn Rate. Finally, the New Premium Customers from Bi-annual Trial Campaign is expected to increase by the same number of past year +0.5 million users in the regions of Latin America and Rest of the World (the two fastest growing regions). In Europe and in North America, it is expected to increase by the same number of past year. By having set these parameters, both revenues from ad-supported and premium
segments were calculated. In 2030, the revenues are expected to be 2.7€ billion
in the ad-supported segment and 21.1€ billion in the premium segment, which is 4.9 and 4.5 times higher when comparing with 2018. When aggregating both segments, the total revenues in 2030 are expected to be 23.8€ billion, which is 4.5 times higher than in 2018. (Graph 17)
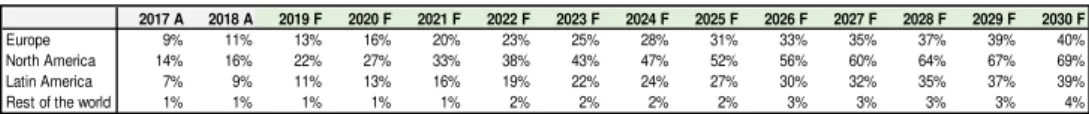
Having calculated the internet penetration (number of internet users per geographic region) and segregated the Ad-supported and Premium users between geographies, it was possible to get the Spotify penetration in each location. As it is possible to see in Table 3, it is expected to move from 9%, 14%, 7% and 1% to 40%, 69%, 39% and 4% in Europe, North America, Latin America and Rest of the World, respectively.
This table was built under the assumption that internet penetration will keep constant from 2019 onwards due to lack of information regarding the number of internet users in the future. Nonetheless, it allowed us to check whether our projections are reasonable and trustworthy (i.e. lower than our addressable market).
It is important to refer that we are assuming that the premium subscribers in Latin America and Rest of the World region will move from 20% to 22% and from 10% to 14%, respectively, since they are the two fastest growing regions. As a consequence, in Europe it was assumed to decrease from 40% to 36% and in North America to decrease from 30% to 28%.
2017 A 2018 A 2019 F 2020 F 2021 F 2022 F 2023 F 2024 F 2025 F 2026 F 2027 F 2028 F 2029 F 2030 F
Europe 9% 11% 13% 16% 20% 23% 25% 28% 31% 33% 35% 37% 39% 40%
North America 14% 16% 22% 27% 33% 38% 43% 47% 52% 56% 60% 64% 67% 69% Latin America 7% 9% 11% 13% 16% 19% 22% 24% 27% 30% 32% 35% 37% 39%
Rest of the world 1% 1% 1% 1% 1% 2% 2% 2% 2% 3% 3% 3% 3% 4%
SPOTIFY TECHNOLOGY S.A. COMPANY REPORT
PAGE 19/32 Graph 18: Expenses as a % of revenue
(2017-2030)
Expenses
The operating expenses of Spotify are the cost of revenues, research and development, sales and marketing and general and administrative. All of them were forecasted as a percentage of revenues. (Graph 18)
The cost of revenues has been high in the recent years (79.24% in 2017 and 74.27% in 2018). For Spotify it will be difficult to decrease substantially this number since this caption comprises royalties and distribution costs related to content streaming. However, as we saw in the Five Forces Analysis, with the decline of the market share of record labels that keep the rights of the artists, streaming companies will have more power in the negotiation and the fees paid will decline due to “disintermediation”. Therefore, it was forecasted to decrease until 70% since the bargaining power of the suppliers is still high. Nonetheless, when looking into the cost of revenues of the comparables, we noticed that they have values near 61%. (Table 4)
However, this is not a “fair comparison” because most of them are also selling physical products that have a higher gross margin. For this reason, we believe that a convergence to 70% of sales is a reasonable forecast, which is line with analysts’ predictions.
The sales and marketing expenses are expected to move from 11.79% as a percentage of revenues to 6% in the future, which is line with “mature” competitors like Amazon and Apple. The general and administrative expenses are expected to keep up pace with revenues growth, forecasted as 5.83% as a percentage of revenue. Finally, the research and development costs are costs incurred for development of products related to the Group’s platform and service and, hence, they are strictly correlated with Spotify’s strategy of continuous improvement and delivery of a high quality service. Therefore, its growth is directly related to revenues growth, forecasted as 10.53% as a percentage of revenue, which is the industry’s average.
Summing up, using a statutory tax rate of 17.00%10, the operating income is
expected to move from -0.9€ billion in 2017 to 1.5 € billion in 2030. (Graph 19)
Invested Capital
In this Chapter we will cover the captions with more relevance of the Balance Sheet.
Regarding the Property and Equipment, Lease right-of use assets and Intangibles, these were forecasted as a percentage of revenue. However, while
10 Tax rate of Luxembourg according to KPMG.
Table 4: Comparables’ costs analysis (2018)
Spotify Netflix Apple Google Amazon Pandora Tencent Mean
Revenues 100% 100% 100% 100% 100% 100% 100% 100% Cogs 74% 63% 62% 44% 60% 65% 62% 61% Marketing 9% 15% 6% 12% 6% 35% 9% 13% R&D 12% 8% 5% 16% 12% 10% - 11% SG&A 5% 4% - 4% 2% 13% 12% 7%
Graph 19: Operating income in billion € (2017-2030)
SPOTIFY TECHNOLOGY S.A. COMPANY REPORT
PAGE 20/32
in Intangibles we do not expect a decrease on this percentage since this is related to the strategy of the company to increase and retain its customers, in the Property and Equipment and in the Lease right-of-use assets it is expected a decrease of this percentage since Spotify is a technology company that do not need to increase its fixed assets to increase its customers (economies of scale). Hence, the Intangibles are expected to be 0.71% as a percentage of revenue and the Property and Equipment and Lease right-of use assets are expected to move from 4.24% and 7.46% in 2019 to 2.99% and 6.36% in 2030 as a percentage of revenue, respectively. It is important to state that the Lease Liabilities are moving at the same pace as the Lease right-of-use assets.
With respect to the Receivables and Payables, it is possible to conclude that Spotify is receiving sooner but also paying sooner. In fact, the Average Collection Period (ACP) was 27.76 days in 2018 and it is expected to be 25.02 days from 2019 onwards. The Average Payable Period (APP) was 39.90 days and it is expected to fall to 37.52 days from 2019 onwards.
The Accrued fees to rights holders is one of the most important captions in the whole Balance Sheet as alone it is almost bigger than the operating assets. This caption is related to the cost of revenue, which are the royalties that are paid to the rights holders. As previously seen, the cost of revenue is not expected to vary a lot and, therefore, this caption was forecasted using 23.27% as a percentage of the cost of revenue, which is the percentage of 2019.
To conclude, the Operating Invested Capital of Spotify is negative year after year. This is due to the fact that the company has much more liabilities than assets, like it is expected in a technology company.
Continuing Value
After having forecasted the Income Statement (Appendix – Income Statement)
and the Balance Sheet (Appendix – Balance Sheet), the Free Cash Flow map
was built (Appendix – Free Cash Flow Statement).
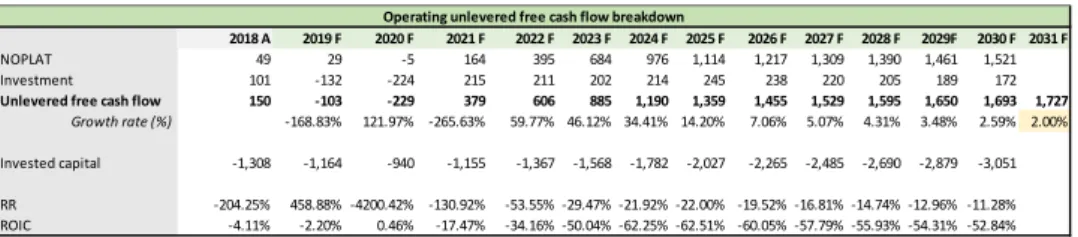
As it is possible to observe in Table 5, the unlevered free cash flow is expected to move from 150 million euros in 2018 to 1.7 billion euros in 2030. Because of the consistent generation of cash, it is expected that some shareholders will pressure the company to distribute part of it. As by 2024 the cash flow generated is expected to be higher than 1 billion euros, we assumed that the company will start distribute dividends. The dividend payout considered was 20.01%, which is the average payout ratio in the entertainment sector.
Looking into the growth of the unlevered free cash flow, one might notice that it is decreasing to values near 2% in 2030. Therefore, as the Reinvestment Rate and
PPE, Intangibles and Leases…
Receivables vs Payables…
Accrued fees to rights holders…
Liabilities higher than assets…
Dividends distribution in 2024…
2% growth from 2030 onwards…
SPOTIFY TECHNOLOGY S.A. COMPANY REPORT
PAGE 21/32 Table 6: Key inputs of cost of equity
Value
Rf
-0.26%
Beta
1.14
E(Rm)
6.00%
Re
6.89%
Cost of equity (Re)
the Return on Invested Capital (ROIC) are in a steady state, we assumed that Spotify’s perpetuity growth is 2%, which is the expected inflation. Hence, we are assuming that the company will grow at the inflation rate from 2030 onwards, assuming a real growth rate of 0%.
It is important to say that calculating the perpetuity growth rate by using the Reinvestment Rate and Return on Invested Capital (ROIC) has no meaning for technology companies that usually have few assets in comparison to its liabilities (which implies a negative operating invested capital). In that context, both ratios were only used to assure that the company is growing at a steady state when applying the perpetuity formula.
Discount Rate Estimation
The rate to discount cash flows is called weighted average cost of capital (WACC), which requires the estimation of the cost of equity, the cost of debt and the target capital structure.
Regarding the cost of equity, we used the CAPM model, whose methodology requires three different inputs: risk-free rate, beta and market risk premium. For
the risk-free rate we used 10-year government bunds11, since it is denominated
in the currency as the cash-flows. For the beta, we used an industry-derived12
unlevered beta relevered to the company’s target capital structure, since company-specific betas vary too widely over time to be used reliably. In fact, the rolling betas were calculated and they are varying a lot. In addition, a regression was run and the confidence interval is quite wide (0.9-2.1), with a low R squared (0.25). The reason for this is that Spotify is a high growth company that is extremely sensitive to news in the market (e.g. competitors, regulation) which
affect the stock price (but not necessarily the company’s fundamentals),
depending on the perception of the investors/speculators. Therefore, an approach using betas’ competitors were used (value is within the confidence interval) and a sensitivity analysis was performed to test the robustness of this
11 Source: Bloomberg
12 The public comparables used were Apple, Google, Amazon, Netflix and Tencent Music Entertainment. Source: Thomson ONE banker.
Table 5: Operating unlevered FCF
Operating unlevered free cash flow breakdown
2018 A 2019 F 2020 F 2021 F 2022 F 2023 F 2024 F 2025 F 2026 F 2027 F 2028 F 2029F 2030 F 2031 F NOPLAT 49 29 -5 164 395 684 976 1,114 1,217 1,309 1,390 1,461 1,521 Investment 101 -132 -224 215 211 202 214 245 238 220 205 189 172 Unlevered free cash flow 150 -103 -229 379 606 885 1,190 1,359 1,455 1,529 1,595 1,650 1,693 1,727
Growth rate (%) -168.83% 121.97% -265.63% 59.77% 46.12% 34.41% 14.20% 7.06% 5.07% 4.31% 3.48% 2.59% 2.00% Invested capital -1,308 -1,164 -940 -1,155 -1,367 -1,568 -1,782 -2,027 -2,265 -2,485 -2,690 -2,879 -3,051 RR -204.25% 458.88% -4200.42% -130.92% -53.55% -29.47% -21.92% -22.00% -19.52% -16.81% -14.74% -12.96% -11.28% ROIC -4.11% -2.20% 0.46% -17.47% -34.16% -50.04% -62.25% -62.51% -60.05% -57.79% -55.93% -54.31% -52.84%
SPOTIFY TECHNOLOGY S.A. COMPANY REPORT
PAGE 22/32
parameter. For the market risk premium we used a generally accepted value based on historical averages13.
Regarding the target capital structure, we assumed a 100% Equity/EV ratio for two reasons. One is that Spotify has little tangible assets that can be used as collateral and the other is that enough excess cash is being generated to reinvest and distribute dividends, not being necessary external financing. As a result, there is not necessary to calculate the cost of debt.
So, after following the previous steps, the WACC14 given was 6.89%, which is
basically our cost of equity since we assumed no debt. The same happens with the beta, which is equal to the unlevered beta. (Table 6)
Discounted Cash Flows Method (DCF)
We used three methods to value the equity value of Spotify: DCF model, APV model and EVA model. It will be presented only the DCF as the three models’ output are very close.
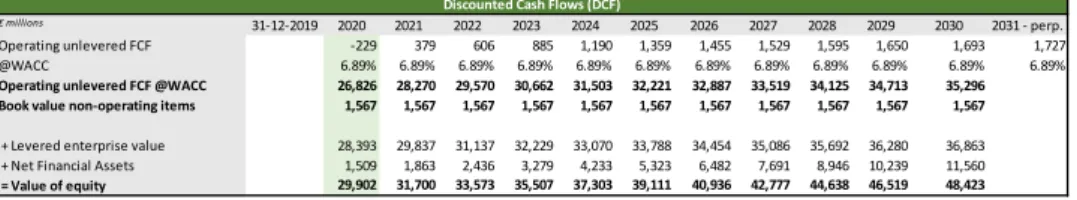
As it is possible to see in Table 7, the operating activity was valued at market value by discounting at WACC all the Free Cash Flows. The non-operating items and net debt were valued at books values. Therefore, after summing the market value of the operating business and the book value of non-operating items and
subtracting the net debt, we got an expected value of equity of 29,902 million € in
2020. It is important to highlight that a large part of the book value of non-operating items are related to the 9% investment in TME. Although, its book value was 1.7 billion euros, the result of our relative valuation of this investment was lower (0.93 billion €).
The number of outstanding shares is c. 180 million. The projected price per share is 166.36€, which corresponds to $184.50 by converting it at the current
exchange rate. Therefore, being the actual price $149.55 (as of 31th December
2019), the return the return we expect during 2020 is 23.4%, assuming no dividends or share repurchases.
Finally, as the return is higher than 10%, our recommendation is to buy the stock in the base case.
13 Source: “Corporate Finance”, Jonathan Berk, Peter DeMarzo
14
Expected return during 2020 is 23.4%...
SPOTIFY TECHNOLOGY S.A. COMPANY REPORT
PAGE 23/32
Sensitivity Analysis
Since there is uncertainty regarding some parameters, a sensitivity analysis has been performed in order to alert investors for future different prices and to test the robustness of our model.
The parameters considered are the ones that can vary the most, i.e., the beta and, as consequence, the WACC as well as the growth rate used for perpetuity. The range that has been chosen for the Beta is between 1.14 (from the industry’s unlevered beta relevered to the company’s target capital structure) and
1.41 (from Spotify’s average rolling beta). Hence, the WACC will vary between
6.89% and 8.59%. (Table 8)
The range that has been chosen for the growth rate is between 1% and 3%, since the different projections for inflation are between these numbers, that we consider reasonable.
Hence, by applying the different discount rates and growth rates, the sensitivity analysis has been performed and it is presented in Table 9.
By analyzing the results, it is possible to conclude that for most of the cases it is recommend to buy (green) or hold (blue) the stock, offering a return higher than 10% or between 0% and 10%, respectively. For the remaining scenarios, it is recommend to sell (red) since the return is below 0% (i.e. negative).
However, it is important to refer that this analysis was very conservative since the Beta range started with 1.14 (value used in the valuation), meaning that we did not consider a decrease in the Beta that would reinforce the Buy position. Table 7: DCF Model
Discounted Cash Flows (DCF)
€ millions 31-12-2019 2020 2021 2022 2023 2024 2025 2026 2027 2028 2029 2030 2031 - perp. Operating unlevered FCF -229 379 606 885 1,190 1,359 1,455 1,529 1,595 1,650 1,693 1,727 @WACC 6.89% 6.89% 6.89% 6.89% 6.89% 6.89% 6.89% 6.89% 6.89% 6.89% 6.89% 6.89% Operating unlevered FCF @WACC 26,826 28,270 29,570 30,662 31,503 32,221 32,887 33,519 34,125 34,713 35,296 Book value non-operating items 1,567 1,567 1,567 1,567 1,567 1,567 1,567 1,567 1,567 1,567 1,567
+ Levered enterprise value 28,393 29,837 31,137 32,229 33,070 33,788 34,454 35,086 35,692 36,280 36,863 + Net Financial Assets 1,509 1,863 2,436 3,279 4,233 5,323 6,482 7,691 8,946 10,239 11,560 = Value of equity 29,902 31,700 33,573 35,507 37,303 39,111 40,936 42,777 44,638 46,519 48,423
Table 9: Sensitivity Analysis
in dollars 6.89% 7.32% 7.74% 8.17% 8.59% 1.00% 164.61 154.04 144.84 136.75 129.59 1.50% 173.63 161.57 151.18 142.15 134.21 2.00% 184.50 170.52 158.63 148.42 139.54 2.50% 197.84 181.32 167.51 155.79 145.74 3.00% 214.61 194.62 178.25 164.60 153.04 WACC G ro w th r a te
Ranges for Beta
Min Max Rf -0.26% -0.26% -0.26% -0.26% -0.26% Beta 1.14 1.21 1.28 1.35 1.41 E(Rm) 6.00% 6.00% 6.00% 6.00% 6.00% Re 6.89% 7.32% 7.74% 8.17% 8.59% Rd 3.48% 3.48% 3.48% 3.48% 3.48% E/(E+D) 100.00% 100.00% 100.00% 100.00% 100.00% D/(E+D) 0.00% 0.00% 0.00% 0.00% 0.00% Tax rate 17.00% 17.00% 17.00% 17.00% 17.00% WACC 6.89% 7.32% 7.74% 8.17% 8.59%
Table 8: Ranges for Beta impacting the WACC