How did the explosion of Galaxy Note 7 affect
Samsung and its competitors?
Financial Analysis of Corporate Events
Yu-Yen, Shih
152216026
Dissertation written under the supervision of Geraldo Cerqueiro
Dissertation submitted in partial fulfilment of requirements for the MSc in
Economics, at the Universidade Católica Portuguesa and for the MSc in
i
Abstract
This dissertation aims to shed light on how the market responds to product crisis, in order to assist management levels in making strategy for potential loss. The product crisis of Samsung’s Galaxy Note 7 is used as an example to understand how it affected Samsung and its competitors, Apple and LG. Applying event study as methodology, the “explosion” and “voluntary recall” had no impact on Samsung’s stock but “involuntary recall and ban” as well as “termination” had negative impact. Stockholders also suffered more loss in “termination” than “involuntary recall and ban”, but less in “voluntary recall”. Considering direct cost, stockholders suffered more loss than expected, which indicates the existence of indirect cost, such as reputation and litigation. The competitors, LG and Apple, do not perform significant abnormal return by Galaxy Note 7´s event, thus they neither suffer nor benefit from the crisis. Regarding the aggregate effect, the market performs pessimistically toward the future profitability when authorities concerned announce “involuntary recall and ban".
Title: How did the explosion of Galaxy Note 7 affect Samsung and its competitors? Author: Yu-Yen, Shih
Keywords: Samsung, product crisis, product recall, event study
Resumo
Esta dissertação visa esclarecer como o mercado responde à crise de um produto, a fim de auxiliar a Gestão na escolha de uma estratégia para evitar possíveis perdas com o sucedido. Em particular, estuda-se a crise do Samsung Galaxy Note 7 como evento específico, para compreender como este afetou a Samsung e os respetivos concorrentes, Apple e LG. Aplicando o estudo deste evento como metodologia, verificou-se que a explosão e a retirada voluntária não tiveram impacto sobre as ações da Samsung. No entanto, a retirada involuntária e a proibição, assim como a rescisão, tiveram impacto negativo nas mesmas. Além disso, os acionistas sofreram mais perdas com a rescisão do que com o anúncio de autoridade, mas menos com a retirada voluntária. Considerando os custos diretos, os acionistas sofreram mais perdas do que o esperado, o que indica a existência de custos indiretos, como reputação e litígios. Em relação aos concorrentes, a Apple e a LG não realizaram retornos significativos com a crise do Samsung Galaxy Note 7, não sofrendo nem tirando proveitos com o sucedido. Em relação ao efeito agregado, o mercado mostra-se pessimista em relação aos lucros futuros quando a autoridade em questão anuncia a retirada involuntária e a proibição de produtos.
Título:Como a explosão do Galaxy Note 7 afectou a Samsung e os seus concorrentes
Autor: Yu-Yen, Shih
ii
Acknowledgements
iii
Contents
Abstract ... i Resumo ... i Acknowledgements ... ii 1. Introduction ... 1 2. Literature Review ... 33. Introduce company and event ... 5
4. Empirical methodology ... 7
4.1 Abnormal returns ... 7
4.1.1 Standardized abnormal return ... 7
4.1.2 Cumulative abnormal return ... 8
4.1.3 Average cumulative abnormal return ... 8
4.2 Estimation and event windows ... 8
4.3 Benchmark model ... 10
4.3.1 Constant mean return model ... 10
4.3.2 Market model ... 10
4.4 Parametric test ... 11
4.4.1 Statistic test for abnormal return ... 11
4.4.2 Statistic test for Cumulative abnormal return ... 11
4.4.3 Statistic test for average cumulative abnormal return ... 12
4.5 Non-parametric test ... 12
4.5.1 Generalized Sign test ... 12
4.5.2 Rank test ... 13
5. Data and variable ... 14
6. Main result ... 15
6.1 Explosion ... 15
6.1.1Samsung´s stock price ... 15
6.1.2Competitors ... 16
6.2Voluntary recall ... 17
6.2.1Samsung ... 17
6.2.2Competitors ... 17
6.3Involuntary recall and ban ... 18
6.3.1Samsung ... 18
6.3.2Competitors ... 19
iv
6.4.1Samsung ... 20
6.4.2Competitors ... 21
6.5Standardized abnormal returns ... 22
6.6Non-parametric test ... 23
7. Validation ... 25
7.1 Market efficiency ... 25
7.2 Anticipation ... 27
7.3 Cofounding effect ... 28
8. Rationalizing the effect ... 28
8.1 Press article and analyst report ... 28
8.2 Samsung reports ... 29
8.3 Competitors ... 36
8.3.1 Apple report ... 36
LG report ... 39
8.4 Potential loss for Samsung ... 40
8.5 Compared research result with firm financial data ... 41
8.5.1 Does market overreact or not ... 41
8.5.2 Does the competitors benefit or not ... 42
9. Conclusion ... 42
v
List of Tables
Table 1-results for the impact of explosion on Samsung´s stock ... 15
Table 2-results for the impact of explosion on LG and Apple´s stock ... 16
Table 3-results for the impact of voluntary recall on Samsung´s stock ... 17
Table 4-results for the impact of voluntary recall on LG and Apple´s stock ... 18
Table 5-results for the impact of involuntary recall and ban on Samsung´s stock ... 19
Table 6-results for the impact of involuntary recall and ban on LG and Apple´s stock ... 20
Table 7-results for the impact of termination on Samsung´s stock ... 21
Table 8-results for the impact of termination on LG and Apple´s stock ... 22
Table 9-results for standardized abnormal returns ... 23
Table 10-results for non-parametric test ... 24
Table 11-results for market efficiency test on Samsung´s stock for involuntary recall and ban event ... 26
Table 12-results for market efficiency test on Samsung´s stock for termination ... 27
Table 13-Samsung´s income statement of 3Q2016 ... 30
Table 14-Samsung´s income statement of 4Q2016 ... 31
Table 15-Samsung´s key profitability indicator of 3Q2016 ... 31
Table 16-Samsung´s key profitability indicator of 4Q2016 ... 31
Table 17-Samsung´s Segment Sales of 3Q2016 ... 33
Table 18-Samsung´s Segment net profit of 3Q2016 ... 33
Table 19-Samsung´s Segment Profit Margin of 3Q2016 ... 34
Table 20-Samsung´s Segment Sales of 4Q2016 ... 35
Table 21-Samsung´s Segment Net profit of 4Q2016 ... 35
Table 22-Samsung´s Segment Profit Margin of 4Q2016 ... 35
Table 23-Samsung’s 2016 income statement ... 36
Table 24-Apple´s Unit Sales and Revenue for product summary of 3Q2016 ... 37
Table 25-Apple´s Unit Sales and Revenue for product summary of 4Q2016 ... 37
Table 26-Apple´s income statement of 3Q2016 ... 38
Table 27- Apple´s income statement of 4Q2016 ... 38
Table 28-LG´s segment income statement of 3Q2016 ... 39
vi
List of Figures
Figure 1-Samsung´s stock price performance ... 6 Figure 2-Estimation and event windows ... 9
1
1.
Introduction
In response to growing competition and shrinking product life cycle, companies meet tighter product development cycle. In particular, high-technology firms face competitive environment, and demand substantial inputs of capital, expertise, research and equipment. However, shortening product life cycle is accompanied by a higher defective rate. According to ENDS Europe1, the electronic product cycle shrinks and replacement rate of defective product has
increased from 3.5% in 2004 to 8.3% in 2012. The product crisis may force them to recall the products or even terminate all the sales and production, leading companies to be on the edge of collapse. Thus, this dissertation aims to cast light on how product crisis affects stockholders and their competitors, and to assist managers in taking action with responding to product crisis.
Previous research found that the market has different responses to recall. Most papers focus on automobile industry since recall events have happened frequently in past years. The market may reward or punish the corporate’s recall strategy. Moreover, many factors influence the magnitude of loss on stockholders. First, different industries make different levels of loss: drugs/cosmetics industries hurt more, while rubber/automobile industries hurt less. Second, the levels of hazard are different: the market punishes more on high hazardous events. Third, the reputation factor: a high-reputation firm suffers more from recall events. Last, the types of recall: stockholders suffer more loss in replaced or refund strategy than repaired or checked. Government-ordered recall also hurt more than voluntary recall. Furthermore, proactive recall strategies experience more loss than passive strategies, and termination damages stock price more than recall. In addition, loss not only reflects direct cost from recall, but also destroys the reputation and spills over to competitors.
In order to elaborate product crisis, this dissertation selects Samsung’s Galaxy Note 7 explosion as a specific event. Unlike previous research which concentrated on the automobile industry, recall events in IT and Mobile industry are barely mentioned. The flagship product of Samsung Electronics Co., the iconic and prestigious technical firm, exploded, injuring consumer and damaging properties. The product crisis comprises recalls by Samsung, involuntary recalls from government, and prohibition by authorities concerned. However, Samsung ended the nightmare by making termination decision. This corporate event provides comparison in response to
2 different product crisis, how the market reacts to various product crisis from a reputational firm and how the event influences its competitors.
To investigate whether the event has an impact on stock prices or not, this dissertation applies the event study methodology, elaborating parametric and non-parametric tests with the constant mean model and the market model as a benchmark. In respect of competitors, this dissertation selects Apple Inc. and LG Electronics, since one is the main rival in the smartphone market and the other is a strong opponent in South Korea.
Based on the result, Samsung´s stock generated significant negative abnormal returns on announcement of involuntary recall and ban, and termination, but generated non-significant abnormal returns on explosion and voluntary recall. Stockholders also suffered more loss on termination than involuntary recall and ban, but even less on voluntary recall. In response to direct cost from recall and termination, the stock price also fell more than expected, which indicates some factors other than direct cost may affect the stock price, such as litigation, future sales, brand equity, and reputation. Competitors, LG and Apple, do not perform significant abnormal returns by Galaxy Note 7´s event, thus they do not suffer nor benefit from the crisis. Regarding the aggregate effect, the market performs pessimistically towardfuture profitability when authorities concerned announce involuntary recall and ban.
3
2.
Literature Review
Jarrell and Peltzman (1985) applied the method of event study to estimate the wealth of shareholders when producers of drugs and automobiles recalled defective products. The results showed that shareholders suffer greater loss from the recall rather than from direct cost, and the loss spill over to the firm´s goodwill, even affecting competitors, which means they do not benefit from the recall crisis either. Compared with the loss from recall, the aggregate amount of negative externality may even be larger. Since this research, more researchers have extended the study about recall announcement. However, Hoffer, Pruitt and Reilly (1988) conducted the reexamination on Jarrell and Peltzman (1985)´s research, and found little evidence that automotive recall significantly affected the share price. On the other hand, Bromiley and Marcus (1989) also had contradictory result and found that the deterrent effect from recall cost can be greater than deterrent effect from stock market. Some found that the market punishes the recall, which generates negative abnormal returns. However, the result suggested by Bromiley and Marcus (1989) was that market may also reward the recall behavior. They concluded the loss from shareholders was not greater enough to prevent automobile companies from producing defective products, compared with the profit they generate from the recalled product. Therefore, the reaction of stock market does not play the role as a social control.
Further studies about recall extends to non-automobile industries. Pruitt and Peterson(1986) presented significant negative abnormal returns on shareholders when non-automobile product recalls were announced, and concluded that the magnitude of market reaction and market value has no significant relationship with the direct cost of the recall. This implies that litigation and reputation damage should also be taken into consideration. Furthermore, the reaction of stock prices due to recall announcement lasted for two months after the initial releasement. Chu, Lin and Prather (2005) studied non-automotive product recall in the time period from 1984 to 2003.They found statistically significant abnormal returns on, and one day prior to announcement date. Through a cross-industry event study, they concluded drugs/cosmetics industries suffered more, while rubber/automobile parts suffered less.
Some factors were taken into consideration for product-recall event, such as hazard levels and firm reputations. Thomsen and McKenzie (2001)’s research on meat and poultry recall showed serious food safety hazard leads to significant loss to shareholders, while less serious hazards
4 had no impact on equity. Rhee and Haunschild (2006) demonstrated that the market punished more on automobile firms with high reputation than those with lower reputation when product recall was announced.
Some researchers doubt that all the recalls are homogeneous. Instead, the market has different performances in response to various types of recalls. Davidson and Worrell (1992) examined the market response to the recall of non-automobile industries, which indicated significant negative returns. Recalls that replaced the product or refund had more negative abnormal returns than repaired or checked. The shareholders suffer more loss in the announcement of the product being taken off the market rather than recall. Moreover, they found limited support that market reacted more negatively to government-ordered recalls than voluntary recalls.
Some articles investigated how the recall strategies influence the market. Siomkos and Kurzbard (1994) distinguished crisis management into passive, defensive, proactive, and responsive. Chen, Ganesan and Liu (2008) classified recall strategies into proactive and passive, they concluded that the negative effect of proactive strategies is much stronger than passive strategies since the investors recognize that proactive strategies are signals of extreme financial loss, and firms were forced to act in order to reduce the potential damage.
This dissertation has four purposes: (1) to demonstrate a recall case in the IT and Mobile industry, (2) to test the impact of product explosion, voluntary recall, involuntary recall and ban, and being taken off the market had on shareholders and their competitors, (3) to compare result of various recall event with previous research (4) to test market efficiency
5
3.
Introduce company and event
Founded in 1983, Samsung started as a trading company in South Korea. Nowadays the business empire dominates South Koreans’ daily lives, they build apartments by operating construction company, issue credit cards called the Samsung Card, sell electronic products, manufacture home appliances, provide medical care by Samsung Medical Center, run theme parks, operate universities, and even offer funeral services. Samsung, the international conglomerate operated by the Lee family, generated a total revenue of around KRW 303 trillion (USD 267 billion) and holds total assets amounted to KRW 623 trillion (USD 550 billion) at the end of 2014, and accounted for 4.7 % of South Korean GDP in 2013. (Sangin Park, 2016)
Under Samsung´s group, over 60 subsidiary firms exist. Samsung Electronics Co., the most important cash cow, has more than two-thirds market value of conglomerate. Established in 1969, Samsung Electronics Co. provides Consumer Electronics (Visual Display, Health and Medicine Equipment, Home Appliance), IT and Mobile communication (mobile communication, network business), and Device Solutions (memory business, system LSI business, foundry business). It is not only the main manufacture in South Korea, but also the largest global vendor in smartphone and mobile phone market. At the end of 2016, Samsung Electronics Co. maintains 220 operation hubs among 79 countries, and hires more than three hundred thousand employees.
Galaxy Note 7, the flagship for Samsung Electronics Co. in 2016, was launched on 19th August,
just one month prior to releasement of Apple’s iPhone 7 in the same year. However, frequent explosions occurred on the Galaxy Note 7 because of the battery shortcut. Due to injuries and property damage, Samsung Electronics Co. recalled the product and exchanged new batteries on 2nd September. The Federal Aviation Administration (FFA) continued to ban the Galaxy Note
7 on all flights on 8th September and US Consumer Product Safety Commission (CPSC)
announced to stop using Galaxy Note 7 on 9th September. Since replaced phones were still
defective and prone to overheating, Samsung terminated all the sales, exchange, and production of Galaxy Note 7. Samsung Electronics Co. offered the choice to exchange for another phone or refund to the customers who bought Galaxy Note 7.
6 According to ABC news2, there are 339 over-heating reports. Galaxy Note 7 sold 1.59 million
and 1.47 million for replacement, the expected revenue lost is USD 2.7 billion, and predicted financial damage is USD 1 billion (Bloomberg3). In 2017 Samsung recollected 3.06 million
sold products. On the other side of market share, Samsung dominated 20.9% in smartphone market shares in 43Q2016 (IDC Quarterly Mobile Phone Tracker), Apple had 12.5% market
share, and Huawei was in third position with 9.3% market share. However, the market share changed in 4Q2016. Apple enjoyed 18.2% market share, while Samsung was slightly behind with 18% market share, Huawei increased the market share to 10%.
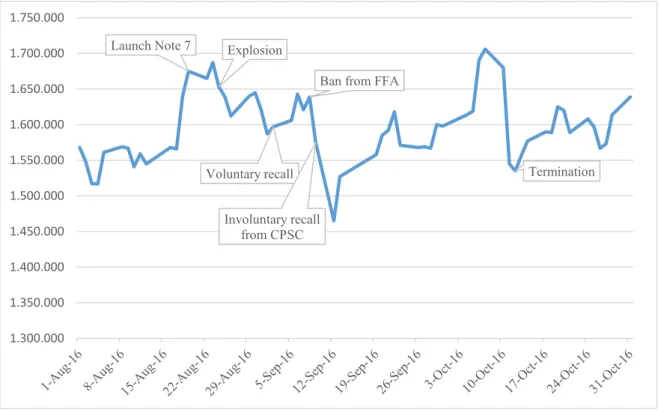
Figure 1-Samsung´s stock price performance
The figure represents Samsung´s stock index from August 2016 to October 2016, and displays the performance when events occur.
2 ABC news, Samsung Exchanging Galaxy Note 7 Smartphones Because of Potentially Exploding Batteries 3 Bloomberg, Four Charts That Show What Exploding Galaxy Note 7 Phones Really Mean for Samsung 4 Third Quarter
Launch Note 7 Explosion
Voluntary recall
Ban from FFA
Involuntary recall from CPSC Termination 1.300.000 1.350.000 1.400.000 1.450.000 1.500.000 1.550.000 1.600.000 1.650.000 1.700.000 1.750.000
7
4.
Empirical methodology
An event study estimates how a particular event affects firm value or financial market. To estimate firm value, event studies apply stock prices since they are assumed to reflect relevant information and discounted future cash flow generated by the firm. (McWilliams and Siegel, 1997) The hypothesis of the event study is that the stock price will present abnormal returns if the firm value changes due to a specific event. (Serra, 2002) There are several assumptions for an event study. First, the market is efficient, which means that stock prices reflect all the available information, and the market prices adjust for the information instantaneously. Second, the event is unanticipated; in other words, the market does not have any information before the event is announced by press. Third, there is no confounding effect during the event window, or even though other events happen in the event window, it has no impact on the result. In addition, the event can be internal or external. Internal cases are mergers and acquisition, earning announcement, launch new product, change of capital structure, CEO turnover or litigation, while external events are government transfers, natural disasters, financial crisis or terrorism.
4.1
Abnormal returns
Abnormal returns are the difference between the actual return and the expected return obtained by benchmark model.
𝐴𝑅𝑖𝑡 = 𝑅𝑖𝑡− 𝐸(𝑅𝑖𝑡)
𝑅𝑖𝑡 =the return on the stock price of firm i on day t
𝐸(𝑅𝑖𝑡) = the expected return on the stock price of firm i on day t
4.1.1 Standardized abnormal returns
To guarantee the same variance, the abnormal return is standardized by the standard deviation that is derived by residual on each firm.
𝑆𝐴𝑅𝑖𝑡 =𝐴𝑅𝑖𝑡 𝑆𝐷𝑖𝑡
8 Where 𝑆𝐷𝑖𝑡 = √𝑆𝑖2 × (1 +1 𝑇+ (𝑅𝑚,𝜏− 𝑅𝑚)2 ∑ (𝑅𝑡 𝑚,𝑡 − 𝑅𝑚)2 )
𝐴𝑅𝑖𝑡 =abnormal return on stock price of firm i on day t 𝑆𝐷𝑖𝑡 = standard error that adjusted by prediction error
𝑆𝑖2 =the residual variance obtained from benchmark model for firm i
𝑇 = the number of days in the estimation window
𝑅𝑚 =the average market return in the estimation window 𝑅𝑚,𝜏 = the market return on the day in the event window 𝑅𝑚,𝑡 = the market return on the day in the estimation window
4.1.2 Cumulative abnormal return
The objective is to obtain the aggregate abnormal returns during the event window.
𝐶𝐴𝑅𝑖 = 1
√𝑘∑ 𝑆𝐴𝑅𝑖𝑡
𝑘
𝑡=1
𝑘 = the number of days in the event window 𝑆𝐴𝑅𝑖𝑡 = standardized abnormal returns for firm i
4.1.3 Average cumulative abnormal return
In order to estimate the abnormal return across N firms, average cumulative abnormal return is required. 𝐴𝐶𝐴𝑅𝑖 = 1 𝑁× 1 √(𝑇 − 2) (𝑇 − 4)⁄ × ∑ 𝐶𝐴𝑅𝑖𝑡 𝑁 𝑖=1
𝑁 =the number of firms
𝑇 = the number of days in the estimation window
9
4.2
Estimation and event windows
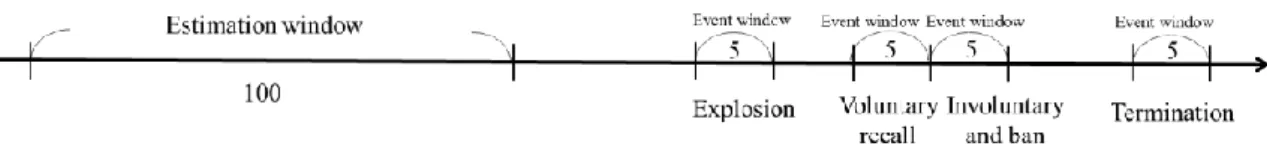
The length of the estimation window is 100-trading days, 122 days before the explosion announced. To avoid confounding effects, the estimation window does not include the date of product launch. This dissertation analyzes four events: explosion, voluntary recall, involuntary recall and ban from authorities concerned, and product termination. In addition, this dissertation combines the ban from the FFA with involuntary recall from the CPSC as one event since involuntary recall occurred just one day after the ban announcement. This dissertation defines the official recall by Samsung as voluntary recall, and the recall by the CPSC as involuntary recall.
Each event window is tested by the fixed estimation window as a result of the short period between these events. Each event window has 5 observations, including event day, two days before and two days after the event. Since the information may leak out before announcement, the day before the event day is required to account. On the other hand, because the investor may not immediately react to the news releasement, each event window also comprises of the day after the event. In an attempt to understand the impact of the explosion on Samsung Electronics Co. and its competitors, this dissertation incorporates different markets in the world. Due to holidays in other countries, the period in estimation window may slightly change. Therefore, estimation window for each firm security is set from 122 days before explosion, and the following 100 trading days. According to the event window, there are no deviations between various markets.
Figure 2-Estimation and event windows
10
4.3
Benchmark model
The event study applies the benchmark model to generate expected returns. This dissertation applies simple models instead of complex models since the variance of abnormal return barely decreases when many factors include. (Brown and Warner, 1980, 1985)
4.3.1 Constant mean return model
The constant mean return model assumes that the mean return of investigated stock is constant.
𝑅𝑖𝑡 = 𝜇𝑖+ Ϛ𝑖𝑡
𝐸(Ϛ𝑖𝑡) = 0, 𝑣𝑎𝑟(Ϛ𝑖𝑡) = 𝜎Ϛ𝑖𝑡
2
𝑅𝑖𝑡 =the return on the stock price of firm i on day t
𝜇𝑖 =the mean return of stock i in estimation window
Ϛ𝑖𝑡 =the disturbance term of stock i with zero expectation and variance 𝜎Ϛ2𝑖𝑡
4.3.2 Market model
The market model is established by the linear relationship between the market return and security return.
𝑅𝑖𝑡 = 𝛼𝑖 + 𝛽𝑖𝑅𝑚𝑡+ 𝜀𝑖𝑡
𝐸(𝜀𝑖𝑡) = 0, 𝑣𝑎𝑟(𝜀𝑖𝑡) = 𝜎𝜀2𝑖𝑡
𝑅𝑖𝑡 =the return on the stock price of firm i on day t
𝑅𝑚𝑡= the market return on the day t 𝛼𝑖 =the intercept term from market model
𝛽𝑖 =the systematic risk of stock i from market model
11
4.4
Parametric test
The parametric test assumes that abnormal returns are normally distributed. In this dissertation, the two-tailed test of the null hypothesis is applied.
4.4.1 Statistic test for abnormal returns
The null hypothesis presents an absent abnormal return, which means that the event has no impact on stock return.
𝑡𝐴𝑅𝑖,𝑡 =𝐴𝑅𝑖𝑡 𝑆𝐴𝑅𝑖 𝑆2 𝐴𝑅𝑖 = 1 𝑇 − 2∑ 𝐴𝑅𝑖,𝑡 2 𝑇 𝑡=0
𝐴𝑅𝑖𝑡 =abnormal return on stock price of firm i on day t 𝑇 = the number of days in the estimation window
𝑆𝐴𝑅𝑖 =the standard deviation of the abnormal return for each firm
4.4.2 Statistic test for cumulative abnormal returns
The null hypothesis, that average abnormal return is not different from zero, presents the event does not generate abnormal return to stock price.
𝑡𝐶𝐴𝑅 =𝐶𝐴𝑅𝑖 𝑆𝐶𝐴𝑅
𝑆𝐶𝐴𝑅2 = 𝑘𝑆 𝐴𝑅2 𝑖
𝑘 = the number of days in the event window
12
4.4.3 Statistic test for average cumulative abnormal returns
The null hypothesis is that average cumulative abnormal return is not different from zero, which means the event has no impact on the stock return.
𝑍 = 𝐴𝐶𝐴𝑅𝑖 × √𝑁
4.5
Non-parametric test
Parametric tests have biases that often reject positive abnormal returns but barely rejects negative returns because distribution of abnormal return tends to present leptokurtosis and is positively skewed. In addition, non-parametric tests are also an alternative to provide robustness check for parametric test.
Non-parametric tests help to identify outliers, especially for small samples, since test statistics with small samples are strongly affected by outliers. This dissertation elaborates generalized sign tests and rank tests for small samples.
4.5.1 Generalized Sign test
The generalized sign test from Cowan (1992) is to compare the possibility of positive abnormal returns in the event window to estimation window.
𝑝̂ =1 𝑛∑ 1 100 𝑛 𝑖=1 ∑ 𝑆𝑖𝑡 𝑇 𝑡=1 Where 𝑆𝑖𝑡 = {1 , 𝑖𝑓 𝐴𝑅𝑖𝑡 > 0 0, 𝑜𝑡ℎ𝑒𝑟𝑤𝑖𝑠𝑒
𝑝̂ = the proportion of positive abnormal return in estimation window 𝑛 = the number of firms
𝑇 = the number of days in the estimation window 𝐴𝑅𝑖𝑡 =abnormal return on stock price of firm i on day t
13 The generalized sign test is
𝑍𝐺 =
𝜔 − 𝑛𝑝̂ √𝑛𝑝̂(1 − 𝑝̂)
Where
𝜔 = {1 , 𝑖𝑓 𝐶𝐴𝑅0, 𝑜𝑡ℎ𝑒𝑟𝑤𝑖𝑠𝑒𝑖 > 0
𝐶𝐴𝑅𝑖 =cumulative abnormal return of firm i
4.5.2 Rank test
Corrado (1989) test ranks the abnormal return of each security in time series, which includes the observations in the estimation window and event window. Under the null hypothesis of no abnormal return, the expected ranking on event day 0 is in the middle point of ranking.
𝑡𝑟𝑎𝑛𝑘 = 1 𝑁∑ 𝐾𝑖,𝐻𝑜− 0.5(𝐿 + 1) 𝜎̂(𝐾) 𝑁 𝑖=1 Where 𝜎̂(𝐾) = √1 𝐿∑ ( 1 𝑁∑(𝐾𝑖𝑗 − 0.5(𝐿 + 1) 𝑁 𝑖=1 )) 2 𝑗
𝐾𝑖𝑗 = 𝑟𝑎𝑛𝑘(𝐴𝑅𝑖𝑗) the rank of abnormal returns in security i´s time series in the estimation window and event window
𝐿 = the number of total observations in the estimation window and event window 𝑁 =the number of securities
14
5.
Data and variable
Apple Inc. and LG Electronics Inc. are considered as Samsung Electronics Co. competitors. In 3Q2016, Apple Inc. was the second brand that dominated the smartphone market share, while Samsung held most market share. iPhone 7, the flagship from Apple Inc., was launched in September 2016 and it was the closest rival of the Galaxy Note 7, and had a possibility to benefit from the Galaxy Note 7´s explosion. On the other hand, LG Group is a multinational conglomerate in South Korea as Samsung Group. Besides expertise in Chemicals and Telecommunication, LG Group also leads in the Electronic industry. LG Electronics Inc. not only produces Mobile communication but also specializes in Home Appliance and Air Solutions, Home Entertainment, and Vehicle Components. Since several industries are overlapped with Samsung Electronics Co., thus this dissertation includes LG Electronics Inc. in research.
This dissertation collects the closing stock prices of Samsung Electronics Co., Apple Inc. and LG Electronics Inc. from Thomson Reuter Eikon: Samsung Electronics Co. and LG Electronics Inc. are listed on South Korea Stock Exchange, Apple Inc. is listed on Nasdaq Global Select Consolidate. Regarding the market model, Thomson Reuters Global Technology is applied, which includes all the firms this dissertation researches.
Due to currency difference in each stock market, this dissertation exchanges South Korean Won to United States Dollar by the mid between bid price and ask price. In addition, the risk-free rate is derived from the U.S. Treasury bond for 3 months in 2016.
Event window period:
Explosion reports in Korea from the Thomson Reuter were published on 24th August, 2016, and
the event window is from 22nd to 26th August, 2016. The recall announcement from Samsung
Electronics Co. came out on 2nd September, 2016, and the event window lasts from 31th August
to 6th September, 2016. Ban from the FFA was released on 8th September, 2016, and recall
announcement from the CPSC was 9th September, 2016. The event period lasts from 7th to 13th
September, 2016. The product termination was issued on 11th October, 2016 and the event
15
6.
Main result
This section divides the results into two parts, individual analysis and aggregate analysis. The first section analyzes how Samsung, Apple, and LG’s stocks are influenced by the four events. Second section discusses how overall market is affected by the same events.
6.1 Explosion
6.1.1Samsung´s stock price
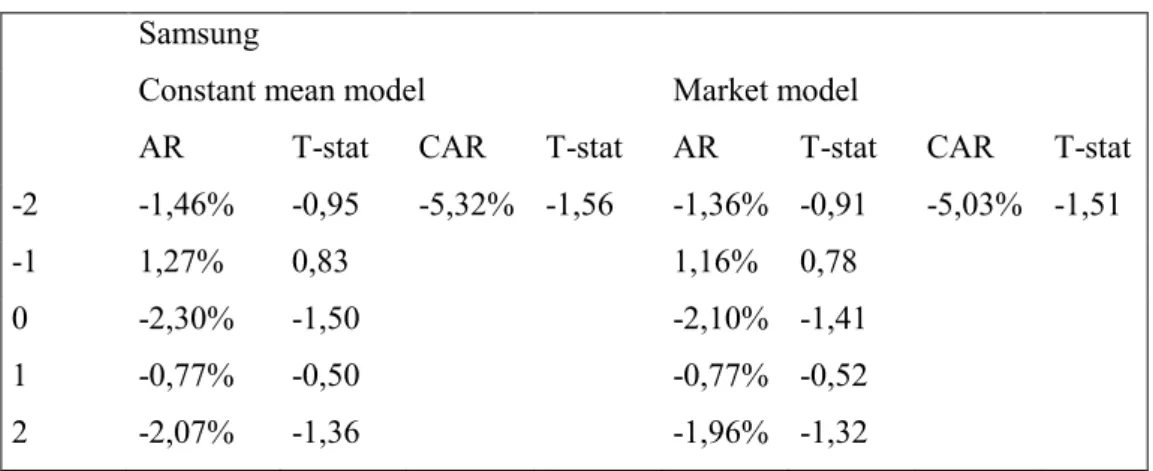
Table 1 displays the abnormal returns and cumulative abnormal returns in the constant mean model and the market model, and both models demonstrate similar outcomes. The negative abnormal returns dominate in both models, but positive abnormal returns perform one day before the explosion. Therefore, the information may not have leaked out before the announcement due to the different signs between day -1 and day 0. The t-statistic in abnormal return is not below or above the critical value at 5% and 10% significance levels, meaning that the results are not significant; in other words, the explosion had no impact on Samsung´s stock price. Even though the abnormal return is not significantly different from zero, the t-statistic of the cumulative abnormal return is -1.56 and -1.51 respectively in the constant mean model and in the market model. The result may imply that the explosion had a negative impact on Samsung´s stock price since the t-statistic approaches to -1.64 at a 10% significance level.
Table 1-results for the impact of explosion on Samsung´s stock Samsung
Constant mean model Market model
AR T-stat CAR T-stat AR T-stat CAR T-stat -2 -1,46% -0,95 -5,32% -1,56 -1,36% -0,91 -5,03% -1,51
-1 1,27% 0,83 1,16% 0,78
0 -2,30% -1,50 -2,10% -1,41
1 -0,77% -0,50 -0,77% -0,52
16
6.1.2Competitors
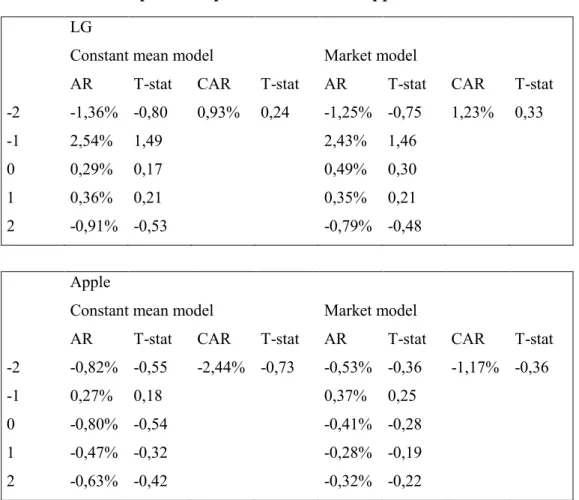
Table 2 displays the abnormal returns and cumulative abnormal returns on LG and Apple. During the event window, the stock price of LG does not perform obviously abnormal returns. In both models, the positive abnormal returns present from day -1 to day 1, but the negative abnormal returns demonstrate on day -2 and day 2. The results based on the two models do not present big differences, and the cumulative abnormal return is positive but not significant. Apple´s security does not reflect significantly abnormal return in the event window, and the cumulative abnormal return is -2.44% in the constant mean model and -1.17% in the market model.
To conclude, this dissertation cannot reject the null hypothesis that the explosion of Galaxy Note 7 had no impact on LG´s stock price and Apple´s stock price, separately.
Table 2-results for the impact of explosion on LG and Apple´s stock LG
Constant mean model Market model
AR T-stat CAR T-stat AR T-stat CAR T-stat -2 -1,36% -0,80 0,93% 0,24 -1,25% -0,75 1,23% 0,33 -1 2,54% 1,49 2,43% 1,46 0 0,29% 0,17 0,49% 0,30 1 0,36% 0,21 0,35% 0,21 2 -0,91% -0,53 -0,79% -0,48 Apple
Constant mean model Market model
AR T-stat CAR T-stat AR T-stat CAR T-stat -2 -0,82% -0,55 -2,44% -0,73 -0,53% -0,36 -1,17% -0,36 -1 0,27% 0,18 0,37% 0,25 0 -0,80% -0,54 -0,41% -0,28 1 -0,47% -0,32 -0,28% -0,19 2 -0,63% -0,42 -0,32% -0,22 ´s stock
17
6.2Voluntary recall
6.2.1Samsung
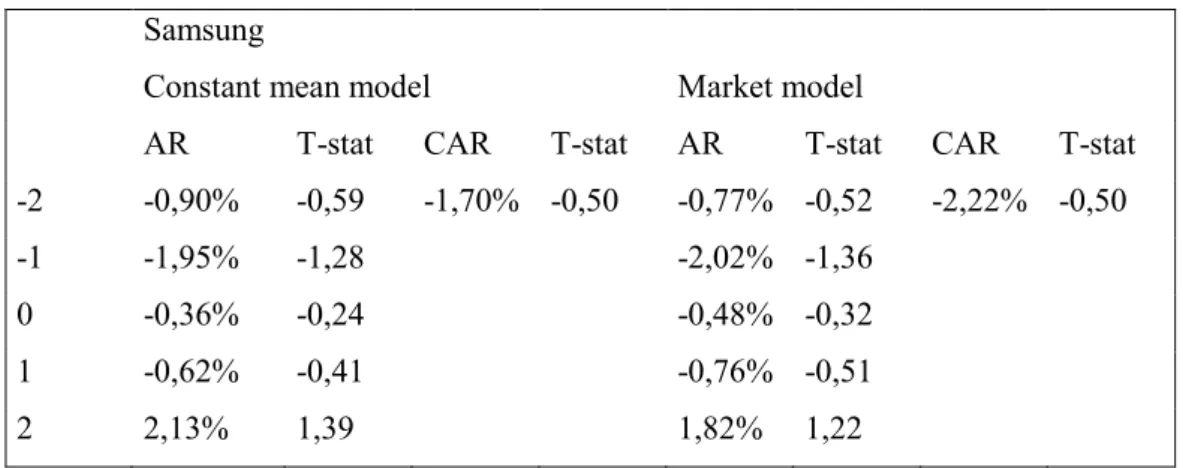
Table 3 exhibits abnormal returns on Samsung during the event window of voluntary recall. If the statistical values from both models are not significantly different from zero, then the hypothesis that no impact on stock price cannot be rejected. In general, the security performs negative abnormal returns except day 2, which presents 2.13% and 1.82% abnormal return in the constant mean model and the market model respectively.
Table 3-results for the impact of voluntary recall on Samsung´s stock Samsung
Constant mean model Market model
AR T-stat CAR T-stat AR T-stat CAR T-stat -2 -0,90% -0,59 -1,70% -0,50 -0,77% -0,52 -2,22% -0,50 -1 -1,95% -1,28 -2,02% -1,36 0 -0,36% -0,24 -0,48% -0,32 1 -0,62% -0,41 -0,76% -0,51 2 2,13% 1,39 1,82% 1,22 6.2.2Competitors
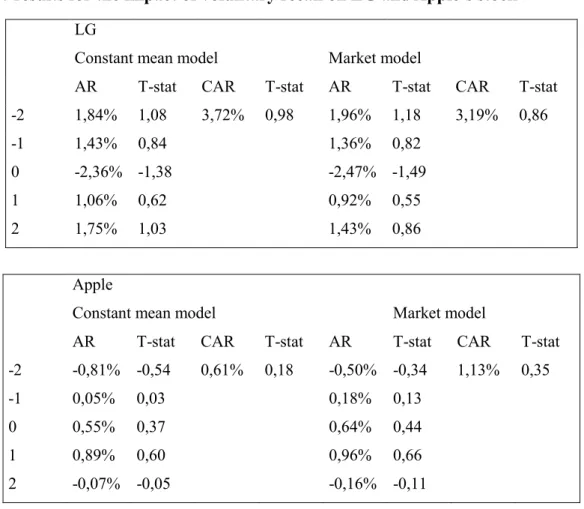
Table 4 illustrates the impact of voluntary recall on LG and Apple. On event day 0, LG´s stock price experiences negative abnormal return with -2.36% in the constant mean model and -2.47% in the market model. Except day 0, it demonstrates positive abnormal returns. Overall, the null hypothesis of voluntary recall having no influence on LG´s stock price can be accepted at 5% and 10% significance levels. For Apple, the t-statistic of abnormal returns and cumulative abnormal returns are not above or under the critical value, thus the null hypothesis of absent abnormal return cannot be rejected.
Therefore, the Samsung´s Galaxy Note 7 recall does not affect the stock price of Apple and LG at 5% and 10% significance levels.
18
Table 4-results for the impact of voluntary recall on LG and Apple´s stock LG
Constant mean model Market model
AR T-stat CAR T-stat AR T-stat CAR T-stat -2 1,84% 1,08 3,72% 0,98 1,96% 1,18 3,19% 0,86 -1 1,43% 0,84 1,36% 0,82 0 -2,36% -1,38 -2,47% -1,49 1 1,06% 0,62 0,92% 0,55 2 1,75% 1,03 1,43% 0,86 Apple
Constant mean model Market model
AR T-stat CAR T-stat AR T-stat CAR T-stat -2 -0,81% -0,54 0,61% 0,18 -0,50% -0,34 1,13% 0,35 -1 0,05% 0,03 0,18% 0,13 0 0,55% 0,37 0,64% 0,44 1 0,89% 0,60 0,96% 0,66 2 -0,07% -0,05 -0,16% -0,11 ´s stock
6.3Involuntary recall and ban
6.3.1Samsung
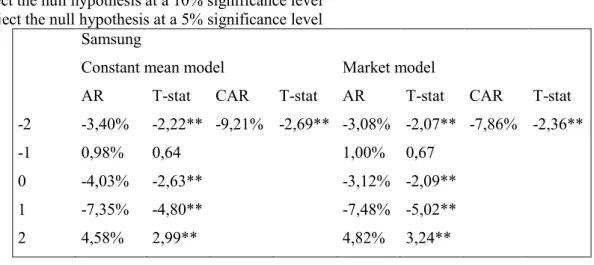
Table 5 exhibits the abnormal returns and cumulative abnormal returns derived from the involuntary recall and ban. On day -1, the FFA prohibited taking the Galaxy Note 7 into checked-in luggage and requested all Note 7s to be turned off in flight. On day 0, the CPSC advised to recall Galaxy Note 7.
The t-statistic on day -2 is -2.22 in the constant mean model and -2.07 in the market model, the null hypothesis is rejected at a 5% significance level, which means the event had an impact on Samsung´s stock price. On day -1, the abnormal return presents as positive, but it is not significantly different from zero. The abnormal return on day 0 is 4.03% with a tstatistic of -2.63 in the constant mean model, and -3.12% with a t-statistic of -2.09 in market model. The abnormal return on day 1 is -7.35% with a t-statistic of -4.80 in the constant mean model, and -7.48% with a t-statistic of -5.02 in the market model. Hence the effect from involuntary recall and ban is more influential on day 1 rather than day 0. Moreover, the abnormal return becomes
19 positive on day 2, with a t-statistic of 2.99 in the constant model and 3.24 in the market model. Under the null hypothesis, t-statistic result shows that abnormal return exits on day 2 is positively significantly different from zero. The reason could be that the price is relatively low one day before, then a small increase of stock price lead to relatively high return.
In general, the cumulative abnormal return is -9.21% with a t-statistic of -2.69 in the constant mean model, and -7.86% with a t-statistic of -2.36 in the market model. Therefore, the null hypothesis that the involuntary recall and ban had no impact on Samsung´s stock price is rejected since the cumulative abnormal return is significantly different from zero.
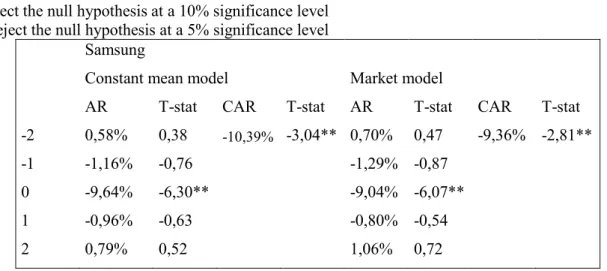
Table 5-results for the impact of involuntary recall and ban on Samsung´s stock *Reject the null hypothesis at a 10% significance level
**Reject the null hypothesis at a 5% significance level Samsung
Constant mean model Market model
AR T-stat CAR T-stat AR T-stat CAR T-stat -2 -3,40% -2,22** -9,21% -2,69** -3,08% -2,07** -7,86% -2,36** -1 0,98% 0,64 1,00% 0,67 0 -4,03% -2,63** -3,12% -2,09** 1 -7,35% -4,80** -7,48% -5,02** 2 4,58% 2,99** 4,82% 3,24** ´s stock 6.3.2Competitors
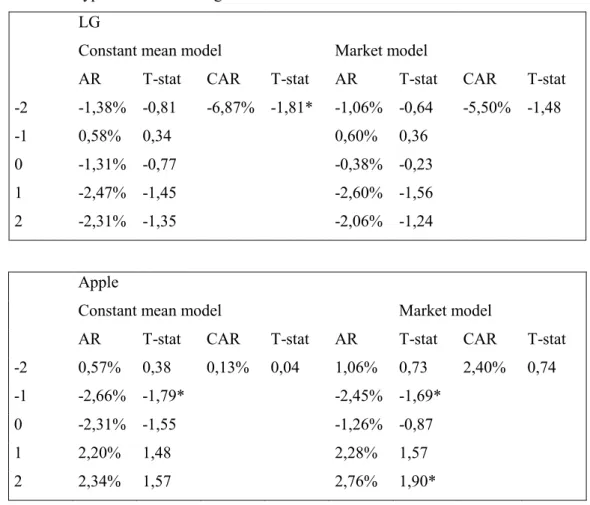
Table 6 illustrates the impact of involuntary recall and ban on LG and Apple. The t-statistics conducted on abnormal returns of LG stock are not significantly different from zero on any individual day, but the cumulative abnormal return reaches -6.87% with a t-statistic of -1.81 in the constant mean model, indicating to reject the null hypothesis at a 10% significance level, and the involuntary recall and ban had an impact on LG´s stock due to the existence of abnormal return. However, the t-statistic in the market model is -1.48, which is not rejected at a 10% significance level. As a result of different models, the standard deviation from the constant mean model is slightly higher than the market model, which leads to inconsistent results. On the other hand, the null hypothesis of absent cumulative abnormal return cannot be rejected for Apple´s security. Rather than aggregate effect, the abnormal return on day -1 is -2.66% with a t-statistic of -1.79 in the constant mean model, and -2.45% with a t-statistic of in the market model, thus
20 the event had an impact on Apple´s stock price. Nevertheless, on day 2 there is a positive abnormal return 2.76% based on the market model with a t-statistic of 1.90. Hence Apple´s security generates significant positive abnormal return on day 2 at a 10% significance level. Though Apple´s stock reflects significant abnormal return on specific date, the aggregate impact is not strong enough. Compared with LG´s security, Apple´s security is less influenced by Samsung´s involuntary recall and ban.
Table 6-results for the impact of involuntary recall and ban on LG and Apple´s stock *Reject the null hypothesis at a 10% significance level
**Reject the null hypothesis at a 5% significance level LG
Constant mean model Market model
AR T-stat CAR T-stat AR T-stat CAR T-stat -2 -1,38% -0,81 -6,87% -1,81* -1,06% -0,64 -5,50% -1,48 -1 0,58% 0,34 0,60% 0,36 0 -1,31% -0,77 -0,38% -0,23 1 -2,47% -1,45 -2,60% -1,56 2 -2,31% -1,35 -2,06% -1,24 Apple
Constant mean model Market model
AR T-stat CAR T-stat AR T-stat CAR T-stat -2 0,57% 0,38 0,13% 0,04 1,06% 0,73 2,40% 0,74 -1 -2,66% -1,79* -2,45% -1,69* 0 -2,31% -1,55 -1,26% -0,87 1 2,20% 1,48 2,28% 1,57 2 2,34% 1,57 2,76% 1,90*
6.4Termination
6.4.1SamsungTable 7 demonstrates the statistics in the event window when Samsung announced the official termination of Galaxy Note 7. The t-statistic of cumulative abnormal return is -3.04 in the constant mean model and -2.81 in the market model. Therefore, the null hypothesis of an absent abnormal return can be rejected at a 5% significance level, which means that the announcement of termination did have influence on Samsung´s stock price. Except day 0, the abnormal returns
21 during the event window is not significantly different from zero. The abnormal return presents -9.64% in the constant mean model and -9.04% in the market model, with t-statistics of -6.30 and -6.07 respectively on day 0. The result is clearly against the null hypothesis, which interprets that abnormal return do exist on announcement date.
Table 7-results for the impact of termination on Samsung´s stock *Reject the null hypothesis at a 10% significance level
**Reject the null hypothesis at a 5% significance level Samsung
Constant mean model Market model
AR T-stat CAR T-stat AR T-stat CAR T-stat -2 0,58% 0,38 -10,39% -3,04** 0,70% 0,47 -9,36% -2,81** -1 -1,16% -0,76 -1,29% -0,87 0 -9,64% -6,30** -9,04% -6,07** 1 -0,96% -0,63 -0,80% -0,54 2 0,79% 0,52 1,06% 0,72 ´ 6.4.2Competitors
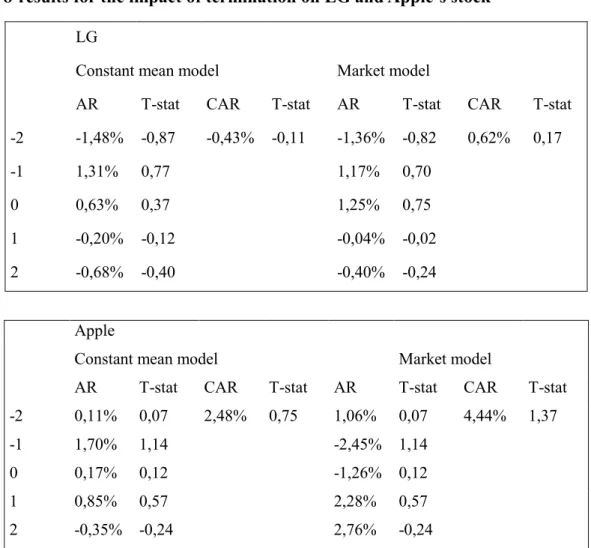
Table 8 exhibits the impact of termination on LG and Apple. The null hypothesis cannot be rejected as the estimated t-statistic is larger or smaller than the critical value. Hence the termination of selling, producing, and exchanging Galaxy Note 7 does not have impact on competitors´ securities. According to cumulative abnormal return on each firm, LG´s security demonstrates -0.43% in the constant mean model and 0.62% in the market model. Apple´s security generates higher cumulative abnormal return than LG, which is 2.48% in the constant mean model and 4.44% in the market model.
22
Table 8-results for the impact of termination on LG and Apple´s stock LG
Constant mean model Market model
AR T-stat CAR T-stat AR T-stat CAR T-stat -2 -1,48% -0,87 -0,43% -0,11 -1,36% -0,82 0,62% 0,17 -1 1,31% 0,77 1,17% 0,70 0 0,63% 0,37 1,25% 0,75 1 -0,20% -0,12 -0,04% -0,02 2 -0,68% -0,40 -0,40% -0,24 Apple
Constant mean model Market model
AR T-stat CAR T-stat AR T-stat CAR T-stat -2 0,11% 0,07 2,48% 0,75 1,06% 0,07 4,44% 1,37 -1 1,70% 1,14 -2,45% 1,14 0 0,17% 0,12 -1,26% 0,12 1 0,85% 0,57 2,28% 0,57 2 -0,35% -0,24 2,76% -0,24 Apple´s stock
6.5Standardized abnormal returns
Table 9 illustrates the statistical test for average cumulative standardized abnormal returns. This section considers the aggregate impact on three companies´ securities, providing overall impact on the market. Starting from explosion event, the t-statistic is -1.16 in the constant mean model and -0.87 in the market model. Under the null hypothesis, Galaxy Note 7´s explosion has no impact among securities of Samsung, LG and Apple. Next, the t-statistic for voluntary recall and termination is not significantly different from zero at a 10% significance level. Hence Samsung´s voluntary recall and termination announcement do not influence Samsung´s security or those of its competitors. Nevertheless, the sign of average cumulative standardized abnormal return on voluntary recall is opposite among these events. ACAR on voluntary recall is 22% in the constant mean model and 18% in the market model, but ACAR on termination is -78% in the constant mean model and -41% in the market model. On the other hand, the termination announcement generates more negative impact among securities than Samsung´s voluntary recall. Regarding the CPSC´s recall and the FFA´s ban, the null hypothesis of absent abnormal
23 return is rejected by -2.49 at a 5% significance level in the constant mean model, and by -1.74 at a 10% significance level in the market model. Furthermore, the systematic risk could be one of the reasons which makes it different. The market model considers the systematic risk, while the constant mean model does not. In the market model, the stock does not perform worse compared with the whole technology industry. Nevertheless, the constant mean model only considers the individual performance, the return during the event window is much worse than expected, then the standard deviation in the constant mean model is slightly higher than in the market model. To conclude, the recall announcement from the CPSC and prohibition from the FFA had an impact on securities of Samsung, LG, and Apple.
Table 9-results for standardized abnormal returns *Reject the null hypothesis at a 10% significance level **Reject the null hypothesis at a 5% significance level
Explosion Voluntary Recall Involuntary Recall and ban Termination
CMM MM CMM MM CMM MM CMM MM
ACAR -67% -50% 22% 18% -144% -100% -78% -41% Z -1,16 -0,87 0,38 0,30 -2,49** -1,74* -1,35 -0,71
6.6Non-parametric test
Table 10 presents the t-statistic based on sign test and rank test. For sign test, the results show that the null hypothesis cannot be rejected in each case. Since the abnormal return sorts in descending order, the more negative abnormal returns, the bigger is the number of rankings. With respect to outcome, the explosion, voluntary recall, involuntary recall and ban, and termination have no impact on stock price. The outcome for involuntary recall and ban is not consistent with standardized-abnormal-return test and sign test, and the main difference between the non-parametric test and the parametric test can be the magnitude. The sign test simply identifies positive or negative abnormal returns, but it does not consider the magnitude of abnormal returns.
With regards to rank test, there are no statistically significant results for each event except for involuntary recall and ban. Since the statistic is 2.13 in the constant mean model and the t-statistic is 1.66 in the market model, the null hypothesis of absent abnormal returns can be rejected at 5% and 10% significance levels. The reason why a negative abnormal return has a larger t-statistic is because the abnormal return sorts in descending order; therefore, the more
24 negative abnormal return there is, the bigger number of ranking is. To sum up, involuntary recall and ban had an impact among securities of Samsung, LG and Apple.
Table 10-results for non-parametric test
*Reject the null hypothesis at a 10% significance level **Reject the null hypothesis at a 5% significance level
Explosion Voluntary Recall Involuntary recall and ban Termination
CMM MM CMM MM CMM MM CMM MM
Z(sign) -0,58 -0,61 0,58 0,54 -0,58 -0,61 -0,58 0,54
Z(rank) 1,00 0,89 0,52 0,67 2,13** 1,66* 0,44 0,03
For each individual security, Samsung stock price does not react with significant abnormal returns for the explosion event and voluntary recall, but reflect significant abnormal returns for involuntary recall and ban as well as the announced termination, and both had a negative influence on stock price. Even though Samsung´s security does not reflect significant abnormal returns during the event window of explosion, CAR is observed to be -5.32% and -5.03% in distinct models, which implies that the market is not positive about profitability in the future. For voluntary recall, CAR is -1.70% in the constant mean model and -2.22% in the market model, and it explains that the market did not reward the voluntary recall behavior. Samsung stock price demonstrates stronger negative performance in the termination event than the recall event, which corresponds to Davidson and Worrell (1992) that the shareholders suffer more loss in the announcement of the product being taken off the market than being recalled. Comparing voluntary recall as well as involuntary recall and ban, the market punishes more on involuntary recall than voluntary recall.
LG, as the main competitor in South Korean market, did not perform significant abnormal returns for Galaxy Note 7´s explosion, voluntary recall, and termination event. Since the effect of abnormal return is not obvious, whether these events have positive or negative influence on LG´s stock price is hard to prove. However, Samsung´s involuntary recall and ban had a relatively negative impact on LG´s stock. With CAR 6.87% in the constant mean model and -2.06% in the market model, LG´s security had significant abnormal return in the constant mean model at a 10% significant level. In addition, LG´s security experienced less loss than Samsung´s security but experienced more loss than Apple´s security.
25 Apple stock prices did not present significant abnormal return for any of the events, thus there is no evidence to verify these events had either positive or negative impact on Apple´s security, and the outcome can infer that Apple does not experience essential benefit from Note 7 explosion and following events. Overall, Samsung´s security suffered more loss from Note 7 events than LG and Apple´s security.
Combined aggregate impact on Samsung, LG, and Apple´s security, the explosion, voluntary recall, and termination announcement did not have an impact on the market. However, involuntary recall and ban has financial impact on the market and investors have a more pessimistic attitude toward the event.
7.
Validation
To verify the methodology, the assumptions in the event study need to be examined: market efficiency, unanticipated events and absence of confounding effects. The theory assumes that financial impact from unanticipated event that relates to stock prices will reflect immediately. Therefore, these assumptions are justified in this section.
7.1
Market efficiency
Since Samsung stock price demonstrates significant abnormal returns for involuntary recall and ban, andtermination announcement, testing market efficiency is ideal to validate through these two events. Furthermore, the market model is selected by this examination because of the lower standard deviation compared with the constant mean model. To verify whether the market incorporates the information in time, this examination extends the event window. However, the length of the event window is restricted since some corporate events occur close to the event day, and have possibility to affect the stock price.
Table 11 exhibits the market efficiency in the case of involuntary recall and ban. On day -2, one day before the prohibition was published by the FFA, the null hypothesis is rejected at a 5% significance level, indicating that the information could have leaked out before the official declaration. On day -1, when the FFA declared the ban, the market does not perform significant abnormal return. However, the market reflects significantly negative abnormal return on day 0,
26 when the involuntary recall was issued, with a t-statistic of -3.04. One possible explanation could be that stockholders are not allowed to make a trade on the FFA´s announcement day, and that they were forced to wait until next day to react, which shows that the market is not efficient enough to adjust the price immediately. On day 1, the null hypothesis is even more strongly rejected by a t-statistic of -4.84, which implies that the information was not completely incorporated by price on day 0, and some investors took action one day after the announcement. On day 2, the positive significant return may be the result of relatively low stock price of the day before. On day 7, the significant abnormal return demonstrates, but it may be affected by another event. Therefore, market performs efficiently.
Table 11-results for market efficiency test on Samsung´s stock for involuntary recall and ban event
*Reject the null hypothesis at a 10% significance level **Reject the null hypothesis at a 5% significance level
day Date AR T-stat day Date AR T-stat -8 30-Aug-16 0,97% 0,65 1 12-Sep-16 -7,20% -4,84** -7 31-Aug-16 -1,21% -0,81 2 13-Sep-16 4,45% 2,99** -6 1-Sep-16 -1,64% -1,10 3 19-Sep-16 1,99% 1,34 -5 2-Sep-16 -0,35% -0,23 4 20-Sep-16 2,25% 1,51 -4 5-Sep-16 0,29% 0,20 5 21-Sep-16 -0,02% -0,01 -3 6-Sep-16 2,01% 1,35 6 22-Sep-16 1,62% 1,09 -2 7-Sep-16 -3,16% -2,12** 7 23-Sep-16 -3,25% -2,19** -1 8-Sep-16 0,82% 0,55 8 26-Sep-16 0,27% 0,18 0 9-Sep-16 -4,52% -3,04**
Table 12 represents the market efficiency in the case of termination. Before the day of declaring termination, the Samsung´s security does not generate significant abnormal return, except day -3, which presents 4.14% abnormal return with a t-statistic of 2.78. This abnormal return may have derived from information that leaked out, otherwise the positive abnormal return cannot be explained. If the information was leaked out, the abnormal return before the event is supposed to have consistent sign with event day. After the event, there is a significant abnormal
27 return on day 8, but it may not be connected to the termination. In general, the market does not perform significant abnormal return after the Note 7´s termination was declared, and the market reflects the price efficiently
Table 12-results for market efficiency test on Samsung´s stock for termination day Date AR T-stat day Date AR T-stat -8 28-Sep-16 -1,16% -0,78 1 12-Oct-16 -0,80% -0,54 -7 29-Sep-16 1,84% 1,23 2 13-Oct-16 1,06% 0,72 -6 30-Sep-16 -0,52% -0,35 3 14-Oct-16 0,36% 0,24 -5 4-Oct-16 -0,33% -0,22 4 17-Oct-16 0,63% 0,42 -4 5-Oct-16 0,08% 0,06 5 18-Oct-16 0,33% 0,22 -3 6-Oct-16 4,14% 2,78** 6 19-Oct-16 2,39% 1,61 -2 7-Oct-16 0,70% 0,47 7 20-Oct-16 -1,40% -0,94 -1 10-Oct-16 -1,29% -0,87 8 21-Oct-16 -2,72% -1,82* 0 11-Oct-16 -9,04% -6,07**
7.2
Anticipation
One of the assumptions is that the event cannot be anticipated; in other words, information is not accessible before the media or authorities concerned publish the information. If the event is anticipated, inside trading might be undertaken then the security price deviates. Because some people have access to non-public information before the public are informed, they make the “inside trading” to prevent loss or gain profit. As mentioned, significant abnormal return reveals that the day before the prohibition was published by the FFA, with -3.16% abnormal return on Table 11. The insider might speculate that the ban from the FFA has a negative impact on Samsung´s stock price. In order to prevent loss, they might decide to sell the stock price before the information releases. The signal that prohibited information leaks out can be proven by a t- statistic of -2.12, which is rejected at a 5% significance level. In the case of termination, this dissertation cannot detect the signal of inside trading, since the negative abnormal return is not significant before the announcement.
28
7.3
Cofounding effect
Other corporate events are unavoidable during the event windows and estimation window. Regarding the event, the explosion report was issued on 24th August, 2016, Samsung´s recall
was published on 2nd September, the ban from the FFA was released on 8th September, the recall
from the CPSC announced on 9th September, and the termination declared on 11th October. This
dissertation excludes the launch of Galaxy Note 7 on 19th August and the launch of iPhone 7 on
16th September in the estimation window and event windows, in order to prevent the possible
impacts on the results. Several corporate events occurred in the estimation window: Asian Investment Conference took place from 5th to 8th April, Apple reported 2Q2016 results on 26th
April, Apple announced new iOS App Design on 18th May, and Samsung announced 2Q2016
Earnings Conference Recall; however, these events are not closely connected to the events that this dissertation researches.
In addition to the estimation window, this dissertation also investigates the cofounding effect in the event windows. Samsung organized Samsung Group Asia Conference from 29th August to
2nd September, Merrill Lynch 2016 Korea Conference took place from 6th to 7th September, and
Apple stated to reinvest wireless headphones on 7th September. Nevertheless, these events are
weekly relevant to Samsung´s recall and authorities-concerned announcement. Thus the confounding effect is absent. During the event window of termination, Samsung issued Earning Guidance for 3Q2016 on 7th October, but Samsung´s security does not have significant
abnormal return on this day. Thus this forecasts the corporate´s performance did not have strong impact on stock price; moreover, it is not strongly relevant to termination event.
8.
Rationalizing the effect
Based on the results, the events of involuntary recall and ban from the authorities concerned and termination had financial impact on Samsung´s stock price, and this dissertation verifies the research outcome with corporate reports, press articles, and analyst reports.
8.1
Press article and analyst report
On the day that the CPSC announced the recall, Samsung´s stock price slumped by 11% for two days, which was the largest depreciation since 2008, and USD 22 billion market value
29 vaporized (Bloomberg5)
On the day Samsung released the termination announcement, Samsung´s stock price decreased more than 7% in two months after the launch, which dropped from KRW 1675000 to KRW 1545000, and Samsung´s market value suffered USD 18 billion loss. The huge amount of recall cost, which includes advertising, collecting, product repair, replacement, exchange and refund, is the main reason that market is not positive toward Samsung´s future financial report. However, Analyst Dan Baker thought the market overreacted since he estimated the Galaxy Note 7 only composed 8.5% of the total net profit (Bloomberg ). The estimated recall cost is at least USD 2 billion for 3.06 million Samsung Note 7 were recollected, and the estimated Unit Sold is 1.59 million which is far behind the 13 million for shipment. Furthermore, the cost of termination decision is evaluated to be USD 5 billion in the worst-case scenario. The expected revenue lost is USD 2.7 million, and predicted financial damage is USD 1 billion.
8.2
Samsung reports
Besides the investigation from media and analysts, the seasonal and annual firm reports illustrate the financial impact caused by Galaxy Note 7 on the income statement.
Table 13 expresses the income statement of 3Q2016, 2Q2015, and 3Q2015 when Galaxy Note 5 was released in August. Checking the numbers of 3Q2015, the sales dropped by 7.47% and declined to KRW 47.82 trillion, and the gross profit declined by 8.32% to KRW 18.4 trillion. Selling, General, and Administrative as well as Research and Development expense increased in 3Q2016; however, the gross profit in 3Q2016 was worse than 3Q2015, which lead to the operating profit shrinking to KRW 5.2 trillion and plunging 29.63%. In addition, the net profit dropped to KRW 4.54 trillion, less than the KRW 5.85 trillion in 2Q2016, and fell by 16.85% in comparison with 3Q2015.
30
Table 13-Samsung´s income statement of 3Q2016
The income statement of 4Q2016 is shown in Table 14. The sales slightly increased by 0.02% in 4Q2016 relative to 4Q2015, and rose by 11.52% relative to 3Q2016. Due to the decrease in cost of sales in 4Q2016, the growth profit improved by 16.02% and reached to KRW 22.45 trillion. Since the increased expense was small, the operating profit shot to KRW 9.22 trillion with a 50.16% boom. Net profit in 4Q2016 surged to KRW 7.09 trillion, a double net profit in 4Q2015, and KRW 2.55 trillion more than 3Q2016.
Next, this dissertation evaluates Samsung´s seasonal profitability. Table 15 describes the ability to generate cash-flow in 3Q2016. The return on equity declined by 23% and the EBITDA Margin also dropped by 13% in 3Q2016, which was an obvious sign that Samsung in 3Q2016 was not able to generate as much profit as 3Q2015. The performance of profitability in 3Q2016 was 0.09, inferior to 3Q2015 and 2Q2016.
Key ratio of profitability is displayed in Table 16. The return on equity in 4Q2016 shot up by 114%, which reached to 15%, and the EBITDA Margin improved by 24% which climbed to 26%. The capability of generating cash flow in 4Q2016 was stronger than 4Q2015 and 3Q2016.
6 Selling, General, and Administrative expense 7 Research and Development expense
Unit: KRW Trillion 3Q2016 ∆Y 3Q2015 ∆Q 2Q2016
Sales 47,82 -7,47% 51,68 -6,12% 50,94 Cost of Sales 29,41 -6,96% 31,61 -0,68% 29,61 Gross Profit 18,4 -8,32% 20,07 -13,74% 21,33 S G and A expense6 13,2 4,10% 12,68 0,15% 13,18 R and D expense7 3,51 2,63% 3,42 0,29% 3,5 Operating Profit 5,2 -29,63% 7,39 -36,12% 8,14
Other non-operating income/expense 0,54 -0,08 -0,24
Equity method gain/loss 0,01 0,02 0,004
Finance income/expense 0,23 0,06 0,16
Profit Before Income tax 5,97 -19,22% 7,39 -26,02% 8,07
Income tax 1,43 -25,91% 1,93 -35,59% 2,22
31
Table 14-Samsung´s income statement of 4Q2016
Unit: KRW Trillion 4Q2016 ∆𝑌 4Q2015 ∆𝑄 3Q2016 Sales 53,33 0,02% 53,32 11,52% 47,82 Cost of Sales 30,88 -9,07% 33,96 5,00% 29,41 Gross Profit 22,45 16,02% 19,35 22,01% 18,4 S G and A expense 13,23 0,15% 13,21 0,23% 13,2 R and D expense 3,54 2,31% 3,46 0,85% 3,51 Operating Profit 9,22 50,16% 6,14 77,31% 5,2
Other non-operating income/expense 0,11 -2,5 0,54
Equity method gain/loss 0,001 0,99 0,01
Finance income/expense 0,21 0,1 0,23
Profit Before Income tax 9,55 102,33% 4,72 59,97% 5,97
Income tax 2,46 64,00% 1,5 72,03% 1,43
Net profit 7,09 120,19% 3,22 56,17% 4,54
Table 15-Samsung´s key profitability indicator of 3Q2016
3Q2016 ∆Y 3Q2015 ∆Q 2Q2016 ROE 10% -23% 13% -23% 13% Profitability(Net profit/Sales) 0,09 -18% 0,11 -18% 0,11 Asset turnover(Sales/Asset) 0,79 -9% 0,87 -6% 0,84 Leverage(Asset/Equity) 1,36 -1% 1,37 1% 1,35 EBITDA Margin 21% -13% 24% -16% 25%
Table 16-Samsung´s key profitability indicator of 4Q2016
4Q2016 ∆𝑌 4Q2015 ∆𝑄 3Q2016 ROE 15% 114% 7% 50% 10% Profitability(Net profit/Sales) 0,13 117% 0,06 44% 0,09 Asset turnover(Sales/Asset) 0,85 -6% 0,9 8% 0,79 Leverage(Asset/Equity) 1,36 0% 1,36 0% 1,36 EBITDA Margin 26% 24% 21% 24% 21%
32 Samsung Electronics Co. not only leads the smartphone market, but also specializes in other technology industries. In order to disclose the impact from Galaxy Note 7´s explosion, this dissertation elaborates the sales and net profit from individual section. Table 17 displays the sales in 3Q2016, and it is comprised of three sectors, Consumer Electronic, IT and Mobile communication, and Device Solutions. The Visual Display sector is the main division in Consumer Electronic, and Mobile sector plays essential role in IT and Mobile communication. The Device Solutions sector is composed by the Semiconductor and Display Panel, and Memory section is under Semiconductor. In 3Q2016, IT and Mobile communication contributed the most revenue, which accounted for 47.14%, and following is Device Solutions which provided 42.43% revenue and Consumer Electronic was the least that generated 23.50%. However, except for the Semiconductor section, most sections presented decreased revenue in 3Q2016 relative to 3Q2015. Sales from the Mobile sector especially dropped by 14.84% and the total IT and Mobile communication fell by 15.30%.
Table 18 demonstrates net profit from different sectors in 3Q2016. It is observed that the net profit from IT and Mobile communication in 3Q2016 plummeted 95.83% compared with 3Q2015 when Galaxy Note 5 launched, only KRW 0.1 trillion left, and far behind KRW 4.32 trillion in 2Q2016. Therefore, it only made up for 1.92% of total net profit. For Consumer Electronic, net profit increased to KRW 0.77 trillion, and constituted 14.81% overall net profit. Device Solutions had outstanding performance since net profit surged 84.62% to KRW 4.4 trillion and accounted for 84.62% of all net profit. For Display Panel, net profit in 3Q2016 boosted 628.57% relative to last season and raised 9.68% compared to last year
Profit Margin from each section in 3Q2016 is illustrated in Table 19. Even though IT and Mobile communication in 3Q2016 had the highest sales among each section, it was not profitable at all. Profit Margin from the IT and Mobile communication sector plummeted 95% to KRW 0.004 trillion compared with last year and slumped 97% relative to last quarter. In addition, the Consumer Electronic demonstrated a 0.07 Profit Margin, with a 121% increase from last year. The sector of Device Solutions performed a 0.22 Profit Margin, and the Semiconductor sector which is under the Device Solutions sector had a 0.26 Profit Margin and represents the most profitable section. For the Display Panel sector, it was boosted by 563% compared to last quarter, and increased 16% relative to last year.
33
Table 17-Samsung´s Segment Sales of 3Q2016
It includes Consumer Electronic, IT and Mobile communication, Device Solutions. Visual Display is under Consumer Electronic, Mobile is under IT and Mobile communication, and Semiconductor and Display Panel are under Device Solutions. In addition, Memory is under Semiconductor.
(In KRW Trillion) 3Q2016 % ∆Y 3Q2015 % ∆Q 2Q2016 % C E8 11,24 23,50% -3,02% 11,59 22,43% -2,68% 11,55 22,67% V D9 6,6 13,80% -5,31% 6,97 13,49% -0,15% 6,61 12,98% IT and M C10 22,54 47,14% -15,30% 26,61 51,49% -15,14% 26,56 52,14% Mobile 22,09 46,19% -14,84% 25,94 50,19% -15,27% 26,07 51,18% D S11 20,29 42,43% -0,10% 20,31 39,30% 10,09% 18,43 36,18% Semiconductor 13,15 27,50% 2,57% 12,82 24,81% 9,58% 12 23,56% Memory 9,86 20,62% 7,88% 9,14 17,69% 16,96% 8,43 16,55% D P12 7,06 14,76% -5,74% 7,49 14,49% 9,97% 6,42 12,60% Total 47,82 51,68 50,94
Table 18-Samsung´s Segment net profit of 3Q2016
It includes Consumer Electronic, IT and Mobile communication, Device Solutions. Semiconductor and Display Panel are under Device Solutions.
(In KRW Trillion)
8 Consumer Electronic 9 Visual Display
10 under IT and Mobile communication 11 Device Solutions 12 Display Panel 3Q2016 % ∆𝑌 3Q2015 % ∆𝑄 2Q2016 % C E 0,77 14,81% 113,89% 0,36 4,87% -25,24% 1,03 12,65% IT and MC 0,1 1,92% -95,83% 2,4 32,48% -97,69% 4,32 53,07% D S 4,4 84,62% -5,38% 4,65 62,92% 57,71% 2,79 34,28% Semiconductor 3,37 64,81% -7,92% 3,66 49,53% 27,65% 2,64 32,43% D P 1,02 19,62% 9,68% 0,93 12,58% 628,57% 0,14 1,72% Total 5,2 7,39 8,14