Universidade de ´
Evora - Escola de Ciˆ
encias e Tecnologia
Mestrado em Biologia da Conserva¸c˜
ao
Disserta¸c˜ao
Distribution patterns and functional traits of nematode
meiofauna assemblages in Sado Estuary (Portugal)
Teresa Charrua Rosmaninho
Orientador(es) | Helena Ad˜ao
Katarzyna Krystyna Sroczynsca
´
A disserta¸c˜ao foi objeto de aprecia¸c˜ao e discuss˜ao p´ublica pelo seguinte j´uri nomeado pelo Diretor da Escola de Ciˆencias e Tecnologia:
• Presidente | Paulo S´a Sousa (Universidade de ´Evora)
• Vogal | Sofia Alexandra Pinto Ramalho (Universidade de Aveiro)
• Vogal-orientador | Katarzyna Krystyna Sroczynsca (Universidade de ´Evora)
´
UNIVERSITY OF ÉVORA
SCHOOL OF SCIENCES AND TECHNOLOGY
DEPARTMENT OF BIOLOGY
Distribution patterns and functional traits of
benthic nematode assemblages in Sado
Estuary (Portugal).
Teresa Rosmaninho
Promoters:
Dra. Katarzyna Sroczyńska and
Prof. Dra. Helena Adão
Master in Conservation Biology
Dissertation
UNIVERSIDADE DE ÉVORA
ESCOLA DE CIÊNCIAS E TÉCNOLOGIA
DEPARTAMENTO DE BIOLOGIA
Padrões de distribuição espacial das
comunidades de nematodes bentónicos e das
suas características funcionais no Estuário do
Sado (Portugal).
Teresa Rosmaninho
Orientadoras:
Dra. Katarzyna Sroczyńska e
Prof. Dra. Helena Adão
Master in Conservation Biology
Dissertation
Acknowledgements
First to life, for allowing sensations such as reaching a goal.
To my mom Zelinda Charrua, my dad Francisco Rosmaninho and my boyfriend
Stéphane Tomaz for pulling me up when everything seems to be wrong, for supporting
me in all my choices and for their comprehension, affection and patient in all good and
bad moments.
To my parents in law Carla Tomaz and Carlos Tomaz, my brothers in law John Tomaz
and Marco Tomaz and my friends, Cátia Cordeiro, Daniel Reto, Verónica Carriço and
Diogo Rodrigues for the worry with my work development and to stand by my side in
every special moment.
To my Promoter, Prof. Dra. Helena Adão, by the availability in the clarification of
doubts during the work.
To my co-Promoter Dra. Katarzyna Sroczyńska, for her patient to clarify every doubts
and comprehension of my crisis.
And finally, to Sara Roman for her help in laboratory work, and for her attendance in
this course.
Contents
Abstract ... 9 Resumo ... 10 General Introduction ... 11 State of art ... 12 Research questions ... 13 Hypothesis ... 13 Methodology ... 13Study area and sample stations ... 14
Sampling and sample treatment ... 14
Environmental variables ... 14
Criteria for delineation of Estuary Sections ... 15
Meiofauna collection and identification ... 15
Data analysis... 16 Univariate analysis ... 16 Multivariate analysis ... 17 Results ... 18 Environmental data ... 18 Biological data ... 20 Meiofauna assemblages ... 20
Nematode assemblages –structural diversity ... 21
Nematode assemblages-functional traits ... 26
Multivariate PERMANOVA test ... 27
Simper analysis ... 28
Nematode Assemblages and Estuarine gradient ... 30
Discussion ... 31
Functional response ... 34
Factors that influence nematode assemblages ... 34
Implications for WFD and MSFD ... 35
Study limitations ... 37
Conclusions ... 37
References ... 39
List of Tables
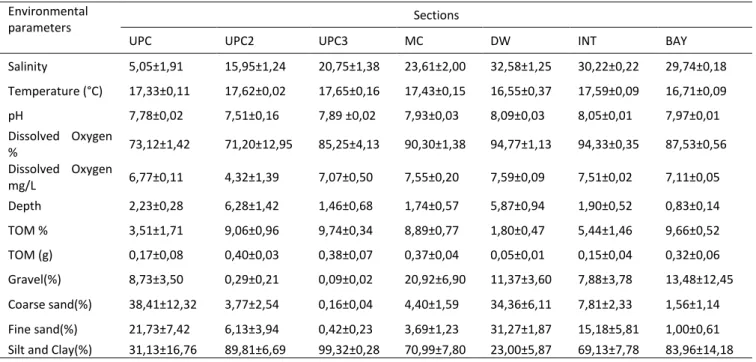
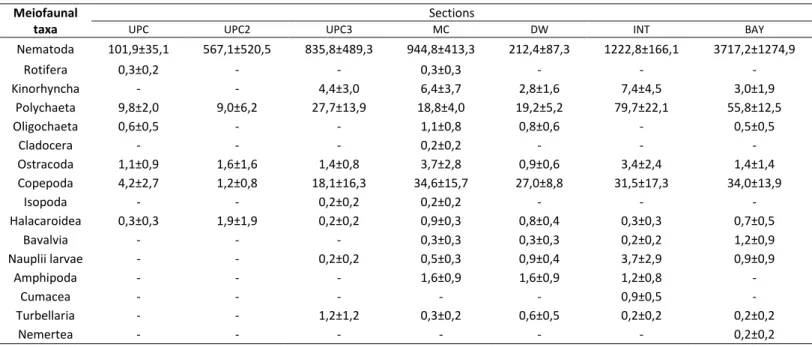
Table 1 Mean and standard error of environmental variables per estuary section _________________ 18 Table 2 Mean density / SE (number of individuals per 10 cm2) of meiofaunal groups in each estuarine
section _________________________________________________________________________ 20 Table 3 One factor PERMANOVA test with “Number of species” (S), “Total number of individuals” (N),
"Shannon-Wiener "and “Simpson” indices. ____________________________________________ 24 Table 4 Multivariate PERMANOVA analysis of nematode composition among estuary sections ______ 27 Table 5 Pairwise test, Average Similarity between/within groups. Bold values represent significant p-value<0,05. _____________________________________________________________________ 28 Table 6 The Simper analysis with the percentage contribution of set of genera to similarity and
dissimilarity among sections. In grey are represented the genera that contribute to the similarity between sections and in white, the genera that contribute to dissimilarities. ________________ 29 Table 7 Mean density ± standard error (SE) of nematode genera (number of individuals per 10 cm-2) on
Sections (UPC, UPC2, UPC3, MC, DW, INT, BAY). Trophic group (TG) and c-p value of each genera included. Only the most abundant genera are included in this table ________________________ 44
List of Figures
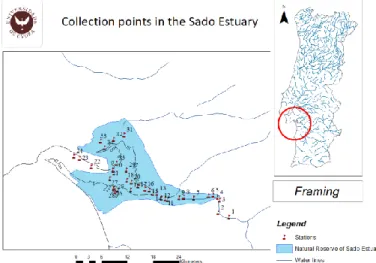
Fig 1 Sampling points in Sado Estuary with blue area indicating limits of the Natural Reserve Area ... 14
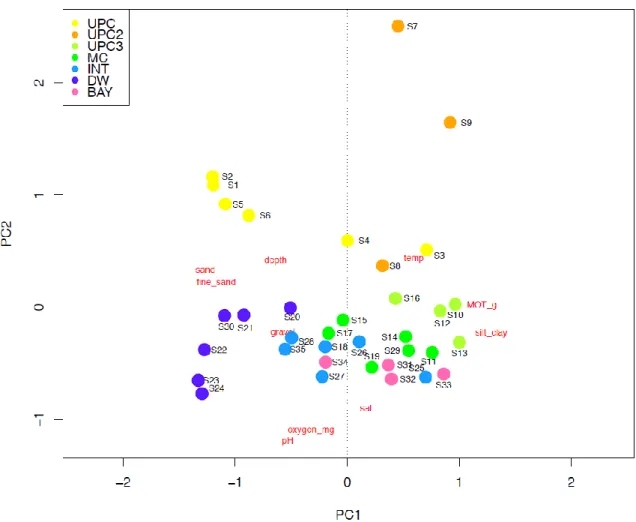
Fig 2 Principal Component (PCA) plot based on the environmental variables ... 19
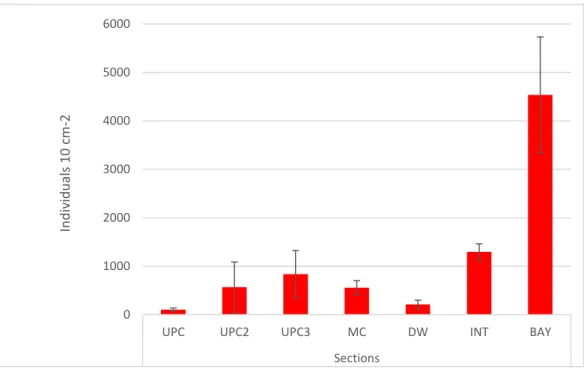
Fig 3 Mean density ± standard error (SE) of nematodes (total number of individuals per 10 cm-2) per section ... 22
Fig 4 Total number of genera at each section ... 22
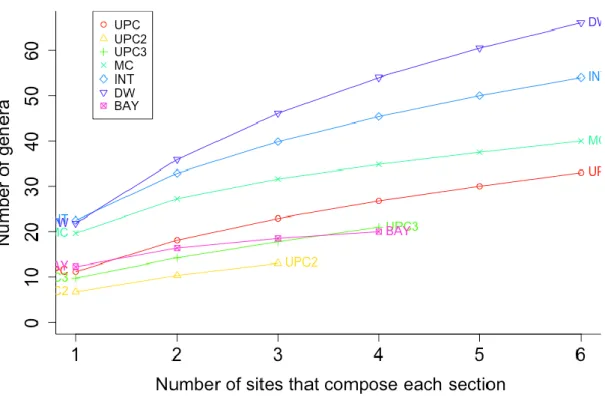
Fig 5 Genera rarefaction curve (EG) for sections (“UPC”, “UPC2”, “UPC3”, ”MC”, ”DW”, ”INT” and “BAY”). ... 23
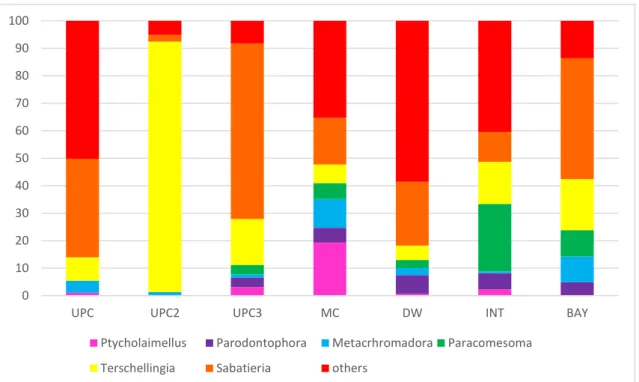
Fig 6 Relative density (%) of the most abundant nematode genera at each estuarine section (“UPC”, “UPC2”, “UPC3”, ”MC”, ”DW”, ”INT” and “BAY”). ... 24
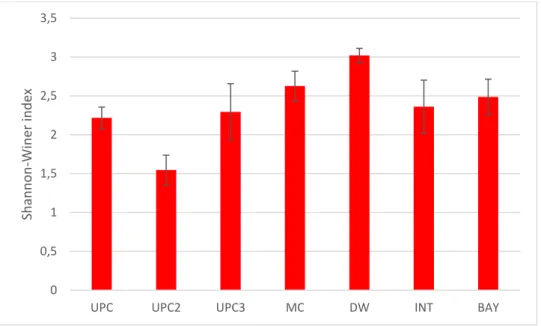
Fig 7 Shannon-Wiener Index at each section ... 25
Fig 8 Simpson Index at each section ... 25
Fig 9 Relative density (%) of the trophic groups according to Wieser (1953) ... 26
Fig 10 Mean values ± standard error (SE) of the Index of Trophic Diversity (ITD-1) and Maturity Index (MI) in each section ... 27
Fig 11 Redundancy analysis (RDA) plot of the Hellinger transformed relative abundance data matrix and environmental variables. ... 30
9
Distribution patterns and functional traits of benthic nematode
assemblages in Sado Estuary (Portugal).
Abstract
Estuaries are naturally stressed systems with a high degree of variability in their physical-chemical characteristics. The natural gradient of salinity, linked with other gradients (e.g. sediment type and dynamics, oxygen availability, temperature and current speed) are well documented as important factors in determining temporal and spatial variations in meiofauna communities. Among the estuarine biological components, meiobenthic communities are good indicators of environmental conditions and therefore changes in their density, diversity, structure and functioning indicate important alterations of the ecosystem. In fact, the phylum Nematoda are the ideal indicator group because they are the most diverse and abundant meiofaunal metazoans of aquatic habitats. The main aim of this study was to advance the general understanding of the spatial distribution patterns of the nematode assemblages along the Sado estuarine gradient. There were analysed structural components of nematode assemblages (abundance, species richness and diversity metrics) as well as functional attributes such as Maturity Index and Trophic Diversity Index. Additionally, multivariate analysis on community data was performed, together with Redundancy Analysis to understand which environmental factors explain the variations in the community. The results showed significant differences in the nematode structural assemblage patterns among the estuary sections. The abundance and diversity of nematodes were related with environmental variables including TOM (Total Organic Matter) concentration, the sediment grain size and the levels of dissolved oxygen. The sections with the highest TOM and lowest oxygen concentration were dominated by the opportunistic genera that were more resistant to unfavourable conditions and were responsible for low species richness. Functional attributes did not exhibit any significant differences among Estuary sections. As a conclusion, nematodes assemblages turned to be good bioindicators of heterogenous environmental conditions of this estuary,especially regarding the detection of sites with higher TOM concentration.
10
Padrões de distribuição espacial das comunidades de nematodes
bentónicos e das suas características funcionais no Estuário do Sado
(Portugal).
Resumo
Os estuários são sistemas naturalmente perturbados, com grande variabilidade nas suas características físicas e químicas. O gradiente natural de salinidade, associado a outros gradientes (por exemplo, granulometria, hidrodinamismo, oxigénio, temperatura e correntes das marés), estão bem documentados como sendo fatores determinantes para as variações temporais e espaciais das comunidades de meiofauna. Entre os diferentes componentes biológicos associados a um ambiente estuarino, as comunidades meiobentónicas são consideradas bons indicadores das condições ambientais. Isto porque, quando existem alterações na sua abundância, estrutura funcional pode ser resultado do efeito de alterações nos ecossistemas. Nematoda é o grupo taxonómico da meiofauna que em geral é mais abundante e é considerado um bom indicador ecológico. O principal objetivo deste estudo é analisar o padrão de distribuição espacial das comunidades de nematodes ao longo do gradiente estuarino do estuário do Sado. Foram analisadas variáveis ambientais consideradas determinantes para os padrões de distribuição da abundância e composição de géneros ao longo do estuário do Sado, assim como para a distribuição dos atributos funcionais das comunidades. Através da análise multivariável das abundância e diversidade comunidades foi possível determinar os fatores ambientais que melhor explicam as variações na comunidade. Também foi feita analise multivariada com base nos dados das comunidades tais como a Analise de Redundância para entender quais os fatores ambientais que melhor explicam as variações das comunidades. Os resultados mostram diferenças significativas na densidade e diversidade das comunidades de nematodes entre as várias secções do estuário. A densidade de nematodes apresentou relação com diferentes variáveis ambientais analisadas, tais como a concentração de TOM (matéria orgânica total), granulometrias e consequentemente os níveis de oxigénio dissolvido. Nas seções com maior TOM e menor concentração de oxigênio verificou-se que os géneros oportunistas eram mais abundantes, sendo estesmais resistentes a condições desfavoráveis e responsáveis pela baixa riqueza de espécies. As características funcionais não apresentaram diferenças significativas entre as seções do estuário. Pode concluir-se que as comunidades de nematodes se tornaram bons bioindicadores de condições ambientais heterogêneas deste estuário, principalmente quanto à deteção de sítios com maior concentração de TOM.
11
General Introduction
Estuaries
There is no unanimous definition of an estuary and through the years various classifications have been proposed (Potter et al., 2010). Followed by Potter et al. (2010) Estuary can be defined as: ‘‘(…) partially enclosed coastal body of water which is either permanently or periodically open to the sea and within which there is a measurable variation of salinity due to the mixture of sea water with fresh water derived from land drainage. Consequently, Estuaries are considered highly variable both spatially and temporally. The estuarine gradient is mainly defined based on following abiotic conditions: salinity, sediment grain size and organic matter content, temperature, oxygen availability, but also hydrodynamic conditions such as current speed (Adão et al., 2009; Ferrero et al., 2008; Soetaert et al., 1995). All of these parameters can vary over a scale of kilometres. Spatial gradients can occur geographically, topographically, horizontally, vertically, across, and through others complex patterns. One of most important parameter in the Estuaries is salinity. Estuaries show a clear decreasing salinity gradient from downstream towards upstream where saline water (euhaline 30-40 or hypersaline > 40) changes to fresh water (oligohaline 0.5-5 or freshwater <0.5).
Estuarine quality paradox
Due to these high spatial and temporal natural variability in abiotic conditions estuaries are regarded as naturally stressed areas (Michael Elliott & Quintino, 2007). These natural estuary properties hamper the use of ecological water quality indicators. Benthos is commonly used as biological indicator, within Water Framework Directive (WFD) and Marine Strategy Framework Directive (MSFD) to determine the water quality in European coastal waters. Mentioned indices aim to determine anthropogenic impact and are based on the composition of stress tolerant and stress sensitive species. The basis for using these indices are based upon the assumption that in the anthropogenically impacted areas will host less stress sensitive species in comparison to stress tolerant ones. Nevertheless, the situation that normally occurs in estuaries is that in the areas with less favourable abiotic conditions there are less sensitive species, which does not mean that these areas are anthropogenically impacted. For example, salinity is known to be a natural stressor responsible for differences in the community’s composition and abundance of benthos in the sediments. This difficulty in disentangling natural from anthropogenic conditions using biological indicators is called the “Estuarine quality paradox” concept, coined by Dauvin 2007 (Elliott & Quintino, 2007).
12
Nematode assemblages and abiotic parameters
The meiofauna, also expressed as meiobenthos is defined on a methodological basis as all the metazoans that are passing the coarse sieve (500 µm or 1000 µm) and are retained by the finer 38 µm sieve (Vincx et al., 1990) or 63 µm sieve (Austen & Warwick, 1989).
From all the meiofauna nematodes are the most diverse and abundant group (Coull, 1999; Fonseca et al. 2011). Nematode assemblages (such as species abundance, richness or composition) is highly affected by wide array of biotic (organic carbon contents, total particulate matter, availability of detritus and plants as well bioturbation) and abiotic factors (salinity, sediment properties, temperature, pH). From these variables salinity, sediment particle size and temperature are considered the most important factors (Coull, 1999; Moodley et al., 2000; Giere, 2008). In the estuarine ecosystem, the salinity gradient is a factor, which can highly affect the meiofauna composition and occurrence (Adao et al. 2009). Meiofauna is not only directly affected by the temperature and salinity. Another important factor is a sediment grain size since it influences the spatial, structural and vertical distribution of the assemblages. The mean particle size of <125 μm is considered optimum for burrowing, while larger mean grain sizes create more interstitial spaces being more difficult to burrow (Coull, 1999; Giere, 2008). Coull (1999) have reported the highest meiofauna density and diversity values in finer sediments. Nevertheless, other authors observed that coarser and muddy sediments also provide equally similar meiofauna density values (Fonseca et al., 2011). Nematodes assemblages can be also studied by looking at their trophic affiliations. Nematodes are classified by four feeding groups according to their mouth morphology and the presence of buccal armature such as teeth, onchia, denticles, mandibles or other sclerotized structures (Moens et al., 2013).
Nematodes are considered the ideal indicator group due to their diversity, high regeneration times and being the most abundant meiofaunal metazoans of aquatic habitats constituting even 60 up to 90% of the total meiofauna (Coull, 1999; Fonseca et al., 2011).
State of art
The Sado estuary is one of the largest estuaries of Portugal providing habitat for various marine species and birds. Nevertheless, this Estuary is also under influence of various anthropogenic activities. Understanding, how these anthropogenic pressures affect the ecological quality of the Estuary is of particular importance on the way to protect this ecosystem. Nematodes are considered the best candidates for ecological quality assessment
13 due to their ubiquity and sensitivity to abiotic stressors. However, in order to disentangle nematode response to anthropogenic pressures from their response to natural estuarine conditions, a background knowledge of how the complex mix of environmental conditions along the Estuary gradient affect nematode structural and functional distribution patterns is a prerequisite to develop biomonitoring tools. For this reason, current study represents important contribution to our understanding of nematodes distributional patterns with implications for their future use as indicators of environmental conditions. Additionally, this is the first study on the meiofauna communities conducted in Sado Estuary thereby contributing to better cognition of this important Estuary.
Research questions
The specific research questions that are addressed in the current dissertation are as follow: 1. How the structural attributes: abundance, number of genera and diversity metrics
(Shannon-Winner, Simpson, Simper) as well as functional traits (MI, TDI-1) vary along
different sections of the Sado Estuary?
2. How the nematode community distribution patterns vary along different sections in the Sado Estuary?
3. What are the major environmental drivers of nematode distribution patterns along the Estuary sections?
Hypothesis
1. There will be significant differences in abundance, number of genera and diversity metrics among Estuary sections.
2. There will be significant differences in meiofaunal communities among different Estuary sections.
3. Main parameters that influence communities along the Sado Estuary will be associated to major Estuarine gradients such as: salinity, temperature(°C), pH, dissolved oxygen mg/L, depth, TOM % and sediments.
14
Study area and sample stations
The Sado Estuary (38°27’ N, 08°43’ W) is the second largest in Portugal, with an area of
approximately 24,000 ha. Majority of the estuary area is classified as a natural reserve (Fig 2), but there are many polluting industries that use the estuary for waste disposal purposes without suitable treatment such as harbour-associated activities and the city of Setubal, along with the copper mines in the Sado watershed. Some other activities that perturbed this estuary are the intensive farming of rice, salt pans and intensive fish farms. Sampling was performed in Sado Estuary during May of 2018. The 35 not replicate samples were collected for meiofauna and environmental parameters along the entire estuary of the subtidal zone (Fig. 1) from upstream, where fresh water prevails, to the Estuary mouth, with higher salinity, influenced by the proximity of the sea.
Sampling and sample treatment Environmental variables
Bottom water parameters were measured at each sampling station, in situ with a multiparametric probe (YSI Data Sonde Survey 4). Parameters measured included: salinity (Practical Salinity Scale - PSU), temperature (◦C) and dissolved oxygen (DO) (mg L−1).
At each station Total organic matter (TOM) and grain size was determined by taking approximately 100g of sediment. Sediment samples were oven dried for 72 h in 60 ◦C and subsequently combusted at 450 ◦C for 8h. TOM was calculated as a difference between the total weights of dry sediment and inorganic portion of sediment obtained through combustion. TOM was expressed as total % of organic matter. Grain size was obtained by the separation of the collected sediment through the column of different mesh sizes sieves. Obtained grain sizes
Fig 1 Sampling points in Sado Estuary with blue area indicating limits of the Natural Reserve Area
15 corresponded to five classes: gravel (>200mm), coarse sand (0.5-2.0 mm), mean sand (0.25-0.5 mm), fine sand (0.063-0.25 mm) and silt&clay (<0.063 mm). All the sediment fractions were expressed by the % of the total sediment weight (Brown & McLachlan, 2010).
Criteria for delineation of Estuary Sections
Estuary sections were delineated based on: PCA analysis of environmental and spatial data as well as hydrodynamic map of an Estuary. Hydrodynamic map was used to identify stations with similar hydrodynamic conditions such as water flow velocity and residence time. A Principal Component Analysis (PCA) of environmental parameters were conducted on resemblance matrix based on Euclidean distances. Prior to analysis, environmental data was checked for uniform distribution, and was accordingly transformed and normalized (Please see Data Analysis Section). Based on PCA analysis plot (Fig. 2), spatial coordinate analysis and hydrodynamic map of an Estuary the following sections were delineated: Upstream Chanel (UPC) stations: S1, S2, S3, S4, S5, and S6, Upstream Chanel 2 (UPC2) stations: S7, S8 and S9, Upstream Chanel 3 (UPC3) stations: S10, S12, S13 and S16, Main Chanel (MC) stations: S11, S14, S15, S17, S19 and S29, Downstream (DW) stations: S20, S21, S21, S22, S23, S24 and S30, Intermediate (INT) stations: S18, S25, S26, S27, S28 and S35 and Bay (BAY) stations: S31, S32, S33 and S34. The stations within each section were used as replicates.
Meiofauna collection and identification
Samples for meiofauna identification were collected using a hand core (3.6 cm inner diameter) from a first 3 cm of the bottom sediments. The collected samples were immediately preserved in a 4% buffered formalin solution. Subsequently the sediment samples were rinsed on 1000 μm mesh sieve for separating detritus and unwanted litter and further were rinsed using 38 μm mesh sieve. The remaining that stayed on the filter was extracted from sediment utilizing a density gradient centrifugation in colloidal silica (specific gravity 1.18 g cm-3) (Heip et al., 1985).
The supernatant of each centrifugation round was washed on 38 μm mesh sieve and stored in 4% formalin solution and rose Bengal. Meiofauna samples were counted using counting dish and stereomicroscope Olympus DP70 (40x magnification) and from each sample a set of 120 randomly picked meiofauna individuals were collected. All the picked individuals were transferred into cavity box with 4 % formalin and 1% glycerol solution, to prevent the damage of individuals. Cavity boxes were put into a sealed container with 95% (v/v) ethanol and left for 12 hours at 35ºC. Afterwards few drops of ethanol (95% v/v) with glycerol (5% v/v) were added
16 to the cavity boxes three times in the interval of 2 hours. Finally, the samples were stored in anhydrous glycerol and mounted on slides for further identification (Vincx, 1996).
Meiofauna was identified until major groups and nematodes until genus level. All the identification was done under Olympus BX50 light microscope and using identification keys (Platt & Warwick, 1988) as well as NeMys (Vanaverbeke et al., 2014) and on-line databases.
Data analysis
Univariate analysis
Nematode data from each section was organized into a Excel dataset to calculate total nematode density (individuals 10 cm-2), genera composition, trophic composition, ecological
diversity indices (Shannon-Wiener diversity (H’) (Clarke & Warwick, 2001), Simpson index (λ) and the genera Rarefaction (EG) (Hurlbert, 1971) as well as Index of Trophic Diversity (ITD) (Heip et al., 1985) and Maturity Index (MI) (Bongers et al., 1991; Bongers, 1999) that are indicators of the ecological strategies.
Shannon-Wiener and Simpson indices compute the community diversity in a different way. The Shannon Wiener index assumes that individuals are sampled randomly in an indefinitely large community and that all species are represented by the algorithm (𝐻′= − ∑ 𝑃𝑖 × 𝑙𝑜𝑔𝑃𝑖). If the value of (H') is large there will be greater diversity within the community. Simpson measures the probability that two individuals randomly selected from a sample will belong to the same species. This analysis gives us results between 0 and 1 and its calculated by the algorithm (λ= ∑ 𝑃𝑖2) (Clarke & Green, 1988). Rarefaction (EG) provide the information on the expected number of genera and was calculated by the mean of rarefaction curves (Hurlbert, 1971). In order to understand the trophic composition of nematodes communities, each genus was assigned to a given feeding groups, based on mouth morphology (Wieser, 1953). In this classification there are four common feeding groups: selective (1A) and non-selective (2B) deposit feeders, epigrowth feeders (2A) and omnivores/predators (2B). Based on these four feeding habitats the Index of Trophic Diversity (ITD) was calculated (Heip et al., 1985), and its reciprocal (ITD-1), so that the higher value obtained by the index
correspond to the higher trophic diversity.
The Maturity Index (MI) provides information on a species life strategy where the values are represented on colonizer-persister scale (c-p scale) where 1 are the colonizers and 5 are persisters (Bongers et al., 1991; Bongers, 1999). Each value is assigned to each genus. Colonizers represent characteristics such as rapid growth rate and reproduction and relatively high tolerance to disturbance. Contrary, persisters have slow growth rate and are considered
17 sensitive to environmental change. MI is calculated per site and represents the weighted average of the individual colonizer-persister (c-p) scores multiplied by the frequency of that taxon within a given site. The multivariate PERMANOVA analysis was conducted on a Euclidean distance (Clarke & Green, 1988) for: number of species, abundance, Simpson and Shannon-Wiener index and for the factor Estuary Sections, where the null hypothesis was rejected at a significance level p < 0.05.
Multivariate analysis
Principal component analysis (PCA) was performed on the environmental variables (pH, Depth [m], Temperature [°C], Dissolved Oxygen [mg/L], Salinity, TOM [g], Gravel [%], Coarse sand [%], Fine sand [%] and Silt + Clay [%]). Prior to analysis, environmental data, that composed infinite values (pH, Depth [m], Temperature [°C], Dissolved Oxygen [mg/L], Salinity, TOM [g]) were log10 transformed, whereas the Gravel (%), Coarse sand (%), Fine sand (%) and Silt + Clay (%)
were transformed using arcsine square root transformation for data of proportions and percentages.
PERMANOVA (permutational multivariate analysis of variance) was used to test for significant differences in nematode community composition and structure, using a Bray-Curtis similarity matrix of abundance data, with Estuary Section as orthogonal fixed factor.
The similarity percentages routine (SIMPER) was used to examine the contribution of each nematode genus to average resemblances between sample groups (estuary sections). PERMANOVA and SIMPER multivariate analyses were done using the PRIMER 6 statistical package with the PERMANOVA+ add-on (PRIMER-e, Plymouth Marine Laboratory).
Redundancy Analysis (RDA) was performed based on Hellinger transformed relative species abundance matrix and environmental matrix with following variables: Depth [m], Temperature [°C], Dissolved Oxygen [mg/L], Salinity, TOM [g], Gravel (%). Similarly as for PCA analysis, environmental data, that composed infinite values (pH, Depth [m], Temperature [°C], Dissolved Oxygen [mg/L], Salinity, TOM [g]) were log10 transformed, whereas the Gravel (%), Coarse sand (%), Fine sand (%) and Silt + Clay (%) were transformed using arcsine square root transformation for data of proportions and percentages. Further, the variables that were correlated with each other of more than 0.7 were removed from the model to avoid over parameterization. These were: pH, Coarse sand (%), Fine sand (%) and Silt + Clay (%). Forward selection procedure was used to identify significant set of environmental variables that explain the variation in nematode communities. That way the variables that were not correlated with variation in community composition on their own were not included in the model. RDA
18 analysis was performed in R using “vegan” and “BiodiversityR” packages (Kindt & Coe, 2005; Oksanen et al., 2015).
Results
Environmental data
The results of the environmental parameters measured at each sampling station along the Sado Estuary are provided in Table 1. The salinity registered progressively higher mean values from Upstream (UPC) (5,05±1,91) to Downstream section (32,58±1,25) decreasing on Intermediate (30,22±0,22) and Bay (29,74±0,18).
The temperature (°C) values were similar in all the sections, reaching the highest mean value of 17,65ºC at UPC3 station and the lowest 16,55°C at DW section. All the sections generally presented a neutral pH (around 7) to slightly alkaline (8,09) (Table 1).
Although some variability was recorded between the sections, dissolved oxygen (O2 mg/L) was
similar between sampling sections. The lowest value was obtained at UPC2 section (4,32 mg/L), while the highest value was observed at DW section (7,59 mg/L). The highest value (8,52 mg/L) was registered in the MC section at station 11 and the lowest value (2,61 mg/L) was registered in the UPC2 station at the station 7. In some sections the sediment was
Table 1 Mean and standard error of environmental variables per estuary section
Environmental
parameters Sections
UPC UPC2 UPC3 MC DW INT BAY
Salinity 5,05±1,91 15,95±1,24 20,75±1,38 23,61±2,00 32,58±1,25 30,22±0,22 29,74±0,18 Temperature (°C) 17,33±0,11 17,62±0,02 17,65±0,16 17,43±0,15 16,55±0,37 17,59±0,09 16,71±0,09 pH 7,78±0,02 7,51±0,16 7,89 ±0,02 7,93±0,03 8,09±0,03 8,05±0,01 7,97±0,01 Dissolved Oxygen % 73,12±1,42 71,20±12,95 85,25±4,13 90,30±1,38 94,77±1,13 94,33±0,35 87,53±0,56 Dissolved Oxygen mg/L 6,77±0,11 4,32±1,39 7,07±0,50 7,55±0,20 7,59±0,09 7,51±0,02 7,11±0,05 Depth 2,23±0,28 6,28±1,42 1,46±0,68 1,74±0,57 5,87±0,94 1,90±0,52 0,83±0,14 TOM % 3,51±1,71 9,06±0,96 9,74±0,34 8,89±0,77 1,80±0,47 5,44±1,46 9,66±0,52 TOM (g) 0,17±0,08 0,40±0,03 0,38±0,07 0,37±0,04 0,05±0,01 0,15±0,04 0,32±0,06 Gravel(%) 8,73±3,50 0,29±0,21 0,09±0,02 20,92±6,90 11,37±3,60 7,88±3,78 13,48±12,45 Coarse sand(%) 38,41±12,32 3,77±2,54 0,16±0,04 4,40±1,59 34,36±6,11 7,81±2,33 1,56±1,14 Fine sand(%) 21,73±7,42 6,13±3,94 0,42±0,23 3,69±1,23 31,27±1,87 15,18±5,81 1,00±0,61 Silt and Clay(%) 31,13±16,76 89,81±6,69 99,32±0,28 70,99±7,80 23,00±5,87 69,13±7,78 83,96±14,18
19 characterized by a predominance of Silt and Clay fractions with high percentages of organic content (OM). In other sections like DW and UPC, the percentage of coarse sand is higher. The highest OM content values were obtained in sediments of station 10 (with 10,75%) located at the UPC3 section. The grain size composition of the sampling stations located at UPC was characterized by Coarse sand, Silt and Clay sediments, representing 69,54% of the sediments. The sampling stations located in UPC2, UPC3, MC, INT and Bay sections were characterized by Silt and Clay sediments, being 89,81%(UPC2), 99,32% (UPC3), 70,99% (MC), 69,13%(INT) and 83,96%(BAY). In the section "DW" the sediments had more uniform distribution (Table 1).
PCA of environmental data
Principal component analysis (PCA) of the environmental variables accounted for 63,15% (40,07% PCA1 and 22,08% PCA2) of the total data variability. It is possible to observe that the sections were distributed according to the environmental variables that have more influence on each section.
20 The UPC and UPC2 sections were more related with depth and temperature, MC section with TOM variables, INT and BAY section with gravel, dissolved oxygen and TOM and DW section with depth (Fig.3).
Biological data
Meiofauna assemblages
Total meiofauna density ranged between 15,81 in 10 cm-2 (“UPC2” section, station S9) to
7295,81 in 10 cm-2 (“BAY” section, station S31) and the number of groups present varied from
2 in the sections “UPC” (station S6), “UPC2” (station 7) and “INT” (station 18) to 11 at sections “MC” (station S11), “DW” (station S24) and “INT” (station S26). Table 2 represents the mean density and the standard error of meiofaunal taxa for each section. The nematode group were present in all sections with considerably higher values than the other meiofauna groups. The Cladocera, Cumacea and Nemertea groups were presented only in one section, being the least represented group in the sampling. The section with the highest diversity of meiofauna was the “MC” section with 14 out of the total 16 identified groups. On the other hand, the “UPC2” section had only 5 out of the 16 taxa being the section with the lowest meiofauna diversity.
Table 2 Mean density / SE (number of individuals per 10 cm2) of meiofaunal groups in each estuarine section Meiofaunal
taxa
Sections
UPC UPC2 UPC3 MC DW INT BAY
Nematoda 101,9±35,1 567,1±520,5 835,8±489,3 944,8±413,3 212,4±87,3 1222,8±166,1 3717,2±1274,9 Rotifera 0,3±0,2 - - 0,3±0,3 - - - Kinorhyncha - - 4,4±3,0 6,4±3,7 2,8±1,6 7,4±4,5 3,0±1,9 Polychaeta 9,8±2,0 9,0±6,2 27,7±13,9 18,8±4,0 19,2±5,2 79,7±22,1 55,8±12,5 Oligochaeta 0,6±0,5 - - 1,1±0,8 0,8±0,6 - 0,5±0,5 Cladocera - - - 0,2±0,2 - - - Ostracoda 1,1±0,9 1,6±1,6 1,4±0,8 3,7±2,8 0,9±0,6 3,4±2,4 1,4±1,4 Copepoda 4,2±2,7 1,2±0,8 18,1±16,3 34,6±15,7 27,0±8,8 31,5±17,3 34,0±13,9 Isopoda - - 0,2±0,2 0,2±0,2 - - - Halacaroidea 0,3±0,3 1,9±1,9 0,2±0,2 0,9±0,3 0,8±0,4 0,3±0,3 0,7±0,5 Bavalvia - - - 0,3±0,3 0,3±0,3 0,2±0,2 1,2±0,9 Nauplii larvae - - 0,2±0,2 0,5±0,3 0,9±0,4 3,7±2,9 0,9±0,9 Amphipoda - - - 1,6±0,9 1,6±0,9 1,2±0,8 - Cumacea - - - 0,9±0,5 - Turbellaria - - 1,2±1,2 0,3±0,2 0,6±0,5 0,2±0,2 0,2±0,2 Nemertea - - - 0,2±0,2
21
Nematode assemblages –structural diversity
Overall, 96 nematode genera from 24 families and 6 orders were identified along the estuary. Most genera belonged to the orders Chromadorida (63.3%) and Monhysterida (34.4%). The orders Enoplida, Rhabditida, Plectida and Triplonchida were least abundant (4.7%). The most abundant families were Comesomatidae (42.6%), Linhomoeidae (21.2%), Chromadoridae (9.04%), Desmodoridae (7.9%) and Axonolamidae (6.71%) representing 87,4% of the total of families. The remaining families represent only 12.6% representing by Xyalidae, Cyatholamidae, Anoplostomidae, Sphaerolamidae, Oxystominidae, Rhabdodemaniidae, Etholaimidae, Oncholaimidae, Leptolamidae, Aegialoalaimidae, Trefusiidae, Diplopeltidae, Paramicrolamidae, Microlamidae, Salanchinematidae, Cephalobidae, Epsilonematidae, Rhabditida, Ironidae, Tobrilidae, Anticomidae, Monoposthiidae, Thoracostomopsidae, Plectidae, Phanodermatidae, Siphonolaimidae, Monhysteridae, Enchelidiidae and Desmoscolecidae. Throughout the sampling stations, 6 genera accounted for 76.0% of total nematode density: Sabatieria, Terschellingia, Paracomesoma, Metachromadora, Parodontophora and Ptycholaimellus (Appendix Table 7).
In general, nematode density varied from 9,3 to 7271,6 ind. per 10 cm2. The treatment stations
presented the mean density of 994,4 ± 241,3 ind. 10 cm2, with minimum values in stations S30
locate in “DW” section (0,1 ± 0,08 ind. 10 cm2) and maximum values in station S31 locate in
“BAY” section (75,8 ± 48,6 ind. 10 cm2). The section with the highest density of nematodes was
the BAY section with a total mean density of 4537,36 ± 1195,36 ind. per cm2. The sections with
lowest density per cm2 were UPC and DW sections with a mean density of 101,86 ± 35,13 ind.
22
Fig 3 Mean density ± standard error (SE) of nematodes (total number of individuals per 10 cm-2) per section
At Fig. 4 it is possible to observe that the MC, DW and INT sections were the sections with the highest nematode genus diversity presenting the following numbers: MC (43 genera), DW (66 genera) and INT (54 genera). The section with the lowest nematode genus diversity was UPC2 with only 13 genera. That information is also corroborated by the rarefaction curve (Fig. 5).
Fig 4 Total number of genera at each section
0 1000 2000 3000 4000 5000 6000
UPC UPC2 UPC3 MC DW INT BAY Sections In d iv id u als 10 cm -2 0 10 20 30 40 50 60 70
UPC UPC2 UPC3 MC DW INT BAY
N u m b er o f genera Sections
23 The six most abundant genera were: Sabatieria (31,59%), Terschellingia (18,65%),
Paracomesoma (10,67%) Metachromadora (6,18%), Parodontophora (4,79%) and Ptycholaimellus (3,97%) accounting for 76,0% of total nematode density (Appendix Table 7).
The highest density of genus Sabatieria was located at UPC3 section representing 63,96% of the total of nematodes followed by BAY section, where Sabatieria represented 43,99%. The section with the lowest representation of Sabatieria was UPC2 section with only 2,40%. This section was dominated by Terschelligia genus with 91,14% being the section with the highest representation of this genera. In turn, DW section had the lowest percentage of Terschellingia genus (5,25%) (Fig. 6).
The Paracomesoma genus has the highest percentage in INT section with 24,53% and the lowest in UPC and UPC2 sections where this genus was not found. Metachromadora genera is represented in all sections, being the MC section the higher percentage with 10,42%.
The genus Parodontophora has a greater representativeness in the section DW where it represents 6.79% of the total average density. Parodontophora genus has no individuals in UPC and UPC2 sections. Lastly, the Ptycolaimellus genus has its greatest value in MC section with 19,33% of representative and has no individuals in UPC2 and BAY sections (Fig. 6).
24
Fig 6 Relative density (%) of the most abundant nematode genera at each estuarine section (“UPC”, “UPC2”, “UPC3”, ”MC”, ”DW”, ”INT” and “BAY”).
According to one factor PERMANOVA test Number of species (S) showed a significant difference (p-values=0,002<0,05) among sections (Table 3), with the highest number of genera at DW section (Fig. 4).
Table 3 One factor PERMANOVA test with “Number of species” (S), “Total number of individuals” (N), "Shannon-Wiener "and “Simpson” indices.
Source of variation
Degrees of freedom
Sum of squares Mean Squares Pseudo-F P value perms Number of species (S) Gradient sections 6 1152,3 192,05 5,1279 0,002 948 Residual 28 1048,7 37,452 28 Total 34 2201 Total number of individuals (N) Gradient sections 6 76270 12712 10,911 0,0001 9961 Residual 28 32620 1165 Total 34 1,0889×10⁵ Shannon-Wiener (H’) Gradient sections 6 6,1029 1,0171 4,193 0,005 999 Residual 28 6,7923 0,24258 Total 34 12,895 Simpson (λ) Gradient sections 6 8,65×10⁻² 1,4417×10⁻² 2,7325 0,04 997 Residual 28 0,14773 5,2759×10⁻² Total 34 0,23423 0 10 20 30 40 50 60 70 80 90 100
UPC UPC2 UPC3 MC DW INT BAY Ptycholaimellus Parodontophora Metacrhromadora Paracomesoma
25 Total number of individuals (N) also demonstrated significant difference between the sections (Table 3), with BAY section having the highest number of individuals (Fig. 3).
The PERMANOVA analysis for the Shannon-Wiener index (H’) and Simpson (λ) indices showed significant differences among sections (Table 3).
Fig 7 Shannon-Wiener Index at each section
Both Shannon-Wiener and Simpson diversity indexes indicated that DW section had the highest diversity value, H’= 3,02 (Fig. 7) and λ= 0,96 (Fig. 8).
Fig 8 Simpson Index at each section
0 0,5 1 1,5 2 2,5 3 3,5
UPC UPC2 UPC3 MC DW INT BAY
Sh an n o n -Win er in d ex 0 0,1 0,2 0,3 0,4 0,5 0,6 0,7 0,8 0,9 1
UPC UPC2 UPC3 MC DW INT BAY
Sim
p
so
26
Nematode assemblages-functional traits
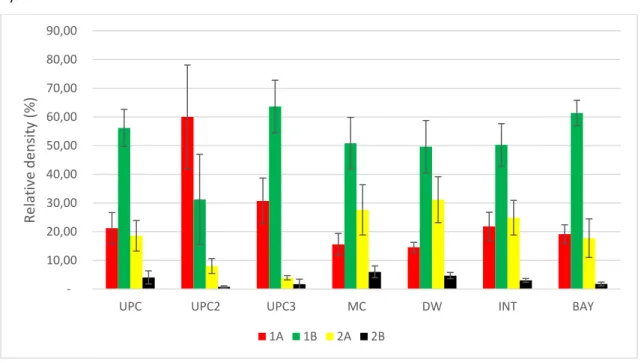
The trophic composition of the nematode assemblages in 6 out of the 7 sampling sections were characterized by high abundances (>40%) of the non-selective deposit feeders (1B) (“UPC” 56,2±6,5%; “UPC3” 63,6±9,2%; “MC” 50,82±9,0%, “DW” 49,62±9,1%, “INT” 50,3±7,4% and “BAY” 61,4±4,4%). The abundance of trophic groups 1A (selective deposit feeders) and epigrowth feeders (2A) were highly variable depending on the section (Fig. 9). At the sections “UPC” and “UPC3” the trophic group 1A was higher than the trophic group (2A). In the “MC”, “DW”, “INT” and “BAY” sections the trophic group (2A) was higher than the (1A). The “UPC2” section had the higher abundance of the deposit feeders (1A) 60,0±18,1%, followed by the non-selective deposit feeders (1B) and epigrowth feeders (2A). The least abundant trophic group in all the sampling sections were the predators (2B) (“UPC” 4,1±2,3%; “UPC2 0,7±0,4%” “UPC3” 1,7±1,7%; “MC” 6,0±2,1%, “DW” 4,7±1,1,%, “INT”3,0 ±0,7% and “BAY” 1,8±0,7%) (Fig. 9).
Fig 9 Relative density (%) of the trophic groups according to Wieser (1953)
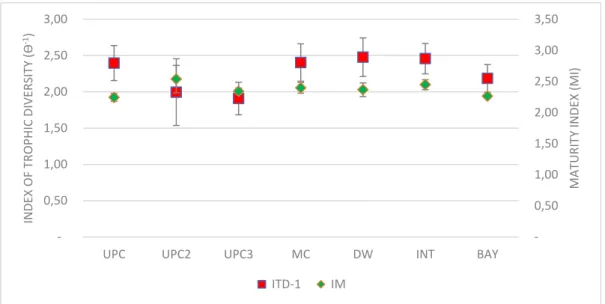
The index of trophic diversity ITD-1(Ɵ-1) varied between the value 1,08 in “UPC2” section of the
estuary at station S7 and the value 3,27 at station S35 in “INT” section (Fig.10). The highest value of the Index of Trophic Diversity (Ɵ-1) mean was in the “DW” section (2,48 ± 0,27) and
the lowest value at the “UPC3” section (1,91 ± 0,22) (Fig.10).
10,00 20,00 30,00 40,00 50,00 60,00 70,00 80,00 90,00
UPC UPC2 UPC3 MC DW INT BAY
Re la tive dens it y ( %) 1A 1B 2A 2B
27
Fig 10 Mean values ± standard error (SE) of the Index of Trophic Diversity (ITD-1) and Maturity Index (MI) in each section
The Maturity Index (MI) varied between the value 2,02 in “DW” section at the station S21 and the value 2,95 at station S7 in “UPC2” section. The highest mean value of the Maturity Index (MI) was found at “UPC2” section (2,54 ± 0,22) and the lowest mean value in “UPC” section (2,24 ± 0,07). Nevertheless, one way factor PERMANOVA analysis demonstrated no significant differences for both indices among Estuary Sections.
Multivariate PERMANOVA test
PERMANOVA analysis for the Nematode community composition showed significant differences p-value = 0,0001 among Estuary Sections (Table 4).
Table 4 Multivariate PERMANOVA analysis of nematode composition among estuary sections
Source of variation Degrees of freedom Sum of squares Mean Squares
Pseudo-F P.(pems) perms
Nematode community composition Gradient sections 6 37404 6233,9 3,1528 0,0001 9839 Residual 28 55363 1977,3 Total 34 92767
Table 5 demonstrates which sections significantly differ from each other in terms of their nematode assemblage compositions. The UPC section has the most distinct nematode assemblages, having significant differences among all the other sections except for UPC2. The BAY section also has a distinct nematode assemblage composition, presenting differences with 4 (UPC, MC, DW and INT) out of the 7 study sections. The UPC2 section only has significant
0,50 1,00 1,50 2,00 2,50 3,00 3,50
UPC UPC2 UPC3 MC DW INT BAY
0,50 1,00 1,50 2,00 2,50 3,00 MA TURI TY IN DE X ( MI) IN DE X O F T R O PH IC DIV ER SIT Y (Ɵ -1) ITD-1 IM
28 differences when compared to the MC section being the section with the least significant differences when compared to other sections.
Table 5 Pairwise test, Average Similarity between/within groups. Bold values represent significant p-value<0,05. UPC UPC2 UPC3 MC DW INT BAY UPC 32,134 UPC2 24,697 23,704 UPC3 22,156 29,373 45,128 MC 22,233 18,616 39,03 46,37 DW 19,687 17,473 23,499 28,304 25,154 INT 15,355 16,856 31,472 43,908 26,674 49,154 BAY 16,104 18,503 35,555 36,778 18,731 41,42 52,468
The UPC3 section presented significant differences with the most downstream located sections: DW and INT sections. Similarly, the DW section located at the Estuary mouth exhibited significant differences with the most upstream UPC section, BAY section, but also intermediate section. The INT section had significant differences when compared to UPC3, DW and BAY sections.
Simper analysis
SIMPER analysis demonstrates that Sabatieria and Terschellingia are the two genera that contribute the most to differences, but also similarities among Estuary Sections. One good example of dissimilarity between sections is the case of the comparison between “UCP” and “UPC3” section. Sabatieria genus contributes with the 20,56% to the dissimilarity between the sections, where “UPC” section has only 4,25 ind/10cm2 while “UPC3” has 18,47 ind/10cm2.
Paradontophora and Paracomesoma genera are also contributing to the differences among
these two sections, being present at the “UPC3” section but absent at the “UPC” section. Genera that contributed to the differences among Estuary sections range from 4 to 14 genera, representing not only the most abundant genera such as Sabatieria, Terschellingia or
Paracomesoma but also the genera that have representation only in one section such as Tricoma that is only present in DW section, or Monhystrella that is only present in UPC section.
29
Table 6 The Simper analysis with the percentage contribution of set of genera to similarity and dissimilarity among sections. In grey are represented the genera that contribute to the similarity between sections and in white, the genera that contribute to dissimilarities.
UPC UPC2 UPC3 MC DW INT BAY
UPC 59,51% Anoplostoma Sabatieria Terschellingia UPC2 68,82% Terschellingia Sabatieria UPC3 55,69% Sabatieria Terschellingia Parodontophora Paracomesoma Anoplostoma 64,32% Sabatieria Terschellingia MC 51,74% Paracomesoma Sabatieria Parodontophora Ptycholaimellus Terschellingia Metalinhomoeus Daptonema Dichromodora Metacrhromadora 53,26% Terschellingia Paracomesoma Sabatieria Parodontophora Daptonema Ptycholaimellus Metalinhomoeus Dichromodora 56,21% Sabatieria Terschellingia Parodontophora Paracomesoma Daptonema DW 50,58% Sabatieria Anoplostoma Terschellingia Daptonema Dichromodora Metacrhromadora Tricoma Marylynnia Sphaerolaimus Halalaimus Paracomesoma Axonolaimus Leptolaimus Molgolaimus Monhystrella 51,17% Sabatieria Terschellingia Parodontophora Paracomesoma Daptonema Ptycholaimellus Dichromodora Leptolaimus 51,43% Sabatieria Daptonema Dichromodora Tricoma INT 52,26% Paracomesoma Terschellingia Sabatieria Odontophora Parodontophora Molgolaimus Metalinhomoeus Daptonema Thalassoalaimus 51,20% Paracomesoma Sabatieria Terschellingia Odontophora Molgolaimus Metalinhomoeus Parodontophora Daptonema Ptycholaimellus 52,10% Paracomesoma Terschellingia Sabatieria Parodontophora Metalinhomoeus Molgolaimus Odontophora Daptonema Dichromodora Thalassoalaimus Sphaerolaimus 52,24% Paracomesoma Sabatieria Terschellingia Odontophora Daptonema BAY 54,78% Sabatieria Terschellingia Paracomesoma Metacrhromadora 50,98% Sabatieria Terschellingia Metacrhromadora Paracomesoma Parodontophora Spilophorella 53,16% Sabatieria Terschellingia Paracomesoma Metacrhromadora Parodontophora 52,68% Sabatieria Metacrhromadora Terschellingia Paracomesoma Parodontophora Molgolaimus Spilophorella Odontophora 59,03% Sabatieria Terschellingia Paracomesoma
30
Nematode Assemblages and Estuarine gradient
The first two axis of the RDA analysis based on Hellinger transformed relative nematode abundance matrix accounted for 22,24% (12,99% RDA1 and 9,24 % RDA2, adjusted R square=0,22) of the data variability (overall significance of the model: F=2,89,p=0,001) (Fig. 11). It is possible to observe that the nematode communities were distributed according to the environmental variables. Higher gravel % and oxygen [mg] were associated to MC, INT, DW sections differentiating from the upstream sections (UPC2, UPC3 and BAY) characterized by the highest TOM concentration and temperature. UPC was clearly distinguished from the rest of the stations. BAY section had communities more closely related to those from UPC3 section. It was possible to highlight the behavior of three of the nematode genera, Sabatieria and
Terschellingia that are positevely correlated with Temperature (temp) and TOM, and Paracomesoma with salinity (sal), gravel % and dissolved oxygen.
Fig 11 Redundancy analysis (RDA) plot of the Hellinger transformed relative abundance data matrix and environmental variables.
31
Discussion
Previous studies of meiofauna in other Estuaries in Portugal such as Mondego and Mira estuaries demonstrated that the nematode density and community composition followed clearly the salinity gradient (Adão et al., 2009) with distinct meiofauna communities occupying different Estuary sections. Other studies refer that the abundance and richness of nematodes are also indirectly related with the grain size and organic enrichment in sediments. Organic sediment enrichment is related with accumulation of fine sediments, low hydrodynamic regime and low dissolved oxygen. In turn, these specific conditions increase the bacterial communities and increase the abundance of deposit feeders, such as some opportunistic genera of nematodes that tolerate long periods of anoxia conditions. (Soetaert et al., 1995; Steyaert et al., 1999; Armenteros et al., 2010). Therefore, nematode communities can be influenced by broader scale gradient of salinity, temperature and hydrodynamics and smaller scale variations in sediment grain size responsible for available oxygen, food and interstitial space for movement. Although majority of studies demonstrate that nematode communities follow the estuarine gradients, other Estuaries, for example Tagus Estuary did not exhibit markedly salinity gradient in nematode distribution patterns (Machado, 2015).
Structural patterns of nematode distribution
Nematodes are usually the most predominant taxa in estuaries with values normally ranging from 60 to 90% of all meiofauna groups (Coull, 1999). In this study the section with the highest meiofauna density was BAY (3815,12 ind per 10 cm2) and respectively this section has also the
highest nematode percentage (94%) The second taxon most abundant was the Polychaeta (3%) followed by Copepoda (2%). The nematode density percentage followed the same pattern as density of meiofauna, meaning that higher meiofauna densities corresponded to also high percentage of nematodes. The exception was MC section, where other meiofauna groups were also well represented.
The highest nematode density was observed at BAY section, followed by INT and UPC3 sections. High abundance of meiofauna and nematodes in this section could be related to the fact that BAY has the highest percentage of silt and clay sediments and the higher organic matter content (TOM). According Ferrero (2008) to the estuarine sediment is particularly important to meiofauna communities. In general, the high abundances of these communities are found in sediments with a mean size of <125 µm. Another explanation for higher
32 abundance of meiofauna in fine sediments could be related to higher food availability associated to TOM (Gerlach, 1978; Steyaert et. al. 1999). Also high abundance of one or two opportunistic genera such as Sabatieria and Terschellingia, may be an explanation for general higher nematode abundance at these sections (Armenteros et al., 2010; Pearson & Rosenberg, 1978). The sections with the lowest percentage of meiofauna and consequently nematodes taxa are UPC and DW sections. These sections are located at both ends of the estuary where the percentage of coarse sand predominates in comparison to other types of sediments. UPC section is located at the upstream end of the Estuary, presenting river characteristics such as high percentage of coarse sand and low salinity concentrations (McLusky, 1993). DW section is in turn located at the downstream end of the estuary, where the cumulative effect of marine tides with the estuarine current is responsible for washing out the fine sediments, increasing the predominance of coarse sediments relatively to silt and clay sediments. Also, at these sections the percentage of TOM is lower in comparison to other sections. These results follow the trend of other studies of meiofauna density patterns, specifically the nematode’s abundances having tendency to increase in finer sediments (Heip et al., 1985; Adão et al., 2009; Alves et al., 2009; Armenteros et al., 2010).
Several studies reported that the nematode abundance and richness are related to changes in the TOM concentrations (Essink & Romeyn, 1994; Kandratavicius et. al., 2018). In general, the abundance of some nematode genera increases with TOM, while the nematode richness decreases. It happens because high TOM concentrations are associated with higher decomposition of organic material, decreasing the available oxygen in the bottom waters (Bricker et. al., 1999). Consequently, lower oxygen concentrations decrease the abundance of sensitive genera, providing space for more opportunistic taxa such as Sabatieria and
Terschellingia, which withstand more anoxic conditions. Therefore, at more oxygenated sites
with less TOM concentrations, there are found more genera, that compete with opportunistic species and contribute to higher species diversity (Pearson & Rosenberg, 1978; Essink & Romeyn, 1994; Kandratavicius et al., 2018). In this study the results are in accordance with these previous works. The section with the highest diversity is the DW section with 66 genera, that is located at the mouth of Sado estuary and it presents a lower concentration of TOM and the highest oxygen concentration. This section had also the highest Shannon-Wiener and Simpson index. The estuarine section with the lowest diversity is UPC2 section with 13 genera followed by BAY and UPC3 sections with 28 and 27 genera respectively, with the latter two sections having the highest concentrations of TOM and lowest oxygen concentrations. Another potential reasons that could explain these diversity patterns are related to: tidal submergence
33 time, availability of food and presence of predators (Pearson & Rosenberg, 1978; Essink & Romeyn, 1994; Essink & Keidel, 1998; Armenteros et al., 2010).
According to PERMANOVA analysis, there were observed significant differences in nematode communities between sections, further specified in pairwise test. The most distinct section, in terms of nematode communities was the UPC section. This section presents significant differences for all the other sections except for the UPC2 section. A reason for this could be related to very upstream location of this section presenting strong river characteristics such as low concentration of silt and clay sediments and low salinity, which all contributed to distinct nematode communities. With this analysis there can be observed differences between the sections with different environmental conditions. As we have previously reported, the DW section, with the highest diversity and lesser abundance demonstrated differences in nematode community when compared with the other sections. The larger differences are found on opportunistic genera densities, for example when compared DW section with UPC2, UPC3 and BAY sections. Nematodes genera that overall contribute the most to the differences are Sabatieria and Terschellingia. For example Terschellingia corresponds to 18,70% of the dissimilarity between DW and UPC2 section, having the average abundance of 15,44 ind/10cm2 in UPC2 and 2,45 ind/cm2 in DW. Whereas, both Sabatieria and Terschellingia are
responsible for 26,70% of dissimilarity between DW and UPC3 with averages abundances of 18,47 ind/10cm2 in UPC and 10,89 ind/10cm2 in DW for Sabatieria and 5,87 ind/10cm2 and
2,45 ind/10cm2 for Terschellingia). Lastly, compared DW section with BAY section, there are
four genera that contribute to 47,96% of dissimilarity between these sections: Sabatieria,
Terschellingia, Paracomesoma and Metachromadora. These genera present an average that
are more than the double in BAY than in DW section. With these results, it can be concluded that the genera such as Terschellingia and Sabatieria, but also to some extent Paracomesoma and Metachromadora are good indicators of sections with different nematode abundances.
According to SIMPER analysis, there were several genera (between 4 and 14 genera) that contributed to dissimilarities among sections, that differed in Pairwise test. Not only the most abundant such as Sabatieria, Terschellingia or Paracomesoma but also the genera that have representation only in one section like Tricoma that is only present in DW section, or
Monhystrella that is only present in UPC section. This indicates the presence of certain genera,
that could be potential good indicators of a given section. Additionally, it demonstrates that Estuary is heterogeneous, in terms of nematode assemblages, with future potential to use nematodes assemblages to detect changes in environmental conditions and water quality in this Estuary.
34
Functional response
In terms of trophic levels, the most represented trophic level in this study was the non-selective deposit feeders (1B) in all sections except for UPC2 section where the highest percentage corresponded to selective deposit feeders (1A). According to previous described studies (Sabeel & Vanreusel, 2015) these results were expected. Opportunistic strategy dominates disturbed and polluted environments with the highest abundance of generalist
Terschellingia (1A) and Sabatieria (1B). Most of the estuary is classified as a natural reserve,
but there are many polluting industries that use the estuary for waste disposal purposes without suitable treatment such as harbour-associated activities and the city of Setubal, along with the copper mines on the Sado watershed. Some other activities that perturbed this estuary are the intensive farming of rice, salt pans and intensive fish farms. All these factors make the Sado estuary a good example of a site where human pressures and ecological values collide with each other being imperative to understand how human pressure influence meiofauna communities especially the nematodes assemblages (Caeiro et. al., 2005). Previous studies demonstrated that the trophic analysis based on the characterization of the trophic groups and by the application of the Index of Trophic Diversity can provide critical information on the functioning of the ecosystems (Alves et al., 2015). This index, is generally used to relate trophic diversity with pollution levels (Alves et al., 2015). The higher values of index of trophic diversity (ITD) represent high trophic diversity (Fonseca et al., 2011; Materatski et al., 2015). In some previous studies it is suggested that the maturity index (MI) decrease with the increase of the pollution (Bongers & Haar, 1990; Bongers et al., 1991). In the present study, the index of trophic diversity (ITD) and the maturity index (MI) don’t show any significant differences among sections. In fact, at all sections the values are similar for both indexes. This finding suggests that both indexes are not very useful indicators for environmental changes in this Estuary.
Factors that influence nematode assemblages
According to RDA analysis, the environmental factors that most differentiate the nematodes communities among sections were gravel, dissolved oxygen concentration, the salinity, water temperature and the TOM. Like other studies, the nematodes communities tend to follow the salinity gradient (Adão et al., 2009). On the other hand, TOM is also an important factor for community distribution, as it was demonstrated in previous sub-chapter.
Therefore, the results suggest that Sado estuary is very heterogeneous in terms of nematode assemblages distinguished by clear differences among sections in the RDA analysis. Firstly, it
35 was observed that the communities at UPC section were particularly different than other sections, associated to typical river characteristics existing at this section. Further UPC2 and UPC3 are presenting an increase of salinity and TOM concentration, with communities representing a mixture of genera from upstream and downstream part. The third part of this estuary is also well distinguished. It is represented by the MC, INT and DW sections, representing the main channel and the mouth of the estuary characterized by the higher salinity due to low residence time and proximity of the sea. Lastly, the BAY section presents particular characteristics due to its lesser exposure to water hydrodynamics. This section has the highest residence time of the water that also contributes to higher TOM concentrations and consequently distinct nematode communities. Nevertheless, in RDA analysis, this section is more similar to upstream (UPC, UPC2 and UPC3) sections, than to the middle and downstream sections.
One of the environmental factors that most influence the nematode distribution is fine sediment (Coull, 1999; Steyaert et al., 2003). Nevertheless, in our study the sediment that most contributed to the communities distribution according to RDA analysis is gravel. It may happen because the gravel sediments have more dissolved oxygen due to interstitial spaces between the particles (Steyaert et. al., 2003; Day et. al., 2012). Consequently, dissolved oxygen is also an environment variable present in RDA analysis that influence the nematode communities distribution. Besides little variability in dissolved oxygen and temperature among sections, these variables also significantly contributed to community discrimination among sections. RDA analysis demonstrated that some genera were clearly associated with certain environmental variables. For example, the genera Sabatieria, Terschellingia and
Metachomadora were highly associated with TOM and temperature. Consequently, the
sections that presented higher TOM concentrations where UPC2, UPC3 and BAY sections, with higher abundances of Sabatieria and Terschellingia. It is well documented, that these two genera are typically related with tidal mudflats and anoxic sediments ( Soetaert et al., 1995; Adão et al., 2009). The Paracomesoma genus is more related with the salinity concentration, this fact is proved in other studies (Adão et al., 2009) were the Paracomesoma genus were more abundant at polyhaline and euhaline waters. Remaining genera that are represented on RDA analysis did not show patterns with any particular environmental variable.
Implications for WFD and MSFD
In Europe, the European Water Framework Directive (WFD) and the Marine Strategy Framework Directive (MSFD) recommend the use of biological indicators (Bioindicators) in
36 monitoring environmental conditions in relation to other measurement methods (use of physicochemical or abiotic variables) (Voulvoulis et al., 2017).The Water Framework Directive (WFD, Directive 2000/60/EC) highlights the importance of biological descriptors in evaluating and monitoring environmental conditions. In ecology the term “bioindicator” is used as an aggregate term in relation to all sources of biotic and abiotic reactions to ecological changes (Silveira, 2004). The use of bioindicators present many advantages as the fact that they allow the determination of biological impacts, they are also an economically viable alternative when compared to other specialized measuring systems, and they are more effective for predicting the degree of contamination of an ecosystem (Kotwicki & Szczucinki, 2006). Thus, living organisms were considered as bioindicators since they integrate the biotic and abiotic components of an ecosystem through their adaptive responses, being the most appropriate to be used in the evaluation of the quality of water bodies (Casazza et al., 2002).
Estuarine meiofauna communities are used as a good indicator of ecological quality. They have many characteristics that make them better indicators that macrofauna. Meiofauna have small size, high abundance, rapid generation times and absence of planktonic phase (Alves et al., 2013). The nematodes species in functional groups share morphological traits that are known to be related to important ecological functions and therefore allowing easy identification and distinction on both morphological and functional basis, making then an ideal bioindicators (Chalcraft & Resetarits, 2003; Semprucci & Balsamo, 2012). Researchers also advocate that free-living nematodes are essential for the functioning of estuarine and marine ecosystems and that their high abundance and diversity has great variability among different habitats (Schratzberger et al., 2000; Austen, 2004; Danovaro et al., 2009; Moreno et al., 2011; Vanaverbeke et al., 2011). Despite the recent studies proved that nematodes are a good water bioindicators they are not included in the compartment of the WFD that defines the bioindicators to use in assessing and monitoring the state of quality of water bodies. For this reason, recent studies have been constantly proposing their use within the Water Framework Directive (WFD, Directive 2000/60/EC) as an indicator for assessing the ecological quality of marine ecosystems (Moreno et al., 2011). Despite some existing studies on the use of meiofauna as ecological indicators, there are still some inconsistencies in terms meiofauna distribution patterns that do not allow the development of respective indices and implement these indices into a standardized protocols. This study suggests that assemblages of free-living nematodes could be potential indicators of environmental conditions and water quality (such as higher percentage of TOM), but its response to specific type of pollution still needs to be assessed. For example, BAY section, is the most impacted section in the Estuary, and was also the most distinct section in terms of nematode communities. Nevertheless, we did not observe
