UNIVERSIDADE DE ÉVORA
DEPARTAMENTO DE ECONOMIA
DOCUMENTO DE TRABALHO Nº
2005/01
January
How is Confidence Related to Unemployment in Europe?
A fuzzy logic answer *
António Caleiro
Universidade de Évora, Departamento de Economia
*First version: June 24, 2004 This version: January 17, 2005
UNIVERSIDADE DE ÉVORA DEPARTAMENTO DE ECONOMIA
Largo dos Colegiais, 2 – 7000-803 Évora – Portugal Tel.: +351 266 740 894 Fax: +351 266 742 494 www.decon.uevora.pt wp.economia@uevora.pt
Abstract:
Notwithstanding the numerous applications of fuzzy logic in several fields of economics, it is surprising that, to the best of our knowledge, so very few applications have been made in modelling approximations of subjective economic variables, such as confidence, satisfaction or even expectations, by objective ones, such as unemployment, output or inflation. This gap in the literature is accompanied by a lack on the availability of data concerning those subjective variables. Given that one of the main concerns of fuzzy logic is to capture approximate rather than exact forms of reasoning, and this also characterises many economic situations, such as in fact forming intrinsically subjective measures of confidence, this logic can and should indeed be used to understand how some of those subjective measures can be approximated by objective ones. This task is accomplished in the paper by the use of data on consumer confidence and on the unemployment rate for the pre-enlargement fifteen European Union member states. The results indicate the clear importance of unemployment on confidence, which is a result that should be taken into account when analysing policy-making that, from a naïve and/or easy viewpoint, considers confidence as a relevant variable but ignores unemployment.
Palavras-chave/Keywords: Confidence, European Union, Fuzzy Logic, Unemployment Classificação JEL/JEL Classification: C10, C82, E32
1. INTRODUCTION AND MOTIVATION
As is well-known, since the seminal paper of Zadeh (1965), fuzzy logic has undergone a tremendous growth, both in theoretical and applied fields. Far from being a surprise, despite the delay, a considerable number of applications of fuzzy logic in diverse fields of economics have been made; see, for instance, Bagnoli and Smith (1998) on real estate valuation or Draeseke and Giles (1999) on underground economy or Landajo (2000) on forecasting. The diversity of the nature of these applications is indeed a characteristic that indicates the richness of fuzzy logic. As fuzzy logic allows ‘intermediate’ values to be defined between conventional or crisp evaluations like yes/no, or true/false, the vagueness or subjectivity of concepts which it is believed characterise human thought is, thus, (more) easily taken into account. Hence, some other applications of fuzzy logic which take into account this characteristic of human reasoning have also been made. See, for instance, West and Linster (2003) on game theory.
Notwithstanding the above mentioned applications, given that one of the main concerns of fuzzy logic is to capture approximate rather than exact forms of reasoning, and this also characterises many economic situations, such as forming intrinsically subjective measures of confidence, well-being, satisfaction, etc., it is surprising that, to the best of our knowledge, so very few applications of fuzzy logic have been made in modelling approximations of (those) subjective economic variables by objective ones, such as inflation, unemployment or output.1
Due to incomplete information, economic agents may be characterised by a certain level of confidence given a vague perception of the economic situation which, indeed, is generally measured by a reasonable amount of objective measures. As clearly pointed out in Santero and Westerlund (1996), confidence is a concept which cannot be defined precisely. This means that, when looking at the economic situation, even if all the information provided by those objective measures could be fully exploited, agents may still base their judgements on subjective criteria such as ‘high’ or ‘large’, ‘normal’ or ‘mean’ and ‘low’ or ‘small’ values for those objective variables. If this is the case, a fuzzy logic approach rather than a crisp one is (much) more appropriate. In fact, if one assumes that agents do not possess the ability to acquire, retain and process all the information needed to make crisp decisions as, for example, to sharply classify observed unemployment rates as high, normal or low, and base their level of confidence on that, then fuzzy logic is a natural way of dealing with this kind of situation in which the source of imprecision is the absence of crisp or rigid defined criteria of class memberships due to states of incomplete or imperfect knowledge.
1
In terms of the availability of data concerning economic aggregates, a simple comparison between objective measures and subjective ones immediately shows an overwhelming amount of data for objective aggregates, such as output, inflation or unemployment, and a disappointing lack of data for subjective aggregates, such as satisfaction, well-being, expectations or confidence.2
Eventually more essential than the lack of data on subjective variables is indeed the importance that these variables exert on other (objective) macroeconomic aggregates. In these matters, the influence of confidence on the business cycle is a well-known established fact; see, for instance, Matsusaka and Sbordone (1995) or Santero and Westrlund (1996). The European Commission (EC) itself clearly recognises the importance of the economic climate on the understanding of the, say, European business cycle. See European Commission (2000). Linked with this recognition is the fact that business surveys, conducted by the Directorate General for Economic and Financial Affairs of the EC, in order to obtain information about the economic sentiment or the consumer confidence, have become, in the EC’s own words “an indispensable tool for monitoring the evolution of the EU”.3
Given the indisputable importance of consumer confidence, one should then scrutinise the factors that are relevant for this subjective variable. Our thesis is that unemployment cannot be discarded from the key elements explaining confidence. Therefore, besides considering inflation as a target variable, which indeed is being controlled at the European level by the European Central Bank, it may be the case that unemployment should also be explicitly considered as another target variable.
The objectives of the paper are thus, on the one hand to show how an objective measure, such as the unemployment rate, can be used to understand the trajectory registered by a subjective measure, such as the consumer confidence indicator and, on the other hand to verify how the retrospective use of the
objective measure can, in fact, lead to an approximation of a subjective measure which is intrinsically prospective, as it is the case with confidence.4 To put it clearer we hypothesise that, from a fuzzy logic perspective, the unemployment rate is a proxy variable, in the econometrics sense, of confidence. To achieve those objectives, data on consumer confidence and on the unemployment rate for the
2
Despite this fact, the European Commission (Directorate General for Economic and Financial Affairs) indeed conducts regular harmonised business and consumer surveys that produce data on the economic sentiment, consumer confidence, etc. Another source of data on subjective phenomena, namely happiness, is the World Database of Happiness. See http://www2.eur.nl/fsw/research/happiness/index.htm.
3
See http://europa.eu.int/comm/economy_finance/indicators/businessandconsumersurveys_en.htm.
4
In fact, as acknowledged by the European Commission (2003), “the consumer confidence indicator is the arithmetic average of the balances (in percentage points) of the answers to the questions on the financial situation of households, the general economic situation, unemployment expectations (with inverted signs) and savings, all over
enlargement fifteen European Union member states will be considered.5 The achievement of these objectives should indicate that ignoring the unemployment trajectory, when attaining high(er) levels of confidence is a policy objective, as it indeed sometimes happens, is likely to lead to failure.
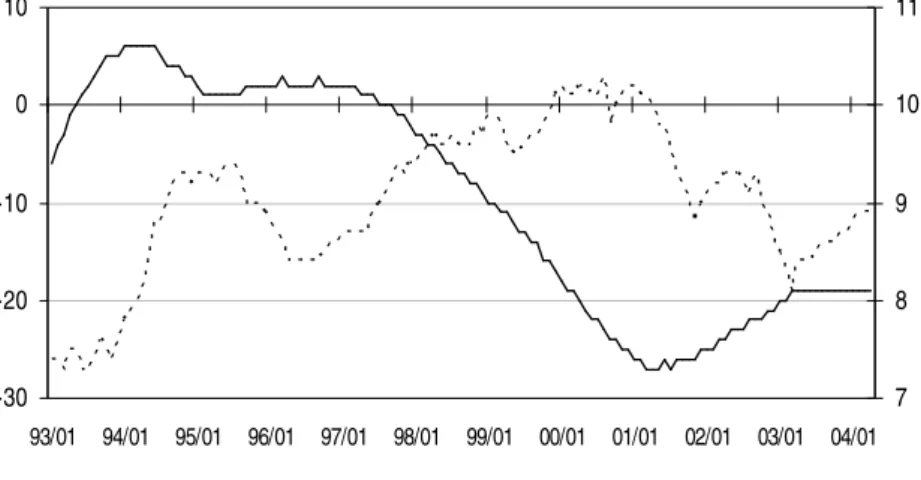
That being said, it may be illuminating to start with a general picture of the situation. In graphical terms, the situation can be visualised as follows.
-30 -20 -10 0 10 93/01 94/01 95/01 96/01 97/01 98/01 99/01 00/01 01/01 02/01 03/01 04/01 7 8 9 10 11
Consumer Confidence Unemployment Rate
Figure 1: Confidence and unemployment in the EU-15
As figure 1 shows, there seems to exist an overall inverse relationship between the values assumed by the consumer confidence indicator and those assumed by the unemployment rate, although, in certain sub-periods, this cannot be verified.6 Concerning the unemployment rate, a general decrease was observed, after and before periods of moderate increases, whereas consumer confidence increased most of the time until the beginning of 2001, initiating then a general decrease. Hence, at first sight it may be considered difficult to obtain values based on the unemployment rate that approximate those registered by the consumer confidence indicator. As it will become clear later on, that may be the case from a, say, naïve point of view, but certainly not the case with fuzzy logic.
The rest of the paper has the following structure. Section 2 analyses the fuzzy logic process from which the consumer confidence indicator, as a subjective measure, can be related with the unemployment rate, as an objective measure. As a control exercise section 3 presents the results when, instead of unemployment, inflation is used. Section 4 concludes.
5
The source of the data, which is monthly and covers the period 1993M01 to 2004M04, is the Eurostat.
6
2. THE FUZZY LOGIC PROCESS
We start with a brief presentation of the fuzzy logic approach that will be used throughout the paper. Consider U to be a universal set and
A
being a subset of U in the classical sense, that is A⊆U . Following the logic of crisp sets, the degree to which an element of U belongs toA
is either 0 or 1. In other words, the characteristic function ofA
,µ
A :U →{ }
0,1 , being defined asµ
A( )
x =1 for x∈A, andµ
A( )
x =0 for x∉A, thus discriminates respectively between members and non-members of the crisp set. The generalisation to a fuzzy set is made by relaxing the strict separation between elements belonging or not toA
, allowing the degree of belonging/membership to take more than these two values, typically by allowing any value in the closed interval [0,1]. See, for instance, Zimmermann (1991) or Chen (1996).The values then assigned by the membership function of a fuzzy set to the elements in the universal set indicate the membership grade or degree of adherence of each element in the set. Larger (smaller) values naturally indicate higher (lower) membership grades, degrees, or consistency between an element of the set and the full characteristics that the set describes.7 Hence, using fuzzy logic, one can deal with reasoning like: ‘the observed value for the unemployment rate, say 5%, can be considered high, normal or low with some degrees of membership’.
In terms of fuzzy logic, ‘high’, ‘normal’ or ‘low’ values (for the variable under question) can be considered to be subjective categories, as economic agents often evaluate those concepts differently. In what follows, it will be assumed that consumers use these kinds of subjective categories to ‘construct’ an approximate indicator of their confidence, therefore assuming an approximate or qualitative reasoning. In general, this corresponds to the assumption of an inference mechanism based on if-then decision rules described as follows. The linguistic variables ‘high unemployment’, ‘normal unemployment’ and ‘low unemployment’ constitute the so-called antecedent vector, say X, in the universe of discourse of unemployment, say U. A fuzzy algorithm relating those linguistic variables with consumer confidence, as a fuzzy variable, is then constructed on the basis of statements or if-then decision rules such as: ‘if the observed value for the unemployment rate is considered low with a higher degree of membership then consumer confidence also rises’.
7
Although many authors defend that membership defines the degree of adherence rather than the probability of an event, some others consider that the membership function may be considered akin to a subjective probability distribution. See, for instance, Chang and Stekler (1977).
To sum up, the structure of the fuzzy system that will be used can be presented as follows:
1. Fuzzification: Transformation of quantitative data on the unemployment rate (crisp inputs) into qualitative categories, that is linguistic terms such as ‘high’, ‘normal’ or ‘low’ (fuzzified inputs); 2. Inference: Construction of fuzzy rules from the membership functions of inputs-antecedents and
outputs-consequences, followed by the determination of fuzzy output linguistic terms;
3. Defuzzification: Transformation of the previous qualitative/linguistic terms back into real numbers, i.e. the translation of fuzzy to crisp output(s), in the case the ‘low’ unemployment category, which will constitute an approximation to the values of the consumer confidence indicator.
2.1. FUZZIFICATION
Let us assume that consumer confidence is related with unemployment and that the unemployment rate can be characterised by three qualitative categories (subjective terms) according to:
‘unemployment rate’ ∈ {low, normal, high}.
The translation of the unemployment rates, measured on the real axis, into those categories will be achieved through the use of membership functions associated with the fuzzy sets of ‘low’, ‘normal’ and ‘high’ values. In our case, these functions were derived from the empirical distributions of the unemployment rates for the EU 15 member states for the period 1993M01-2004M04. See figure 1. Concerning the choice of the shape for the membership function, the gaussian curve type will be used because it is consistent with the data and it does not exclude data from coming from all – ‘low’, ‘normal’, ‘high’ – possible distributions, as might happen, in an ‘ad-hoc’ way, with trapezoidal/triangular membership functions.
As pointed out in Evans and Honkapohja (1999), following Sargent’s (1993) suggestion, one possibility of substituting fully ‘rational’ agents by agents possessing bounded rationality is by considering that agents’ memory is also bounded. In a sense, this suggestion was followed in the determination of the normalised membership values given that they were obtained using a rolling window with a fixed length. To put it more formally, we start by computing a moving average:
w
u
u
t w t j j t∑
+ − ==
1 , fort
≥
w
(1)and a moving standard deviation
(
)
1 1 2 − − = =∑
− + w u u t w t j t j tσ
(2)where w is the length of the rolling window.8
Given our choice for the type of membership function, i.e. a normal density function:
(
)
(
)
,
2
exp
2
1
,
,
2 2
−
−
=
σ
µ
σ
π
σ
µ
x
x
f
(3)the non-normalised membership values for the unemployment rate associated with the categories ‘low’, ‘normal’ and ‘high’ were determined as
(
u u k)
low f t, t−σ
t,σ
t → (4)(
u u)
normal f t, t,σ
t → (5)(
u u k)
high f t, t +σ
t,σ
t → (6)where f is defined as in (3). Plainly, the separation between the average position for the three categories of unemployment, given by (4), (5) and (6), is made proportional, through the parameter k, to the dispersion of the data.
2.2. INFERENCE
For making an inference, it will be assumed that the behaviour of consumers can be approximated by simple ‘if-then’ decision rules as follows:
If u∈Uthen
z
∈
Z
, where U and Z are fuzzy sets and u and z are real numbers.
8
This means that, for each new observation on the unemployment rate, consumer forget the oldest in their minds. The length of the window can thus be associated with the number of observations that consumers keep in their memory. Consequently, throughout the period under analysis, the mean and the standard deviation, in which are based the membership values, will vary.
As we are using only one objective measure, this stage assumes a particularly simple form. Given that consumer confidence is plausibly related, in an inverse way, with the unemployment rate, we simply consider that the only category to be considered is the ‘low’ one.9 In other words, in this stage consumers transform the qualitative factors of unemployment rates into their confidence.
2.3. DEFUZZIFICATION
The use of fuzzy rules during the inference stage produced fuzzy outputs, which have to be translated back into crisp outputs. In our case, this means that the inference output must be defuzzified into real numbers which will constitute the approximate confidence indicator. As the most plausible approximation, we simply consider the values assumed by the normalised degrees of membershipness of the ‘low’ category for unemployment.10
We also consider that consumers, when forming their confidence at a moment t, go through a fuzzification process applied to the unemployment rates observed during the last w months (including the present one),
i.e. from t – w + 1 until t, for
t
≥
w
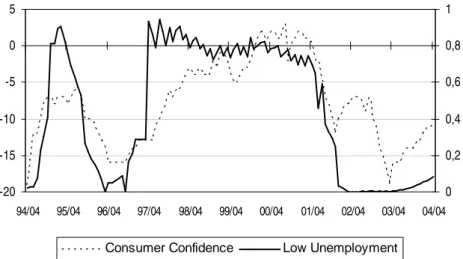
covering all the period under analysis. The normalised membership values for the ‘low’, ‘normal’ and ‘high’ values of the unemployment rates were then obtained considering, for a grid of values of w, the value of k leading to the maximum correlation between the consumer confidence indicator and the ‘low’ normalised membership value for unemployment.Following the procedure described above, a window, w, of 16 months and a value of k = 1.66, were determined as the best parameterisation, leading to a correlation coefficient of 0.74. The following figure thus plots the original series of the consumer confidence indicator and the normalised membership values associated with the ‘low’ category for unemployment for w = 16 and k = 1.66.
9
Given that symmetry was considered in determining the membership values, the ‘high’ category is a just a mirror image of the ‘low’ one.
10
-20 -15 -10 -5 0 5 94/04 95/04 96/04 97/04 98/04 99/04 00/04 01/04 02/04 03/04 04/04 0 0,2 0,4 0,6 0,8 1
Consumer Confidence Low Unemployment
Figure 2: The subjective measure versus its approximation
Despite the inherent subjectivity, a comment on the previous figure would possible state that the fit, in a qualitative way, is a fair one, at least in the sense that, in the most part of the period, the tendencies presented by both variables are not in clear disagreement.
That being said, a natural question that may arise is: what if consumers, when forming their confidence level, possess decaying memory, in the sense of giving less importance to observations far away in time? A straightforward way to accommodate the effects of decaying memory is to consider that, in moment t, the membership values are filtered by linear decaying factors
p
j, for t – w + 1 ≤ j ≤ t, such that pt =1,… ,pt−w =0. Given the length of the window this can be achieved by considering:
(
)
w w t j pj − − = . (7)The use of factors given by (7) increases the correlation coefficient to 0.867 whereas the optimal value for
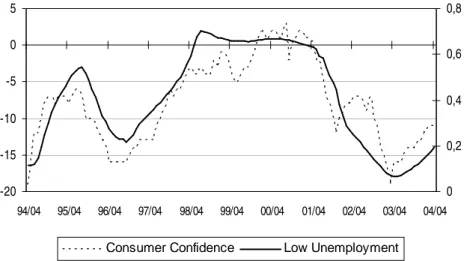
-20 -15 -10 -5 0 5 94/04 95/04 96/04 97/04 98/04 99/04 00/04 01/04 02/04 03/04 04/04 0 0,2 0,4 0,6 0,8
Consumer Confidence Low Unemployment
Figure 3: The linear decaying memory case
A simple comparison between figures 2 and 3 shows a clear improvement on the approximation, leading us to admit that, indeed, not to every observation on unemployment is given the same importance by consumers when forming their confidence.
Plainly, the decaying factors (7), given the implicit linearity, are subject to criticisms. In fact, a more plausible way to consider decays in memory is by admitting exponentially decaying factors as follows:
(
)
(
j t)
pj =expµ − , (8)
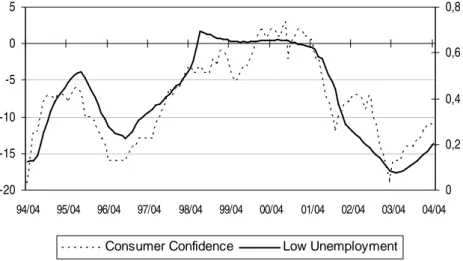
for t – w + 1 ≤ j ≤ t, where µ relates to the degree of memory loss. The use of factors given by (8), revealed an optimal value of µ = 0.104 whereas k = 0.682. As expected, this diminishment on the importance of more distant observations of unemployment led to an increase on the correlation coefficient between the two series, whose value is 0.872. The figure corresponding to this case is the following:
-20 -15 -10 -5 0 5 94/04 95/04 96/04 97/04 98/04 99/04 00/04 01/04 02/04 03/04 04/04 0 0,2 0,4 0,6 0,8
Consumer Confidence Low Unemployment
Figure 4: The exponential decaying memory case
Clearly, in both previous cases we imposed a particular case for the decay in memory. Despite the fine approximations already achieved, possible improvements are to be expected if, in a free way, the factors
pj are determined without imposing a specific form. In this sense, the exercise was repeated imposing the
only restriction that pt-w+1≤ pt-w+2≤ … ≤ pt-1≤ pt. For this case, the optimal values were determined to be k = 0.787 and p1 = p2 = 0.200, p3 = p4 = … = p14 = p15 = 0.295 and p16 = 2.02, leading to a correlation
coefficient of 0.884. Figure 5 shows the results.
-20 -15 -10 -5 0 5 94/04 95/04 96/04 97/04 98/04 99/04 00/04 01/04 02/04 03/04 04/04 0 0,2 0,4 0,6 0,8
Consumer Confidence Low Unemployment
Figure 5: The almost free decaying memory case
Despite the flexibility used in the determination of the factors on the previous case, one may still consider that imposing a decaying memory may not be the best case as, indeed, given the periodicity on the unemployment rate, consumers may worse remember observations that are not necessarily at the beginning of the window. The previous case seems to indicate that the current observation of the
unemployment is the most important but it may be the case that others less important can occur at the middle of the period.
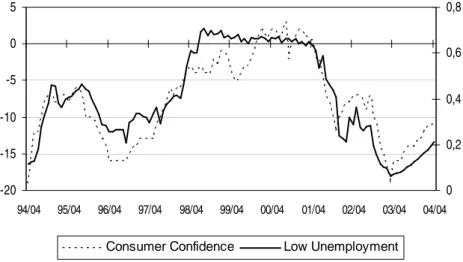
That being said, the last exercise that was performed consisted on the determination of the optimal values for k and pj without imposing any restriction. The results that were obtained were: k = 0.717 and p1 =
0.0648, p2 = 0.0045, p4 = 0.1071, p5 = 0.1898, p6 = 0.4173, p10 = 0.1588, p16 = 0.7982, all the other pj
being zero. Obviously this case leads to the best approximation, conducting to a correlation coefficient of 0.893. The figure corresponding to this case is the following:
-20 -15 -10 -5 0 5 94/04 95/04 96/04 97/04 98/04 99/04 00/04 01/04 02/04 03/04 04/04 0 0,2 0,4 0,6 0,8
Consumer Confidence Low Unemployment
Figure 6: The free decaying memory case
Figure 6 shows what, in our opinion, can be considered a good fit between the two series leading us to admit that, in fact, the level of confidence is much more related to unemployment than is apparent; see figure 1. In the case of no (or even weak) relation between unemployment and confidence we can certainly admit that the optimization exercises, in particular in all the previous cases but also in this last case, could indeed lead to a fair approximation during part(s) of the period under analysis but would visibly fail during the rest of the period.
3. IS CONFIDENCE ALSO RELATED TO INFLATION?
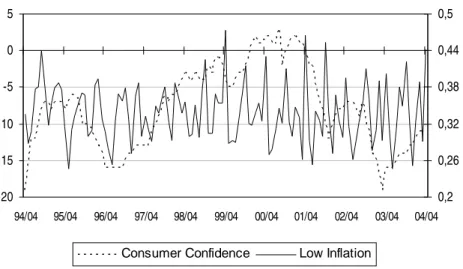
A control exercise on the previous results can be performed by using another objective variable instead of unemployment. A natural choice for this other variable is inflation given the clear importance of this variable at the EU macro-policy level. Following the procedures above described, the results for the free decaying memory when monthly inflation is considered were: k = 0.25 and p1 = 35649, p7 = 2.0185, p13 =
-20 -15 -10 -5 0 5 94/04 95/04 96/04 97/04 98/04 99/04 00/04 01/04 02/04 03/04 04/04 0,2 0,26 0,32 0,38 0,44 0,5
Consumer Confidence Low Inflation
Figure 7: The free decaying memory case
The correlation coefficient between the two series being as low as 0.04 clearly indicates what the previous figure clearly shows, i.e. from our perspective by noteworthy figures, that inflation cannot be related with confidence as much unemployment is.
4. CONCLUSION AND DISCUSSION
As a general conclusion, we would like to highlight that, in our opinion, it is clearly possible to approximate the trajectory of a subjective measure, such as the consumer confidence, by only one objective measure, such as the unemployment rate. In this sense, the paper reveals the apparent importance that unemployment has, as it should have, on confidence. Moreover, it illustrates that retrospectiveness may be used in order to understand prospectiveness.
Given that, at least at an aggregate level, confidence is much more related to unemployment than is apparent, this should be taken into account in the design of the EU economic policies. Paying more attention to unemployment at a European level may indeed impose that each of the member states performs this task. If so, a natural way to enrich our work is to proceed with the same kind of analysis at a disaggregated level, that is for each of the EU member states.
If indeed confidence is not undissociable from unemployment, an understanding of this link between these two economic measures may be of crucial importance, for instance, to economic policies designed to increase perceived well-being or satisfaction by the inevitable use of objective aggregates. In particular, these issues seem to be of crucial importance for an incumbent which, due to re-election goals,
wants the electorate to feel particular confident at the day of the elections.11 In fact, a casual observation on the reality may point out that re-elections tend to be associated with peaks on consumer confidence but it also indicates that, in what gives respect to confidence, probably more important than the level is the
direction assumed by the unemployment rate, just as fuzzy logic would prescribe. We also would like to
consider these matters in future research.
REFERENCES
Bagnoli, Carlo, and Halbert C. Smith (1998), “The theory of fuzzy logic and its application to real estate valuation”, The Journal of Real Estate Research, 16, 2, 169-199.
Caleiro, António (2003), “Subjective versus Objective Economic Measures: A fuzzy logic exercise”, Departamento de Economia Working Paper 2003/11, Universidade de Évora.
Chang, S.S.L., and H.O. Stekler (1977), “Fuziness in Economic Systems, Its Modeling and Control”,
Annals of Economic and Social Measurement, 6, 2, Spring, 165-174.
Chen, C.H. ed. (1996), Fuzzy Logic and Neural Network Handbook, McGraw-Hill, New York.
Draeseke, Robert, and David E. A. Giles (1999), “A Fuzzy Logic Approach to Modelling the Underground Economy”, Econometrics Working Papers, University of Victoria, Canada.
European Commission (2000), “Business Climate Indicator for the Euro Area (Presentation Paper)”, Directorate General for Economic and Financial Affairs.
European Commission (2003), “The Joint Harmonised EU Programme of Business and Consumer Surveys: User Guide”, Directorate General for Economic and Financial Affairs, Economic Studies and Research, Business Surveys.
Evans, George W., and Seppo Honkapohja (1999), “Learning Dynamics”, in Handbook of
Macroeconomics, Vol. 1A, edited by John B. Taylor and Michael Woodford, Elsevier Science,
Amsterdam, 449-542.
Landajo, Manuel (2000), “Neural and Fuzzy Models for Economic Forecasting: An econometric view and some practical experience”, Fuzzy Economic Review, 5, 1, May, 3-28.
Matsusaka, John J., and Argia M. Sbordone (1995), “Consumer Confidence and Economic Fluctuations”,
Economic Inquiry, 33, 2, April, 296-318.
Nordhaus, William D. (1975), “The Political Business Cycle”, The Review of Economic Studies, 42(2), 130, April, 169-190.
Santero, Teresa, and Niels Westerlund (1996), “Confidence Indicators and their Relationship to Changes in Economic Activity”, Economics Department Working Paper No. 170, OECD.
11
As is well-known, ever since the seminal paper of Nordhaus (1975) many political business cycle models consider the unemployment rate as crucial for the electorate.
Sargent, Thomas J. (1993), Bounded Rationality in Macroeconomics, Clarendon Press, Oxford.
West, James E., and Bruce Linster (2003), “The Evolution of Fuzzy Rules as Strategies in Two-Player Games”, Southern Economic Journal, 69, 3, 705-717.
Zadeh, L.A. (1965), “Fuzzy Sets”, Information and Control, 8, 338-353.
Zimmermann, H.-J. (1991), Fuzzy Set Theory - and Its Applications, 2nd edition, Kluwer Academic Publishers, Boston.