Replenishment Subscription Services
The Impact of Product Satisfaction,
Awareness, and Perception on Consumers’
Intention to Subscribe
Franziska Stahuber
Dissertation written under the supervision of Paulo Romeiro
Dissertation submitted in partial fulfilment of requirements for the MSc in
International Management with a Major in Marketing, at the Universidade
ABSTRACT
Title: Replenishment Subscription Services – The Impact of Product Satisfaction, Awareness, and Perception on Consumers’ Intention to Subscribe
Author: Franziska Stahuber
For the last five years, subscription e-commerce has grown by over 100% p.a. in the US – presenting a fast-growing channel of purchasing online. FMCG companies can increase revenue streams by offering products through a Replenishment Subscription Service (RSS). RSS offers grocery and commodity products via automated, periodic deliveries which save consumers time and effort.
Quantitative research surrounding RSS has remained scarce which results in identifying two research needs:
Understand consumers’ decision process to subscribe to RSS by lending a framework for innovation adoption, which includes the revised stages of awareness, perception, and intention to subscribe.
Analyze product requirements since it is questioned if consumers, who are satisfied with their current product choice, are more likely to subscribe and hence, repurchase their products through RSS? Therefore, the study equates a standard repurchase process triggered by satisfaction with the periodic purchase through RSS.
The goal was to study the impact of product satisfaction, awareness, and perception about RSS on consumers’ intention to subscribe.
Consumers’ level of product satisfaction about RSS significantly impacts the intention to subscribe. Perception about advantages, ease of use and, compatibility with shopping habits were positive indicators for subscribing. Consumers’ overall perception fully mediates the relationship of awareness and partially mediates the relationship of product satisfaction on the intention to subscribe to RSS.
Building on findings, the paper gives implications and recommendations for companies to market RSS with its products and, to target consumers in an appropriate way to increase subscription rates.
Keywords: Subscription services, replenishment, grocery automating, intention to subscribe, satisfaction, awareness, perception, mediator model
SUMÁRIO
Title: Replenishment Subscription Services – O Impacto da Satisfação, Conscientização e Percepção do Produto na Intenção dos Consumidores de Assinar
Author: Franziska Stahuber
Nos últimos cinco anos, a subscrição do comércio eletrônico cresceu mais de 100% a.a. nos EUA - apresentando um canal de compras online em rápido crescimento. Empresas de FMCG podem aumentar fluxos de receita oferecendo produtos através de um Serviço de Subscrição de Reabastecimento (RSS). RSS oferece produtos de mercearia e mercadorias através de entregas automatizadas e periódicas poupando tempo e esforço aos consumidores.
A pesquisa quantitativa do RSS permanece escassa. Foi identificada a necessidade de compreender o processo decisivo de subscrição do RSS dos consumidores. Isto foi analisado através do empréstimo de uma estrutura para adoção da inovação, incluindo etapas revisadas de conscientização, percepção e intenção de assinar.
Surgiu a necessidade de analisar requisitos dos produtos, questionando se os consumidores, satisfeitos com a escolha atual, estão mais propensos a assinar e, portanto, recomprar através de RSS? Então, o estudo equacionou um processo de recompra padrão desencadeado pela satisfação da compra periódica via RSS.
O objetivo foi estudar o impacto da satisfação, conscientização e percepção sobre o RSS na intenção de assinar.
O nível de satisfação em relação ao RSS impactou significativamente a intenção de assinar. A percepção sobre vantagens, facilidade de uso e compatibilidade com hábitos de compra foi positiva, indicador de adesão. Consequentemente, a percepção dos consumidores mediou totalmente a relação de conscientização e parcialmente na satisfação na intenção de assinar o RSS.
Baseado nos resultados, o artigo dá implicações e recomendações para empresas comercializarem RSS e, para atingir os consumidores adequadamente para aumentar as taxas de assinatura.
Keywords: Serviços de subscrição, reabastecimento, automatização de mercearias, intenção de subscrição, satisfação, sensibilização, percepção, modelo mediador
ACKNOWLEDGEMENTS
Completing this thesis is not only the last part of my academic education but would not have been possible with many people involved who have supported me along the way.
I want to express my gratitude to my supervisor Professor Paulo Romeiro, for his guidance, his feedback, and his support to carry out this research.
Thank you to all my wonderful old and new friends, who were not only great sparring partners in my daily university life but also spiced up my time in Lisbon, a time I do not want to have missed. Thank you for sharing constant streams of wonderful moments filled with laughter and inspiring discussions and for always being there in times I needed the extra motivation. A special thanks goes to Lars who always brightens up my day, always has my back, shares his unconditional energy and love with me, supports me continuously, and encourages me to always explore.
Last but not least, a huge “thank you” goes to my parents for giving me the opportunity to get an outstanding education. Thank you for your endless support, your guidance, and patience. Thank you for always having my back and thank you for all the love. I am more than grateful to have such an amazing family.
TABLE OF CONTENTS
ABSTRACT ... II SUMÁRIO ... III ACKNOWLEDGEMENTS ... IV TABLE OF CONTENTS ... V TABLE OF FIGURES ... VII TABLE OF TABLES ... VIII TABLE OF APPENDICES ... IX GLOSSARY ... X 1 INTRODUCTION ... 1 1.1BACKGROUND... 1 1.2PROBLEM STATEMENT ... 2 1.3RELEVANCE ... 3 1.4RESEARCH METHODS ... 3 1.5DISSERTATION OUTLINE ... 4
2 LITERATURE REVIEW AND CONCEPTUAL FRAMEWORK ... 5
2.1SUBSCRIPTION SERVICES ... 5
2.1.1 Market Characterization ... 5
2.1.2 Replenishment Subscription Services (RSS) ... 6
2.2ADOPTION OF NEW SERVICES ... 8
2.2.1 Overview ... 8
2.2.2 Diffusion of Innovation ... 8
2.3SATISFACTION ... 11
2.3.1 Repeat Purchase ... 11
2.3.2 Product Satisfaction ... 11
2.4STUDYING THE INTENTION TO SUBSCRIBE TO RSS ... 12
2.4.1 Impact of Product Satisfaction (IV) ... 12
2.4.2 Impact of Awareness (IV) ... 14
2.4.3 Impact of Perception ... 14 2.5CONCEPTUAL MODEL ... 16 3 METHODOLOGY ... 17 3.1RESEARCH APPROACH ... 17 3.2RESEARCH DESIGN ... 17 3.3SAMPLING ... 18 3.4RESEARCH INSTRUMENTS ... 18 3.4.1 Focus Groups ... 18 3.4.2 Online Survey ... 19 3.5CONSTRUCT MEASUREMENT ... 20 3.6SURVEY PRE-TEST ... 22 3.7DATA ANALYSIS ... 22
4.1QUALITATIVE RESULTS ... 23
4.2QUANTITATIVE RESULTS ... 24
4.2.1 Sample Characterization ... 24
4.2.2 Preparation and Cleaning of Data ... 25
4.2.3 Reliability of Constructs ... 25 4.2.4 Manipulation Check ... 26 4.2.5 Descriptive Statistics ... 27 4.2.6 Hypothesis Testing ... 28 4.2.7 Mediation Models ... 31 4.3DISCUSSION ... 36
5 CONCLUSIONS AND LIMITATIONS ... 39
5.1MAIN FINDINGS AND CONCLUSIONS ... 39
5.2MANAGERIAL IMPLICATIONS ... 41
5.3LIMITATIONS AND FURTHER RESEARCH ... 42 REFERENCE LIST ... I APPENDICES ... VII
TABLE OF FIGURES
Figure 1: Conceptual Model ... 4
Figure 2: Innovation Decision Stages adapted from Rogers (1995) ... 8
Figure 3: Innovation Decision Stages adapted to RSS needs (Rogers, 1995) ... 12
Figure 4: Conceptual Model ... 16
Figure 5: Factorial Design: Hedonic x Basic RSS (1) ... 19
Figure 6: Factorial Design: Hedonic x Superior RSS (2)... 19
Figure 7: Factorial Design: Utilitarian x Basic RSS (3) ... 20
Figure 8: Factorial Design: Utilitarian x Superior RSS (4) ... 20
Figure 9: Condition Allocation ... 26
Figure 10: Mediator Analysis; Process Model 4 ... 31
Figure 11: Conceptual Model for Mediator Analysis 1 ... 32
Figure 12: Conceptual Model for Mediator Analysis 2 ... 33
TABLE OF TABLES
Table 1: Overview of Subscription Services adapted from Chen et al. (2018) and Rudolph et
al. (2017) ... 5
Table 2: Operational Model ... 21
Table 3: Construct Reliability Analysis ... 25
Table 4: Process Output for Mediator Analysis 1a – Hedonic Product Category ... 32
Table 5: Process Output for Mediator Analysis 1b – Utilitarian Product Category ... 33
Table 6: Process Output for Mediator Analysis 2 ... 34
Table 7: Process Output Conceptual Model (Continuous IVs) ... 35
Table 8: Process Output Conceptual Model (Dichotomous IVs) ... 36
Table 9: Overview Cluster ... 37
TABLE OF APPENDICES
Appendix I: Focus Group Guide ... VII Appendix II: Focus Group Demographics of Participants ... IX Appendix III: Questionnaire ... IX Appendix IV: SPSS Output Reliability Analysis ... XVI Appendix V: SPSS Output Demographic Statistics ... XVI Appendix VI: Demographics, Stimuli View ... XVIII Appendix VII: SPSS Output Manipulation Check ... XIX Appendix VIII: Descriptive Statistics: ... XXII Appendix IX: SPSS Output for H1 – Effect of LPS on AI ... XXV
Appendix X: SPSS Output for H2 – Effect of LPS on PERC ... XXVII
Appendix XI: SPSS Output for H3 – Effect of AW on PERC ... XXIX
Appendix XII: SPSS Output for H4 – Effect of PERC on ITS ... XXX
Appendix XIII: Mediator Model 1 ... XXXI Appendix XIV: Conceptual Model ... XXXII Appendix XV: Cluster Analysis ... XXXIII
GLOSSARY
Alpha
Beta
& And
ANOVA Analysis of Variance
AW Level of Awareness
DV Dependent Variable
e.g. For example
Et al. Et alii
FMCG Fast Moving Consumer Goods
H Hypothesis
HED Hedonic
HED/UT Hedonic/Utilitarian Scale
ITS Intention to Subscribe
IV Independent Variable
KMO Kaiser-Meyer-Olkin Measure of Sampling Adequacy
KPI Key Performance Indicators
LPS Level of Product Satisfaction MANOVA Multivariate Analysis of Variance
PC Perceived Compatibility
PDI Purchase Decision Involvement
PERC Perception of RSS
PEU Perceived Ease of Use
PRA Perceived Relative Advantage
RQ Research Question
RSS Replenishment subscription service
SD Standard Deviation
TAM Technology Acceptance Model
1 INTRODUCTION
By 2021, about 2.14 billion consumers are projected to purchase goods and services online (eMarketer, 2017). Companies which are accelerating in e-commerce have understood the market and its potential early and have adapted to the needs of the digital retail sector, by implementing the online business within their core strategy and investing in appropriate capabilities (Webster, Booker, & Tager, 2017). Retailing is undergoing significant changes enhanced by technologies and evolving consumer behavior with increasingly busy lifestyles. Subsequently, leading to fragmentation of shopping behavior (Bain & Company, 2018) which forces retailers to rethink their current strategies. Vertical integration and new business models are rising in the ultra-competitive and highly volatile fast-moving consumer goods (FMCG) sector (Deloitte, 2018). Subscription services make up one of the new business models. Gartner (2018) predicts that by 2020, a majority of companies will offer subscription services.
The subscription economy where customers pay a recurring fee to access a product or service is on the rise and subscription companies have grown more than 100% per year for the last five years (Zuora, 2019). They are bypassing distributors to keep control over pricing and promotions (Cook & Garver, 2002; Geller, 2019; Warc, 2019) and sell directly to consumers by implementing subscription mechanisms (McKinsey & Company, 2016). Consequently, they benefit from stable, predictive revenue streams and, long-term customer relationships (Zuora, 2019).
1.1 Background
Subscriptions granting access to content and digital goods (Abdollahi & Leimstoll, 2011) have been on the market since the early 2000s (Rudolph, Bischof, Böttger, & Weiler, 2017) and give consumers access to intangible products without constraints (Rappa, 2000). Within the subscription industry, those business models were able to succeed. Successful companies such as Starbucks or Sephora entered the subscription economy and expanded their assortment by adding subscription services to their product line (Hitwise, 2016) and consumers got educated about subscriptions and the technology surrounding it. In the sector of media and entertainment, Netflix and Spotify became market leaders over the last couple of years (Pike, 2016).
Implementing subscription services can disrupt markets and companies. The razor blade market can be viewed as an example where the market share of the market leader, Gilette, fell from
70% in 2010 to 54% in 2016 due to the entrance of Dollar Shave Club, a subscription service for razor blades (Terlep, 2017; Tzuo & Weisert, 2018).
In e-commerce, FMCG companies can differentiate themselves by offering products through a replenishment subscription service (RSS) (Chen, Fenyo, Yang, & Zhang, 2018; Rudolph et al., 2017). This service predominantly aggregates commodity items based on an agreement between company and customer. The customer can activate an automated subscription for chosen products and receives them within a selected time recurrence (Chen et al., 2018). With implementing RSS, successful retailers as, e.g. Amazon (Amazon, 2019) and Target (Target, 2019) already harvest market potential and answer to changing consumer preferences by providing price advantages, access and convenience through a replenishing mechanism (Chen et al., 2018).
1.2 Problem Statement
The subscription economy has room to grow as more consumers become aware of it (Chen et al., 2018). However, the stream of research on how RSS impact consumers’ purchase intention and its ascendants is still limited (Rudolph et al., 2017).
When focusing on RSS within FMCG research surrounding RSS has remained scarce, and thus, there is a need to first, understand consumers’ process of subscribing to RSS and second, discover the requirements and nature of products which are offered through RSS.
(1) In order to quantify consumers’ intention to subscribe to RSS, a framework for innovation adoption is used. The underlying process of subscribing to (adopting) a new service is three-fold: Firstly, consumers start in a knowledge/awareness phase, where they first hear about RSS. Secondly, a perception about RSS is built during the persuasion stage and thirdly, a decision about whether to adopt or reject the services of RSS is made (Rogers, 1995). In this third stage, the “intention to adopt” or for study purposes, the “intention to subscribe” is measured.
(2) Through RSS, consumers automate their grocery and commodity shopping and consequently get the same products delivered in a recurring cycle. Are consumers more likely to subscribe and hence commit to a specific product if they are familiar and satisfied with this product? The study equates a standard repurchase process triggered by satisfaction with an automated, recurring purchase through RSS and thus introduces product satisfaction as an independent variable.
Therefore, the goal of this research is to examine the impact of consumers’ current level of product satisfaction and awareness on the intention to subscribe to RSS with perception functioning as a mediator. The scope is restricted to an underlying theory about the process of innovation adoption with the focus on non-durable goods.
To substantiate this problem statement, the following research questions (RQ) are introduced: RQ1: What effect does consumers’ level of product satisfaction have on the intention to
subscribe to RSS?
RQ2: What effect does consumers’ level of product satisfaction have on consumers’ perception about RSS?
RQ3: What effect does the level of awareness of RSS have on consumers’ perception about RSS?
RQ4: What is consumers’ perception about RSS and which effect does it have on the intention to subscribe to RSS?
1.3 Relevance
Although subscription services are a tool for FMCG companies to differentiate in e-commerce (Bischof, Böttger, & Rudolph, 2018), research about subscription mechanisms, especially with a focus on FMCG, is still lacking. There is an apparent research gap since no study connects RSS for consumer goods with long studied variables like product satisfaction. Besides, little academic research, especially in a quantitative manner, assessed how RSS impacts consumers’ purchase intention. However, consumers’ traits should be the focus when designing a new service to sustain in the subscription industry (Ewen, 2017) and gain valuable insights to target consumers adequately and analyze retention rates due to its significant impact on firms’ profitability.
Viewing this paper from the macro perspective of marketing, it is classified in the area of product placement and therefore, contributes by giving managerial implications for FMCG companies to understand consumers’ intention to subscribe to RSS.
1.4 Research methods
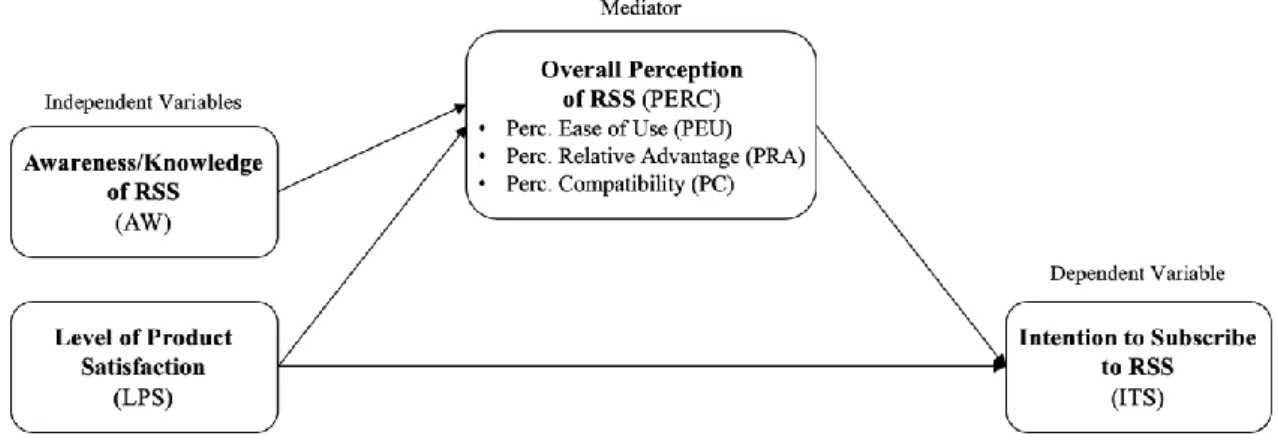
To answer the research questions stated, the methodology used is based on different sets of research: primary and secondary research. Secondary research is collected to derive hypothesis and a conceptual model:
Figure 1: Conceptual Model
Primary research is split into qualitative and quantitative research methods. Qualitative data namely focus groups, are conducted to get a clear definition of RSS and build the factorial design for the following online survey. Quantitative data assessment is based on the online survey with a 2x2 factorial design to understand the impact of consumers’ product satisfaction on their intention to subscribe to RSS and to provide a broad spectrum of managerial implications.
1.5 Dissertation outline
After introducing the research field, the research problem and questions were stated, and its relevance was argued. In the second chapter, a comprehensive review of the literature is presented to put this research into the context of existing knowledge. Consequently, hypothesis are derived, which build the research body. The third chapter covers the methodology, where the research approach and design are stated, comprising a presentation of qualitative data collection and an in-depth overview of quantitative measurements. In the fourth chapter, the results of data collection are analyzed and presented. Subsequently, hypothesis and a conceptual model are tested to answer the research problem followed by a detailed discussion which connects findings to established frameworks and points out differences and similarities in literature. Lastly, in the conclusion and limitations section, all relevant information is summed up, and the most significant findings are revisited. Essentially, this section gives a short description of what has been concluded, taking all aspects of the research into consideration. The final subchapter outlines limitations which are considered in this paper and managerial implications.
2 LITERATURE REVIEW AND CONCEPTUAL FRAMEWORK
In the following chapter, a comprehensive literature review is given. Firstly, to get an overview of RSS. Secondly, the underlying framework for the adoption process is introduced with its ascendants followed by a presentation of the independent variable (IV) “product satisfaction”. Afterward, variables are connected to hypothesize effects between the IVs “product satisfaction” and “awareness”, the mediator “perception” and the dependent variable (DV) “intention to subscribe”. By connecting derived hypothesis, a conceptual model is introduced.
2.1 Subscription Services
Research surrounding subscription services already started around the 17th century (Clapp,
1931) and has developed ever since. Within the e-commerce sector, subscription services are spread widely and can be distributed and marketed in various ways.
2.1.1 Market Characterization
Chen et al. (2018) as well as Rudolph et al. (2017) structure subscription-based e-commerce services into three different categories, which can be differentiated in terms of customer value, earning mechanisms and Key Performance Indicators (KPI) (Rudolph et al., 2017):
In the first category, access subscriptions or surprise subscriptions, consumers pay recurring fees to receive products from a specific product category, which cannot be controlled by the recipient (Chen et al., 2018). The second category, curated subscriptions, are the most dominant in the e-commerce sector (Chen et al., 2018) and the corresponding academic literature (Noorda, 2019; Woo & Ramkumar, 2018). Items within a product category are chosen by a curator based on consumer preferences and are afterward sent to the consumer. They aim at triggering a surprise and delight feeling for customers with personalized service and targeted experiences (Chen et al., 2018).
The third category, and, the research focus of this study, are replenishment subscription services (RSS) (Chen et al., 2018) or predefined subscriptions (Rudolph et al., 2017). Consumers automate their grocery and commodity shopping by subscribing selected products which they receive in a selected, recurring, delivery cycle (Chen et al., 2018). In RSS, best practices are Amazon Subscribe & Save and Dollar Shave Club for razor blades (Chen et al., 2018).
2.1.2 Replenishment Subscription Services (RSS)
As aforementioned, research surrounding RSS is still in the early stages (Bischof, Böttger, & Rudolph, 2017; Bischof et al., 2018; Chen et al., 2018; Rudolph et al., 2017; Warrillow, 2015). RSS is aimed at substituting routine purchases for commodity items since it eliminates the hustle for consumers to remember to replenish products (Randall, Lewis, & Davis, 2016).
2.1.2.1 RSS Design
Compared to other subscription services, RSS exhibits the lowest associated risk, which is often present in e-commerce settings (Fayad & Paper, 2015; Pavlou, 2003). However, some risk potentially occurs since consumers outsource their shopping task to companies. This risk can be minimized by promoting perceived RSS benefits and by giving consumers the flexibility to design RSS components themselves (Bischof et al., 2018; Rudolph et al., 2017). Additionally, with this flexibility, churn rates (number of consumers who terminate the service) can be kept at a low rate (Bischof et al., 2018; Warrillow, 2015).
Most existing RSSs are designed alike with the following components:
• Price: Most providers grant discounts between 5-15% on products purchased through RSS
• Promotion: Almost no special promotions are offered in RSS since researchers suggest to work with promotional discounts or vouchers wisely to gain an investment payback (Chen et al., 2018)
• Placement: Termination of the service is always possible; delivery intervals can be chosen by the consumer; option of skipping certain predefined intervals
• Products: primary commodity items and grocery
No research has assessed connections between intention to subscribe to RSS and consumers’ product requirements in different product categories. For study purposes two product clusters are derived since consumers purchase goods and services for two reasons: to pursue (1) “consummatory affective (hedonic) gratification” and/or to search for (2) “instrumental, utilitarian reasons” (Batra & Ahtola, 1991, p.159). While experiencing a hedonic consumption behavior, the recipient will undergo through multisensory experiences and the “emotive aspects of product use” (Batra & Ahtola, 1991; Hirschman & Holbrook, 1982, p.82). It depends on the individual whether a product functions as a utilitarian or a hedonic good (Batra & Ahtola, 1991; Spangenberg, Voss, & Crowley, 1997; Voss, Spangenberg, & Grohmann, 2003).
2.1.2.2 RSS Implications
For companies to sustain in the RSS market, one of the primary goals, next to revenue generation, is to keep churn rates as low as possible (Zuora, 2019). Furthermore, a long-term goal is to harvest lock-in effects from retaining customers (Janzer, 2017). To achieve these goals, the customer needs to perceive an added value to his purchased service or good (Abdollahi & Leimstoll, 2011). Value in RSS can be added by providing significant benefits that offline shopping is not able to provide. As a result, literature uncovers two pillars: Convenience achieved by its hustle free use is one of the most attractive benefits. The second unique selling proposition (USP) is price since most providers grant consistent discounts (Chen et al., 2018).
2.2 Adoption of new services
Studying the overall e-commerce subscription market, only 32% of consumers are familiar with RSS despite its promising outlook (Chen et al., 2018). Furthermore, not many studies have assessed consumers’ intention to subscribe. In academic research, adoption models serve the purpose to gain quantitative insights into consumers’ intention to accept and use new services. 2.2.1 Overview
One of these theoretical perspectives is the technology acceptance model (TAM) (Davis, 1989). TAM predicts attitudes and behavior of technology adoption with its two moderators (1) perceived usefulness: assessing how the technology will enhance one’s performance and (2) perceived ease of use: the extent to which the system studied is perceived as effort-free (Venkatesh & Davis, 2000).
Another theoretical perspective is the theory of diffusion of innovation, which also incorporates perceived usefulness and perceived ease of use (Rogers, 1962). It studies the underlying factors of how, why, and at which rate innovation is adopted. Diffusion is defined as a process with the four key elements of time, innovation, communication channels, and social systems (Rogers, 1962, 1976, 2003). Research questions in the field of diffusion circle around persona differentiation of early and late adopters and how perceived attributes of the innovation are valued and affect the adoption process (Rogers, 1962).
2.2.2 Diffusion of Innovation
Diffusion of innovation increases the understanding of intentions to subscribe to RSS and was therefore chosen as an underlying theory for this study. It is proposed to categorize RSS as an innovation which is per definition from Rogers (1962) “an idea perceived as new by the individual” (Rogers, 1962, p.11).
The process of diffusion can be divided into five innovation decision stages where potential adopters pass through and build up an opinion about the underlying innovation (Rogers, 1962).
Diffusion theory is applied to predict adoption at a later stage by measuring innovation characteristics at an earlier point in time (Tornatzky & Klein, 1982). Hence, only the first three stages are applied in this study and introduced in the following:
2.2.2.1 Knowledge/Awareness
In the knowledge/awareness phase, the consumer is exposed to the innovation for the first time and gets to understand the service better (Rogers, 1962). Awareness can be defined as the simplest version of brand knowledge and starts with acknowledging the brand name or the new service, followed by a complex cognitive structure based on previously gathered information (Hoyer & Brown, 1990). In the context of diffusion, this first step is called (1) awareness-knowledge which motivates to seek either (2) “how-to” awareness-knowledge, comprising all necessary information for usage and/or (3) principle knowledge containing information about the underlying constructs of the innovation (Rogers, 1995).
Characteristics of the decision-making unit, such as communication behavior, socio-economic traits, as well as personality, play a central role in the awareness process (Rogers, 1962). However, other authors state that the subjective norm is only showing a significant effect in mandatory settings as, e.g., workplace and is not significant in a voluntary context (Venkatesh & Davis, 2000). To conclude, a faster rate of adoption is expected if consumers have related knowledge and experiences with innovation (Dickerson & Gentry, 1983).
2.2.2.2 Persuasion/Perception
A distinction between early and late adopters can be drawn in terms of demographic traits, amongst others, but even if consumers are characterized as early adopters, they might not adopt yet due to their attitude or perceptions which do not match their current state of mind (Dickerson & Gentry, 1983). In diffusion literature, perceptions are the crucial part of rating whether potential consumers will adopt the innovation (Rogers, 1995).
To measure perception, five attributes of innovation are determined: (1) Relative Advantage; (2) Compatibility; (3) Complexity; (4) Trialability; and (5) Observability (Rogers, 1995). Moore and Benbasat (1991) restudy these attributes to build a measurement for the adopter’s potential interaction (perception) with the innovation and label them Perceived Characteristics
of Innovation (PCI). Perceived Relative Advantage, Perceived Ease of Use and, Perceived Compatibility are categorized as the superior attributes to build perception (Rogers, 1995) and are thus studied in depth. All other attributes have been taken into consideration but are eliminated for research needs and limitations (Moore & Benbasat, 1991; Tornatzky & Klein, 1982).
Perceived Relative Advantage
Perceived relative advantage describes the degree the innovation is perceived better and more advantageous than other innovations surrounding it (Rogers, 1962). When building a connection to other theories, especially TAM, this pillar can be compared with “perceived usefulness“ (Davis, 1989).
Perceived Ease of Use
Perceived Ease of Use (Moore & Benbasat, 1991) or “complexity” measures how difficult it is to operate an innovation (Rogers, 1962). This pillar can also be found in research surrounding TAM, and it views the service and its design itself (Davis, 1989).
Perceived Compatibility
Perceived compatibility measures the degree an innovation is comparable with existing values, beliefs and experiences (Rogers, 1962) and it is stated that compatibility of an innovation is positively related to its rate of adoption (Rogers, 1962).
2.2.2.3 Decision
The decision stage captures the perceived likelihood that consumers adopt or reject an innovation based on the perception about innovation (LaBarbera & Mazursky, 1983; Rogers, 1962). Rejection can be further analyzed by distinguishing between (1) active rejection, were adoption is considered but discarded later on, e.g., rejection after trialing it and (2) passive rejection, were adoption was never considered. This study only differentiates between a simple adoption/rejection (Rogers, 1962) to measure the behavioral intention to subscribe (cf. Cheng, Lam, & Yeung, 2006; Pavlou, 2003; Taylor & Todd, 1995).
2.3 Satisfaction
Satisfaction has significant effects on consumers’ continuance intention (Wen, Prybutok, & Xu, 2011) and is additionally a reliable predictor of purchase attitude (Oliver, 1993). It is introduced as an IV for studying intention to subscribe to RSS.
2.3.1 Repeat Purchase
Sharp and Sharp (1997) define repeat-purchasing as “the percentage of buyers who continue to buy the same brand in two equal-length time periods” (Sharp & Sharp, 1997, p. 476). Within e-commerce, repeat purchase intention is defined with the probability that a product will still be bought through the same online seller in the next period (Chiu, Wang, Fang, & Huang, 2014). On the basis of the psychological state in which a loyal customer is situated, Oliver (1999) is differentiating between four stages of the loyalty process, being (1) cognitive, (2) affective, (3) conative and (4) action loyalty respectively, which can be determined as repeat purchasing (Oliver, 1999). Repeat purchasing behavior is not the same as brand loyalty (Szymanski & Henard, 2001), although loyal customers tend to be satisfied.
Analyzing the repurchase process further, literature connects the construct of repurchase with the construct of satisfaction. Oliver (1980) created a cognitive model, within the formation of purchase intentions and states that satisfaction influences repurchase intentions while being part of a dynamic purchase process comprising previous intention, product satisfaction as well as consumers’ current attitudinal level (Oliver, 1980).
2.3.2 Product Satisfaction
Satisfaction is defined as “the consumer’s fulfillment response, the degree to which the level of fulfillment is pleasant or unpleasant” (Oliver, 1997, p. 28). Moreover, satisfaction with the product can also be defined as a psychological process of comparing expected and actual product performance (Cronin, Brady, & Hult, 2000; Oliver & Desarbo, 1988; Rijsdijk, Hultink, & Diamantopoulos, 2007; Tse & Wilton, 1988).
Plenty of authors are aligned with the argumentation that disconfirmation is strongly associated with satisfaction (Oliver & Desarbo, 1988; Swan & Oliver, 1989; Szymanski & Henard, 2001). The expectation confirmation theory, which forms one of the basic models for explaining the development of satisfaction, states that when a product meets the expected performance,
confirmation occurs, and product satisfaction is reached (Oliver, 1980). If performance exceeds expectations, positive disconfirmation occurs, and the level of satisfaction rises. In addition, low product performance triggers negative disconfirmation leading to product dissatisfaction (Swan & Oliver, 1989). Thus, a positive correlation is observed, meaning the more positive disconfirmation occurs, the higher the level of satisfaction (Richins & Bloch, 1991).
Conversely, Johnson & Fornell (1991) state that performance and expectations can drive product satisfaction directly without disconfirmation acting as an intermediary (Hill, 1986). This definition is applied in this study by following Rijsdijk et al. (2007) measurements where overall product satisfaction, product expectations and the mapping of the product compared to the product category is assessed (cf. Fornell, Johnson, Anderson, Cha, & Bryant, 1996). Mittal and Kamakura (2001) express three reasons where variability within the satisfaction-repurchase connection can occur, which has to be kept in mind when introducing satisfaction as a variable. Firstly, consumers characteristics can impact the threshold. Secondly, bias can be observed in the mentioned characteristics, and thirdly the outcome can vary depending on different consumers (Mittal & Kamakura, 2001).
2.4 Studying the intention to subscribe to RSS
This research uses the previously introduced innovation-decision stages (Rogers, 1995) as an underlying framework. It is limited to the first three stages to understand and predict consumers’ intention to subscribe to RSS. This decision is henceforth titled as “intention to subscribe” since this paper strives to analyze consumers’ intentions to subscribe to RSS with underlying ascendants.
Figure 3: Innovation Decision Stages adapted to RSS needs (Rogers, 1995)
2.4.1 Impact of Product Satisfaction (IV)
The variable “level of product satisfaction” is introduced since it became apparent that the intention to subscribe to RSS can be equated with a repurchase process triggered by satisfaction.
2.4.1.1 Impact of product satisfaction on intention to subscribe
Consumers are automating and outsourcing their shopping tasks by giving the replenishment task to RSS, which they view as an essential service for the future (Oracle, 2017). Being satisfied with a current product choice increases the likelihood that consumers repurchase (cf. Hoyer, 1984; LaBarbera & Mazursky, 1983). Various authors (Mittal & Kamakura, 2001; Szymanski & Henard, 2001), as well as Tsai, Huang, Jaw and Chen (2006) who studied the construct of satisfaction within e-based services, argue that satisfied consumers are more likely to keep purchasing through the same distributor. By subscribing to RSS, a product is purchased repeatably. The study proposes that these two constructs are connected, and product satisfaction has an effect on the intention to subscribe to RSS.
H1: The level of product satisfaction is positively related to consumers’ intention to subscribe to RSS.
Moreover, it is proposed that there is a difference in effect size for hedonic vs. utilitarian products in terms of product satisfaction but also, within the likelihood of subscribing to RSS. If consumers buy the same product which is of low importance repeatedly, they do not invest much effort in the decision-making process and instead apply choice heuristics or rules of thumb (Mano & Oliver, 1993). On the one hand, consumers rely on previously gathered product information but on the other hand, also on judgments about the level of recent product choice satisfaction (Hoyer, 1984). Repurchase can also be triggered by inertia due to lacking effort in consumers’ decision-making process (Hoyer, 1984). Moreover, convenience generates utilitarian benefits, which can significantly alter a positive attitude towards the service (Wang, Zhang, Ye, & Nguyen, 2005).
H1UT: The level of product satisfaction for utilitarian products is positively related to
consumers’ intention to subscribe to RSS.
For hedonic purchases and experiences, a higher intrinsic factor tends to be present since utilitarian goods are more beneficial to the consumer (Batra & Ahtola, 1991).
H1HED: The level of product satisfaction for hedonic products is positively related to
2.4.1.2 Impact of Product Satisfaction on Perception
Satisfaction is a reliable predictor of purchase perception and intention (Oliver, 1980, 1993). Hence, perception is proposed to have an impact on the established relationship between product satisfaction and intention to subscribe. This connection also becomes apparent in the modified Howard and Sheth Model (Howard & Sheth, 1969) where the level of satisfaction affected the revised attitude, which furthermore affected the intention to buy again. For study purposes, it is proposed:
H2: The level of product satisfaction positively affects consumers’ overall perceptions about the RSS.
2.4.2 Impact of Awareness (IV)
Davis (1989) motions that perception can be influenced by awareness and previous knowledge about an innovation. Although some scholars do not find significant differences between non-experiences/experienced consumers, Gefen, Karahanna, and Straub (2003) prove that a distinction can be drawn. Their study, which focused on trust and TAM within e-commerce and incorporated familiarity as the IV, denotes that experienced consumers perceived the study conditions as more useful and easier to use resulting in higher purchase intentions (Gefen et al., 2003). This is in line with the diffusion of innovation process where awareness leads to building a perception (Rogers, 1995). As repeated use increases familiarity with the RSS, perceptions increase because of seeing the value-added and better understanding the service and its interface (Hackbarth, Grover, & Yi, 2003). Altogether, it is theorized that:
H3: Awareness about the RSS positively impacts consumers’ overall perception about the RSS.
2.4.3 Impact of Perception
Davis (1989) argues that perception predicts intentions, and consumers need to perceive an added value to subscribe (Chen et al., 2018). After the three Characteristics of Innovation (Moore & Benbasat, 1991) are studied separately in the context of RSS it is concluded, that consumers’ overall perception about RSS influences the behavioral intention of consumers' decision regarding RSS.
2.4.3.3 Impact of perceived relative advantage
In RSS, value for money (Chen et al., 2018; Rudolph et al., 2017) was one of the two significant predictors of subscribing. The second significant predictor is convenience (Davis, Bagozzi, & R. Warshaw, 1989; Tao & Xu, 2018). This is in line with perceived relative advantages of the online shopping sector were convenience is a primary reason for usage (Childers, Carr, Peck, & Carson, 2001; Rohm & Swaminathan, 2004).
Following additional reasons for subscribing were uncovered: gaining a financial benefit, closely followed by recommendations as well as wanting to experience a new service. Financial incentives were next to convenience and personalized experience a primary driver for continuing to subscribe (Chen et al., 2018).
Besides, Tan and Teo (2000) discovered a meaningful connection that perceived relative advantage influences the intention to subscribe. Indeed, researchers attribute high importance to this pillar (Tornatzky & Klein, 1982) and have discovered that this attribute is the best predictor of the innovation adoption rate due to its indication whether consumers are rewarded or punished by adopting (e.g., Hoyer & Brown, 1990). Due to the positive linkage of perceived relative advantage to a favorable decision whether to adopt, it is therefore hypothesized that:
H4a: The perceived Relative Advantage of using RSS, has a positive effect on consumers’ intention to subscribe to RSS.
2.4.3.4 Impact of perceived ease of use
Freedom of choice regarding RSS design components satisfies consumers, and reduces risk (Rudolph et al., 2017). This is mostly the case for attributes as, e.g. delivery intervals and termination options. Perception increases if PEU is viewed positively (Moore & Benbasat, 1991); thus, it is hypothesized:
H4b: The perceived Ease of Use of RSS has a positive effect on consumers’ intention to subscribe to RSS.
2.4.3.5 Impact of perceived compatibility
In general, Tan and Teo (2000) found a significant linkage that perceived compatibility influences the intention to adopt when the studied object is comparable with adopters set of
values. RSS can be categorized as a non-traditional form of distributing products to consumers but creating a new shopping experience to the consumer. In contrary to offline shopping, the social experience is lacking, trying products is different and, the added value depends, amongst others, on the individual’s shopping orientation (Rohm & Swaminathan, 2004). A study uncovered that consumers are not seeking the service itself instead they are looking for added value and tangible benefits in terms of memorable end-to-end experiences, lower cost, and personalization (Chen et al., 2018). Therefore, it is proposed that the perception of how RSS is compatible with consumers’ shopping habits has a positive influence on the intention to subscribe (cf. Rogers, 1995).
H4c: The perceived Compatibility of RSS with consumers’ values, has a positive effect on consumers’ intention to subscribe to RSS.
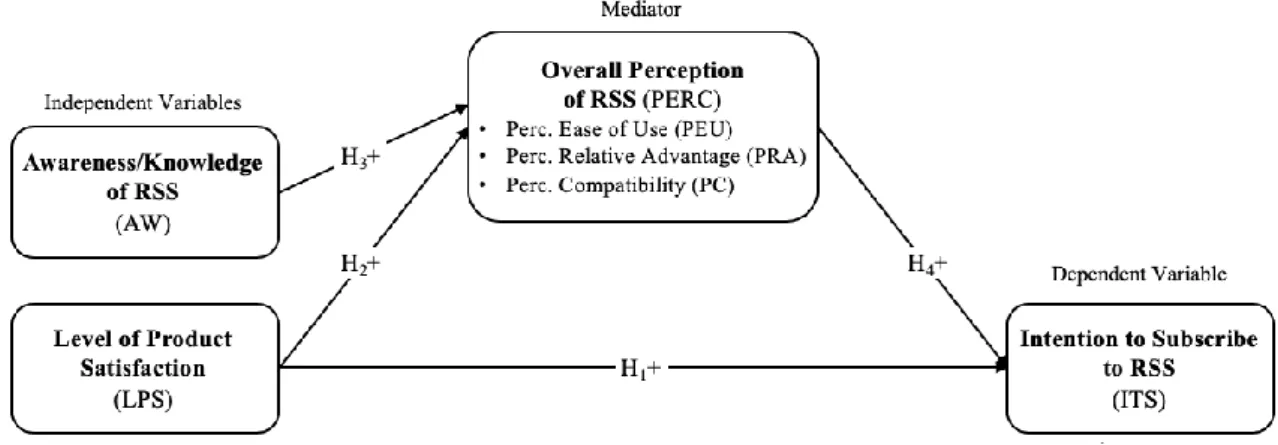
2.5 Conceptual Model
To conclude, the following conceptual model is derived when combining the previously stated hypothesis by connecting literature:
3 METHODOLOGY
This chapter comprises a detailed description of the methodology and its procedures used to fulfill set research questions and reach conclusions about the hypothesis formulated in the previous chapter.
3.1 Research Approach
The underlying methodology of this study was comprised of both secondary as well as primary research methods. Secondary research was revised to study the constructs connected to RSS and its mechanism itself. After collecting secondary research, qualitative and quantitative data was collected and used complementary as primary data. Qualitative research encompassed three non-structured focus groups to build the factorial design. Afterward, quantitative research was designed based on the information retrieved and included descriptive and confirmatory research by distributing and analyzing an online survey. The data obtained was subjected to quantitative analysis to test the hypothesis and answer the research questions thoroughly.
3.2 Research Design
In order to get first insights and set design guidelines for the quantitative data, qualitative research was encompassed of three non-structured focus groups. The overall goal was to gather insights to design the stimulus needed for quantitative data. Through focus groups, productive and valuable insights about consumer behavior, knowledge, perceptions, and attitudes can be gathered through a relaxed, free flow and open discussion between the participants (Malhotra, Nunan, & Birks, 2017). They were conducted in either German or English, lasted for about one hour and was recorded for further analysis. For the heterogeneous focus groups, the criteria used to randomly choose the participants was age to get representative insights for designing the quantitative conditions. Each focus group had six participants.
The type of conclusive research chosen is descriptive research to test the hypothesis. It is pre-planned, and the information needed is clearly stated (Malhotra et al., 2017). The data generation was based on a single cross-sectional design or survey research design since information was conducted from any sample population only once (Malhotra et al., 2017). Hence, as a second block of primary data, a survey with directed questions and structured data collection was allocated. The mode of administration was online via the platform Qualtrics, a
web service for surveys. Not only have survey methods been used to measure innovation diffusion and adoption behavior, but main advantages are also seen due to the methods’ low costs and time efficiency (Malhotra et al., 2017). Besides its simple distribution, this method is not bounded by demographics and data is consistent due to limited alternatives stated. Disadvantages as, e.g., not getting all relevant consumer thoughts have been taken into account when deciding on the method (Malhotra et al., 2017).
3.3 Sampling
To fulfill the research aim, a 2x2 factorial between-subject design was built and allocated randomly. Thus, a convenience sampling method was used (Malhotra et al., 2017), which is based on a random sample. This method is simple, systematic, and stratified meaning that every sample unit has the same probability of being selected. Even though convenience sampling brings the risk of obtaining biased results (Malhotra et al., 2017), the method was carefully selected. In this respect, the sampling method is advantageous due to time and money constraints at hand. Participants were promised a gift incentive for completing the questionnaire (raffle to win one of two 10€ Amazon vouchers). The target audience was narrowed down to consumers who have shopped online before by implementing screening questions at the beginning of the survey.
3.4 Research Instruments 3.4.1 Focus Groups
As stated, the focus groups were conducted in order to design the stimuli for the online survey, to reduce possible researcher bias and to verify previously made assumptions. After the focus group guideline was pre-tested, the guide was narrowed down to six sections. The focus group started with warm-up questions, followed by assessing general attitudes and personal background with subscription services. Next, participants were confronted with ideas and questions about RSS to gather experiences and insights. Furthermore, they were given the task to design their own RSS based on given attributes (Focus Group Guidelines) which contributed to the overall goal of planning the design. Further, it was discussed about the chosen design, and the focus group concluded by talking about the willingness to subscribe to RSS (Appendix I).
3.4.2 Online Survey
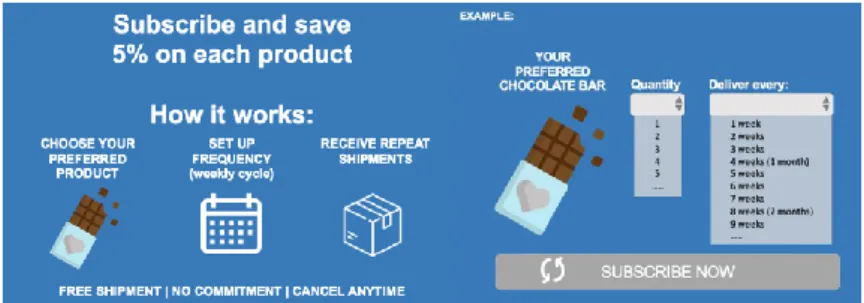
After developing the stimuli based on the focus groups, the online survey was developed. The survey was conducted to measure the impact of product satisfaction and awareness on the intention to subscribe to RSS with the mediation effect of perceptions. The survey was built upon 38 questions and included an experiment with a full factorial 2x2 between-subjects design. Condition 1/2: Hedonic/utilitarian product consumption was used as the first condition group and manipulated by giving respondents either a hedonic or a utilitarian product category, which was predefined. Chocolate was used for the hedonic product category, whereas toothpaste functioned as the utilitarian product category (Dang, 2016).
Condition 3/4: Two different RSS designs, which differed regarding delivery intervals, were built based on focus group results. Especially big players like Amazon Subscribe & Save (Amazon, 2019) and Target Subscriptions (Target, 2019) have rather high delivery frequencies (starting from one month) for consumers to choose from. Consumer insights showed a discrepancy since this period was rated as too long for specific product categories, and demand for weekly circles was uncovered. Likewise, the literature suggested focusing on smaller cycles combined with smaller product sizes (Bischof et al., 2018). Consequently, the basic RSS design was based on one-month intervals (Figure 3&5) compared to the superior design with weekly intervals (Figure 4&6). Inevitably, as literature defines advantages of RSS based on convenience and price, this was reflected by the RSS design as well. Both shipping of products and the termination were free of charge. Product price was set at the usual price but with a 5% discount for each product when purchased through the subscription service.
Figure 5: Factorial Design: Hedonic x Basic RSS (1)
Figure 7: Factorial Design: Utilitarian x Basic RSS (3)
Figure 8: Factorial Design: Utilitarian x Superior RSS (4)
To summarize, the experiment was based on a 2 (hedonic, utilitarian) by 2 (basic RSS design, superior RSS design) between-subject design. Participants were randomly assigned to one of four conditions in the experiment.
3.5 Construct Measurement
The survey consisted of five sections: (1) Screening, (2) Random condition allocation (3) Level of satisfaction, (4) RSS, and, (5) Demographics. Based on a thorough literature assessment, subsequent reliable and applicable measurement scales were selected. The overall majority of the constructs have been used in its original form; however, minor adaptions have been made to wording and content, fitting this study. All constructs used were measured with non-comparative multi-item rating scales respectively on 5-point Likert scales or 5-point semantic scales, regardless of their original scale.
(1) Screening questions were used to identify the target population by asking if they have ever shopped online before. If the answer given was negative, the potential participant was excluded from the study. On the contrary, if the answer was affirmative, participants were asked to indicate their online shopping frequency followed by an assessment about a purchase within the last six months of chocolate and toothpaste. If at least one of the products were purchased, the survey was continued. A three-item scale for shopping comparison (Noble, Griffith, & Adjei, 2006) which deals with price comparison and price sensitivity and a three-item scale for
purchase decision involvement (PDI) (Mittal, 1995) was tested to conduct further potential analysis.
(2) After random distribution to one of the four conditions, a manipulation check was performed by measuring utilitarian/hedonic consumption on an eight semantic differential scale by Batra & Ahtola (1991) which statements were regarded as very reliable (=0.8) and valid.
(3) Product satisfaction (LPS) was adapted from Rijsdijk (2007) and based on Hausknecht (1990) as well as questions found in the American Customer Satisfaction Index (ACSI) (Fornell et al., 1996). The first two items were measured ranging from 1 = “totally disagree” to 5 = “totally agree” asking about satisfaction with the product and comparison to other products in the category. The third item measured experience with the product, which ranged from 1 = “much worse than expected” to 5 = “much better than expected.”.
(4) Before introducing the RSS to the participant, awareness/knowledge (AW) was tested on a semantic differential scale and was anchored with “unfamiliar/familiar”, “inexperienced/experiences” and “not knowledgeable/knowledgeable” (Schlosser, 2006). To measure perceptions of the innovation (PERC) the construct by Moore and Benbasat (1991) was used which was developed to assess the adoption of new technologies in organizational environments and measured the perception of innovation for the individual level of adoption. The original construct consists of 34 items on seven different scales and was adapted to study purposes. Lastly, the intention to subscribe (ITS) was measured on a combined scale where four questions asked about adoption to RSS overall and one particularly about chocolate/toothpaste.
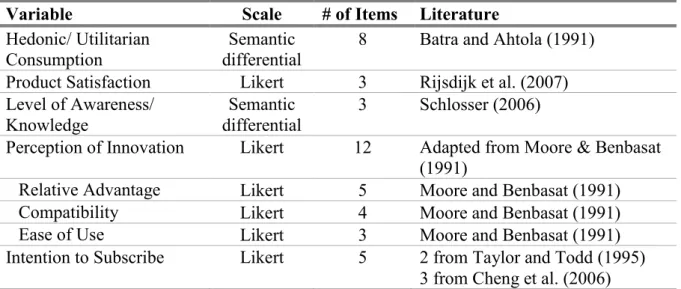
Variable Scale # of Items Literature
Hedonic/ Utilitarian Consumption
Semantic differential
8 Batra and Ahtola (1991) Product Satisfaction Likert 3 Rijsdijk et al. (2007) Level of Awareness/
Knowledge
Semantic differential
3 Schlosser (2006)
Perception of Innovation Likert 12 Adapted from Moore & Benbasat (1991)
Relative Advantage Likert 5 Moore and Benbasat (1991)
Compatibility Likert 4 Moore and Benbasat (1991)
Ease of Use Likert 3 Moore and Benbasat (1991)
Intention to Subscribe Likert 5 2 from Taylor and Todd (1995) 3 from Cheng et al. (2006)
(5) Additionally, the following demographic factors have been tested in the questionnaire to control for possible effects on the conceptual model: gender, age, nationality, occupation, education, income level, and household size.
3.6 Survey Pre-test
To secure accuracy, a pre-test was conducted to test question content, working flow, and formatting issues. Also, a particular focus was put on instruction and question difficulty as well as consistency of condition design. After the sample size of 15 responders gave feedback, the questionnaire was revised.
3.7 Data Analysis
Insights from the focus group were harvested by first transcribing transcripts, followed by a coding process to analyze findings. Additionally, a ranking of answers for the interactive RSS design study was comprised.
All obtained data from the online survey was analyzed using IBM SPSS Statistics Software. Techniques of descriptive statistics were applied to analyze and characterize the target population. Continuing, construct validity was tested by conducting Cronbach’s alpha as a measure of internal consistency. Manipulation check was conducted by running factor analysis, MANCOVA, and correlation analysis to identify directions and effect sizes of the relationship between variables. Furthermore, correlation analysis ascertained the direction and the effect sizes of relationships. A confidence level of 95% and a significance level of 5% was applied for all purposes. Effect sizes were measured by conducting linear regressions and additional statistical tests to explore relationships in more depth. After studying independent effects, two simple mediation models were analyzed by applying the Hayes’ macro PROCESS (Hayes, 2013). A mediation model seeks to explain the mechanism underlying the relationship from IV to DV variable via the inclusion of the mediator variable (Taylor, MacKinnon, & Tein, 2007). To finish the analysis off, a mediation model with two IVs was conducted as derived from the literature review.
4 RESULTS AND DISCUSSION
In chapter four, previously conducted data is analyzed. This chapter is divided into an examination of qualitative as well as quantitative data, which includes a discussion of connecting findings to established frameworks and points out differences and similarities in literature.
4.1 Qualitative Results
The sample characterization of the three focus groups is heterogeneous and is comprised of a broad spectrum of age distribution, education level, and occupations (Appendix II). This way, a common understanding of the RSS design was conducted.
The focus groups started with warm-up questions, where participants talked about online shopping in general. Overall, a mixed attitude and perception about online shopping were noted and, participants indicated that their purchase behavior varied depending on the product category. For some participants, it was essential to try on clothes in the store; some do not like the hassle of sending things back, and others enjoyed the feeling of going to the store. Participants who had a positive attitude towards price indicated to value price comparison opportunities and the ability to have a broad spectrum of choices. Also, convenience played an important role. When narrowing online shopping down to online grocery shopping, only a few participants had experience with it. Supplements have been named three times as products which have been shopped online and some rare products which cannot be found in regular supermarkets. Surprisingly, in two of the focus groups, subscription boxes (surprise subscription) have been mentioned by participants when talking about online grocery shopping. Participants who used them before spoke highly of them but reported that they terminated due to the inability of using the products within an expected time frame.
Next, RSS was introduced. About half of the participants knew about RSS but called it “grocery subscription services”, thus this term was used for the survey. Independent of demographics, almost all participants mentioned the perceived advantages of convenience and price. Moreover, there was a clear tendency to design needs. Regarding pricing of the RSS, A 5% discount on every product was the overall preferred choice. It was argued that this gives an incentive to rebuy the brand/product through the subscription mechanism.
In comparison, the option of ‘If you ship less than five products within one month, you will receive a 5% discount. If one has five or more products delivered to the same address within one month, one will receive a 15% discount‘ (Appendix I) did not find much liking since consumers would then be triggered to buy more products even though they do not want/need them. On the design categories of termination and shipping, the majority was of the opinion to have both options for free. The RSS should be as easy as possible and designed in a way which does not trigger reactance. In terms of delivery cycles, consumers favor options of short cycles and the ability to choose the cycle themselves compared to predefined cycles. Here they argue that they know best when they need to replenish something and feel pressured if this cycle is decided for them. Participants did not understand that RSS market leaders only offer cycles of one month since certain products would need replenishment in a shorter frequency.
In general, the majority was intrigued by the RSS and had a positive attitude towards the service. However, the design of the service was assessed as crucial when deciding whether to adopt or not. All in all, qualitative research successfully reached the goal of building the RSS design stimulus.
4.2 Quantitative Results
All quantitative results were retrieved from the previously conducted survey and analyzed by either SPSS or PROCESS for SPSS (Hayes, 2013).
4.2.1 Sample Characterization
A total of 318 responses were collected from which 219 were taken into consideration for analysis after the data was cleaned (see 4.2.2). The respondents’ gender is almost represented equally as 51.6% are female and 48.4% are male. Regarding age distribution, the demographic data showed that 86.3% of the population is up to 44 years old. By clustering nationalities, almost 3/4 are German, and remaining nationalities are clustered in the category “other”. Income was clustered into three categories: low income (>1000€), medium income (1001-2000€), and high income (<2000€). Over half of the population (50.7%) is grouped into the first category, 27.4% are medium income holders, and the rest were clustered within the high-income group. Most of the population is either employed full time (46.1%) or a student (44.3%) who mostly either have an undergraduate (42%) or postgraduate degree (43.8%). Only 10% have a high school degree as the highest form of education (Appendix V). However, a
non-probability sample was used, which evinced that the sample cannot be considered representative of the population. Nevertheless, an indication for homogenous groups can be detected due to the similarity of demographic data across all four conditions (Appendix VI).
4.2.2 Preparation and Cleaning of Data
The screening mechanism excluded all participants who indicated that they have never shopped online before. After finishing the data preparation and exclusion of incomplete cases, a total number of 219 cases remain to be used for analysis purposes. Firstly, it was checked for univariate outliers were standardized values (z scores) were utilized, and secondly, the data was analyzed for multivariate outliers by using Mahalanobis distance. As a result, a few cases were deleted. This low number of outliers can be explained by the use of pretested Likert scales, which are restricted to specific answer choices. Only the HED/UT scale needed further cleaning to work with the data. Additionally, scales were renamed and relabeled for a better understanding. To further prepare the dataset for analysis, constructs were combined and mean scores were computed.
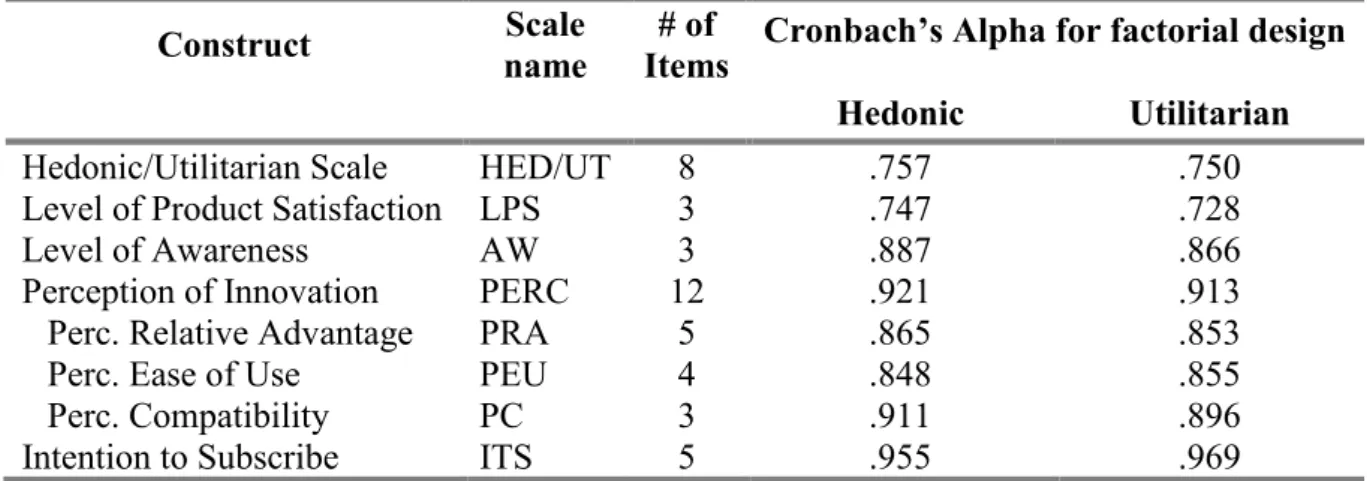
4.2.3 Reliability of Constructs
Even though all scales were tested in literature, Cronbach’s Alpha for the constructs’ internal consistency was conducted to check the reliability of scales. It is satisfactory when the Cronbach’s Alpha coefficient, which is measured on a scale ranging from 0 to 1, is >0.7, good when >0.8, and excellent when >0.9 (Gliem & Gliem, 2003). As the following table shows, all scales were satisfactory, and hence, scale items were combined to generate one continuous score per construct.
Construct name Scale Items # of Cronbach’s Alpha for factorial design
Hedonic Utilitarian
Hedonic/Utilitarian Scale HED/UT 8 .757 .750
Level of Product Satisfaction LPS 3 .747 .728
Level of Awareness AW 3 .887 .866
Perception of Innovation PERC 12 .921 .913
Perc. Relative Advantage PRA 5 .865 .853
Perc. Ease of Use PEU 4 .848 .855
Perc. Compatibility PC 3 .911 .896
Intention to Subscribe ITS 5 .955 .969
4.2.4 Manipulation Check
Before hypothesis were tested, manipulation checks were run. A principal component analysis was performed for checking the Hedonic/Utilitarian scale. Factor analysis explors underlying constructs in an assessment and gives insights into which items appear to measure the same constructs. KMO (Kaiser-Meyer-Olkin Measure of Sampling Adequacy) value is preferred when above 0.6, in the respected case the KMO is 0.856 and Bartlett's Test of Sphericity shows a statistically significant value (Bartlett, 1954). An investigation of the scree plot showed that two values are above the Eigenvalue of 1, so only two factors are extracted, which explain 74.5% of the variance. In line with previous research, one component loads on hedonic factors, whereas the second component loads on the utilitarian factor. The construct measures the variables as it is supposed to (Appendix VII).
Furthermore, the factorial design was split almost equally between the sample size, but it has to be assessed whether groups are significantly different.
Figure 9: Condition Allocation
A multivariate analysis of variance (MANOVA) was conducted to assess if there are significant differences between the four conditions in the linear combination of ITS, LPS, AW, and PERC. The main effect for the four conditions is not significant, F(12,642)=1.55, p=.101, η2
p=.03,
suggesting the linear combination of ITS, LPS, AW, and PERC is similar for each condition. An analysis of variance (ANOVA) was conducted as a post hoc test for each DV to examine the effects of the conditions further. However, all conducted ANOVAs are insignificant, which resulted in the exclusion of the RSS Design variation (Condition 3&4) as a factorial design. When performing a MANOVA with only product category as a factorial design, the main effect is significant, F(4,214)=2.43, p=.049, η2
p=.04, suggesting the linear combination of ITS, LPS,
LW, and PERC is significantly different between the conditions 1&2 (Appendix VII). However, the reported p-value is on the edge of significance, which needs be kept in mind.
4.2.5 Descriptive Statistics
To get a more detailed overview of the sample’s characteristic, means were analyzed and if necessary, compared. It was mainly of interested how means differ regarding the factorial design consumers were randomly allocated to.
Screening questions captured consumers’ PDI (Mittal, 1995) and the level of price comparison shopping (Noble et al., 2006). The overall population has a rather high PDI (3.39.89), which implies that consumers are moderately involved when making a purchase decision about the product in question. When analyzing the data with a split for product categories, only for the statement “I would not care at all/a great deal to which toothpaste/chocolate I buy” the mean difference between the two groups is statistically significant (Appendix VIII). Consumers allocated to the hedonic product category indicate that they care (4.06.74) when buying chocolate, which connotes a higher level of involvement than for consumers who buy toothpaste (3.76.86).
Consumers who engage in comparing prices seek retailers and products with the lowest price, which is subjectively acceptable (Noble et al., 2006). As stated in the literature review, for RSS, price is one USP for consumers to participate. Indeed, the overall mean shows that consumers tend to compare prices when shopping (3.49.89). This finding is not different in means when comparing it to ITS. A paired sample t-test is statistically insignificant, which indicates that ITS is made regardless of consumers’ tendency of comparison shopping.
To shed light on consumers’ LPS, they indicate to be moderately satisfied (3.84.61) with their current product choice in the allocated product category (chocolate/toothpaste). For additional analysis, a new scale was created by dividing the LPS scale by a mean split method and grouping consumers into “low satisfied consumer” and “high satisfied consumer”.
When deep diving into the RSS, consumers are moderately familiar with the RSS (3.041.3). Nevertheless, consumers’ overall AW about RSS is rather low (2.711.15), which makes the introduction to the RSS quite essential for consumers.
In terms of PERC of the RSS, namely PRA, PEU, and PC no significant differences in means of the different stimuli were observed. Overall, consumers have a fair perception of RSS (3.61.71). Besides, participants have a neutral perception of PC, explaining on how the RSS
fits into their current shopping style. Further, PRA accounts for a mean of 3.62, which proves that perception about advantages is positive. PEU excels compared to the other two categories, and consumers perceive the RSS easy to operate, clear in understanding and usage.
4.2.6 Hypothesis Testing
To answer the research questions and hypothesis, various inferential statistics were conducted on a significance level of 5% and a confidence level of 95%. For all linear regressions following assumption were checked and can be assessed in the appendix for the respective test:
The assumption of normality was checked by visual inspection of a Q-Q scatterplot (Hayes, 2013). For the assumption of normality to be met, the quantiles of the residuals cannot strongly deviate from the theoretical quantiles. Homoscedasticity was evaluated by plotting the residuals against the predicted values (Field, 2009; Osborne & Waters, 2002) and the assumption was met if the points appeared randomly distributed with mean=0 and no apparent curvature. Variance Inflation Factors (VIFs) were calculated to check for multicollinearity between predictors. High VIFs indicate increased effects of multicollinearity and VIFs greater than five were cause for concern, whereas VIFs of 10 are considered the maximum upper limit (Field, 2009). Besides, univariate and multivariate outliers were checked however, no outliers were detected during the data preparation and cleaning phase.
4.2.6.1 H1: LPS is positively related to the consumer’s ITS to RSS
To test the effect of LPS on the ITS, a linear regression was run. All assumptions were fulfilled (Appendix IX). The overall model has a week quality in predicting the effect of LPS on ITS (R=.243) since the low adjusted R2 of .055 shows that LPS solely explains 5.5% of the variance
in ITS thus, LPS is only a small driver. However, the model is still statistically significant in predicting ITS (B=.449, t(217)=3.68, p<.001) and H1 was accepted. To describe the relationship
between the predictor variable and the outcome variable, regression coefficients were additionally calculated. H0 (LPS=0) was rejected and the unstandardized regression equation
was computed: ITS=1.441+0.449*LPS. This indicates that on average, a one-unit increase in LPS increases the value of ITS by 0.45 units (B=.449).