CHANGES IN DRUGS’ PREFERENCES DUE TO
THE INTRODUCTION OF NEW GENERIC
MEDICINES
Joana Maria Figueira
Dissertation written under the supervision of Professor Isabel Horta Correia and Professor Pedro Raposo
Dissertation submitted in partial fulfilment of requirements for the MSc in Economics – major in General Economics, at the Universidade Católica Portuguesa, 2020.
CHANGES IN DRUGS’ PREFERENCES DUE TO THE
INTRODUCTION OF NEW GENERIC MEDICINES
Joana Maria Figueira
January 8th, 2020
Abstract
The purchase of generic drugs has been increasingly encouraged by Governments, as a way of reducing health costs. However, their acceptance by consumers is not that straightfor-ward and it has been seen some resistance associated with lack of information and some other factors, including loyalty to previously used branded products. Thus, this dissertation aims to study the consumers’ preferences over generic drugs, by clarifying some of these speculations while trying to check whether the data confirms these reasonings.
This was possible by exploring a rich database from the Portuguese National Association of Pharmacies, which includes very detailed information of each medicine sales at pharmacies in Portugal.
The results show that when introducing one more equivalent generic medicine in a group, the individual share of each drug decreases, although the generic ones suffer a higher decrease in their shares. Additionally, generic drugs tend to have a lower individual share than the equiv-alent branded medicines.
Afterwards, over a short time, even on year-on-year comparisons, the shares of generic drugs tend to increase, opposed to the shares of branded products, which indicates a relatively fast change in preferences, based on the speed of information spreading and reputation building. Although in the analyzed sample people buy more generic than non-generic drugs, it is shown that if one more generic medicine and the correspondent proportion of branded drugs is introduced such that the proportion of equivalent generic drugs remains unchanged, the branded products will immediately capture a higher market share.
CHANGES IN DRUGS’ PREFERENCES DUE TO THE
INTRODUCTION OF NEW GENERIC MEDICINES
Joana Maria Figueira
January 8th, 2020
Resumo
A compra de medicamentos genéricos tem vindo a ser encorajada pelos Governos, como forma de reduzir os custos da saúde. No entanto, a sua aceitação por parte dos consumidores não é fácil, havendo alguma resistência associada à falta de informação, mas também a outros fatores, como a fidelidade a medicamentos de marca anteriormente utilizados. Assim, esta dis-sertação tem como objetivo estudar as preferências dos consumidores relativamente a medica-mentos genéricos, tentando clarificar algumas destas especulações e verificar se os dados as confirmam.
Para isso, explorou-se uma base de dados fornecida pela Associação Nacional de Far-mácias, que inclui informações detalhadas das vendas dos medicamentos nas farmácias em Portugal.
Os resultados mostram que ao introduzir mais um genérico equivalente no seu grupo, a quota de cada medicamento individual diminui, apesar de serem os medicamentos genéricos a sofrer uma maior redução. Adicionalmente, medicamentos genéricos tendem a ter uma quota individual menor do que os medicamentos de marca equivalentes.
Seguidamente e ao longo do tempo, numa comparação homóloga, as quotas dos medica-mentos genéricos tendem a crescer contrariamente aos não-genéricos, o que indica uma alter-ação relativamente rápida nas preferências, com base na divulgalter-ação de informalter-ação e crescente reputação.
Apesar de se observar que são vendidos mais genéricos do que não-genéricos na amostra utilizada, verificou-se que se introduzirmos simultaneamente um medicamento genérico e a respetiva proporção de medicamentos de marca de forma a que a proporção de medicamentos genéricos equivalentes não se altere, os de marca irão capturar imediatamente uma maior quota. Palavras-chave: preferências dos consumidores; medicamentos genéricos; mercado dos medicamentos.
Acknowledgements
First of all, I would like to show my gratitude to my supervisors, Professor Isabel Horta Correia and Professor Pedro Raposo, for all the support, help and excellent guidance during these past months. It was a great pleasure to have the opportunity to learn more closely from their own experience and I am really thankful to them for pushing me to try my best.
I am also grateful to Professor Miguel Gouveia for his important comments in the begin-ning of this process, that helped to define the investigation path of this dissertation.
Furthermore, a very special thanks to Inês Teixeira, from ANF, for all her availability, help and share of knowledge. Her patience to clarify all my questions and her useful comments were essential for the success of my dissertation.
I would like to thank my friend Alexandre Sousa for all the incentive and motivation, as well as for the long calls during these two years. To Daniel Belchior and Miguel Santana I thank all discussions, friendship and the good moments that allowed my days at Católica to be more valuable and memorable.
A special thanks goes also to my beloved husband, Pedro, who never lets me give up and is always my anchor to overcome all the difficulties.
Finally, my gratitude goes also to my mother that always supported me in all senses, always believed in me and incentivized me to pursue my goals, and to my father that always believed I would succeed and helped me in his manner.
Contents
Abstract i
Resumo ii
Acknowledgements iii
1 Introduction 1
2 The Portuguese Drugs Market 5
3 Data and Methodology 7
3.1 Sample selection . . . 7
3.2 Descriptive statistics . . . 9
4 Econometric analysis 14 4.1 Changes in individual drug market shares when new equivalent medicines are introduced . . . 14
4.2 The market share of each individual drug as time passes by . . . 18
4.3 The market shares of all the equivalent generic drugs . . . 19
4.4 Including price differences . . . 23 5 Assuming the special reimbursement regime for all drug sales 25
6 Robustness 26
7 Conclusion 26
References 29
1
Introduction
The drugs market has been suffering many changes during the last decades. Not only because new medicines and therapies have been discovered, contributing to the increase in the number of treatments available, but also because when the patents of the original drugs expire, progres-sively new equivalent drugs have been introduced in the market.
In this thesis we will explore how the market shares of equivalent medicines change when more generic drugs are introduced, by using data on the way consumers made choices when con-fronted with the option of buying a generic or a branded medicine. Firstly, this study considers the individual drug shares into their homogeneous groups, which allows to test if each generic drug has higher shares than branded products as well as consumers’ tendency to diversify be-tween equivalent medicines that may be related to some socioeconomic factors. Additionally, the aggregated shares of all the equivalent generic drugs are also taken into consideration, in order to be possible to study preferences for generic drugs as a whole which, once more, may depend on some socioeconomic factors, too. Nevertheless, opposed to Aronsson et al. (2001), the market shares will be computed using quantities, specifically the number of units purchased, instead of the market shares in terms of money spent.
In order to do this, a database provided by the Portuguese National Association of Phar-macies (Associação Nacional de Farmácias - ANF) is going to be used, which includes detailed information of the drugs sales in volume and in value, in each Portuguese county between the years 2013 and 2017. Some characteristics of the drugs are also part of the database, such as if each drug is a generic or a branded product, if a medical prescription is needed to buy them, their reimbursement percentage from government or their classification about the organ or system of organs over which they act. It is expected that consumers’ preferences are mainly influenced by price differences and availability of equivalent drugs but also by some socioeconomic factors. However, the effects of these factors is not easily predicted since, for instance, higher levels of education may lead to more generic acceptance whereas higher income may lead to a preference for a branded product previously used and these two variables correlate and it is not possible to identify ex ante which one will dominate.
By crossing it with a group of socioeconomic variables collected in order to characterize each county, it will be possible to have a perception of the socioeconomic conditions that may influence consumers’ preferences, apart from price differences and availability of equivalent drugs.
After that, two main econometric regressions will be performed to understand how the individual shares of the individual drugs, either generic or brand-name ones, are affected by the introduction of new equivalent generic drugs as well as by consumers’ socioeconomic back-ground. Additionally, this study tries to find if Portuguese patients prefer generic drugs to non-generic ones, taking into consideration price differences and again their socioeconomic characteristics. Since the government has been introducing new policies to incentivize the
con-sumption of generic drugs, it will also be possible to test if these have been effective.
It was possible to conclude that individual generic drugs have lower shares than the equiv-alent branded ones. Moreover, when generic drugs are introduced, the individual share of other equivalent medicines decreases, although the generic medicines are the ones who lose more. Regarding the preferences for generic medicines as a whole, it was possible to verify that the municipalities with more unemployed people are the ones where more generic drugs are sold but, on the other hand, there seems not to be significant differences in terms of the preferences for generic drugs between young and old patients. Furthermore, the higher the price differ-ences between generic and non-generic drugs, the higher the preferdiffer-ences in favor of the first ones. Finally, it was concluded that if one new generic drug is introduced simultaneously with the introduction of the respective proportion of equivalent non-generic drugs, maintaining the proportion of equivalent generic drugs available, the branded products capture immediately a higher share.
Consumers choose the goods they want to buy not only according to price but also taking into consideration the quality of the product as well as some of its characteristics and attributes. (Asker and Cantillon, 2010; Chetty, Looney and Kroft, 2009). Furthermore, sometimes it is not just the characteristics and price of one product itself that matters for the consumer choice, since they also consider how a good compares with other similar ones (Bordalo, Gennaioli and Schleifer, 2013).
In fact, changes in the households’ consumption bundles are frequent and can be seen during recessions and financial crises (Nevo and Wong, 2019; McKenzie and Schargrodsky, 2011) as well as in the different phases of the business cycle (Jaimovich, Rebelo and Wong, 2019). Moreover, when new similar products are introduced in a market there may be an incen-tive to adjust the consumption bundle, which may happen to be different from one household to another due to the existence of some idiosyncratic factors.
Comparisons between goods are not always that simple, and neither is the possibility to have a clear idea about the characteristics of the product. This is particularly true for goods which one must buy and experiment in order to make a judgement and have an informed opinion about it. Take experience goods, which incorporate some health products and drugs, as an example. The positive effect or the side effects of a specific drug are only observable after taking it and those effects can take long to develop. Therefore, it may be difficult to evaluate the quality of the product just by looking at its label or price. Hence, some beliefs may emerge related to products but, unfortunately, these can sometimes be biased and affect negatively the choice and optimal use of drugs. (Baicker et al., 2015).
The uncertainty regarding the use of medicines arises from many factors but, in the last few years, more equivalent drugs have been introduced with the same characteristics of the previously existent branded ones and they have been provoking different reactions in patients’ behavior. A generic drug, as it is called, is a “medicine which has the same qualitative and quantitative composition in active substances and the same pharmaceutical form as the reference
medicine, and whose bioequivalence with the reference medicine has been demonstrated by appropriate bioavailability studies” (WHO Collaborating Centre for Pharmaceutical Pricing and Reimbursement Policies, 2019)). Notice, however, that, due to the avoidance of high costs in research and development, generic drugs can be traded at a lower price, allowing for a reduction in the overall health budget.
On one hand, many governments, including the Portuguese one, have adopted new poli-cies that incentivize the prescription, dispensing and consumption of generic drugs. Electronic prescription software, for instance, has become a common feature, helping physicians to have immediate access to the list of the cheapest generic drugs when prescribing. In Portugal, for example, it is mandatory since 2012 to prescribe medicines using only their International Non-proprietary Name (INN), allowing the patient to choose whether to buy the generic or brand medicine, in the pharmacy. Additionally, governments tend also to assign higher reimburse-ments to generic drugs. Note the case of France, where the patient charge is almost zero when it comes to generic drugs. In many countries, it is also common to see media campaigns that have also been prepared by the national competent authorities (Barros and Nunes, 2010; Dylst et al., 2013).
On the other hand, the low prices may be associated with low quality products by con-sumers (Monroe, 1973; Bagwell and Riordan, 1991). In some extreme cases, there are even some associations of generic medicines with counterfeit drugs due to the price difference, as shown by Håkonsen and Toverud (2011), although generic medicines are also subjected to the same safety and equivalence tests in order to get the authorization to be traded in the market.
Notwithstanding, generic medicines seem not to have the same acceptance as the original brand-name products. Hence, many studies have been done around the world in order to try to understand what the main reasons for a risk averse behavior from consumers toward generic drugs are. Some authors found that some people are still unaware of the existence of equivalent generic products with lower prices and when asked by the pharmacist if they want to buy the generic one, they refuse, arguing that they need to confirm with their physicians whether the generic and the brand-named products are equivalent (see Gill et al., 2010; Håkonsen et al., 2009; Håkonsen and Toverud, 2011; Heikkilä et al., 2007). Previous positive experiences with brand-name product and the idea that if the doctor did not mention the specific name of the generic product it means that the other is better can also contribute to the resistance against the purchase of generic drugs (Heikkilä, et al., 2007; Toverud et al., 2011). In addition, small aspects that at first sight may seem irrelevant, like the color or shape of generic drugs differing from the original branded product, may cause some unease feelings in patients that may even misuse these drugs, resulting in a reduced effectiveness of them (Ching, 2002; Roman, 2009).
Since the doctors’ and pharmacists’ opinions seem to be a determinant factor to the ac-ceptance for generic substitution by patients (Hassali et al., 2005; Shrank et al., 2009), some other studies have been conducted in order to try to understand what these professionals think about it. Shrank et al. (2011) argue that older physicians have significantly worse opinions
about effectiveness of generic drugs than the younger ones, but all of them actually seem to be influenced by their colleagues (Haug, 1997, Thompson, 1997; Saxell, 2014). However, Bron-nenberg et al. (2015) also concluded that physicians are more likely to accept generic medicines than the standard patients.
Furthermore, as described in the beginning to be one of the testes performed in this work, it is expected that consumer’s preferences for generic drugs depend also on their socioeconomic background. Farfan-Portet et al. (2012) found that consumers that live in small areas are more likely to accept generic substitution for the majority of the drugs they analyzed, as well as people that benefits from guaranteed minimum income. Moreover, it seems that higher education tends to increase the acceptance of generic medicines (Dylst et al., 2013; Quintal and Mendes, 2012; Vallès et al., 2003). Notice, however, that better socioeconomic conditions may have different impacts in consumers’ preferences. On one hand, people with higher income may be more reluctant to accept generic drugs but, on the other hand, people with higher education levels may be more willing to accept them. In some cases, when these two factors are much correlated with each other, it may not be possible to identify them clearly. Still, there are different results about the impacts of age and gender on the purchase of generic drugs: Figueiras et al. (2008) concluded that there are no significant differences between distinctive ages or gender, whereas Himmel et al. (2005) and Heikkilä et al. (2007) concluded that people under 60 years old tend to accept generics easily.
Chronic diseases have also been shown to have different impacts. Himmel et al. (2005) found that patients tend to be loyal to the brand-name medicine that have been using previously but Shrank et al. (2009) argue that some patients prefer to change to a generic drug in order to spend less money. However, Stewart et al. (2010) and Figueiras et al. (2008) found that people tend to accept more generic drugs when facing minor diseases, such as a cold or the flu, but tend not to risk on changing to a generic medicine when facing heart problems, diabetes and some other major diseases.
Despite everything, consumers also mention money savings as one of the most important reasons for buying generic medicines (Heikkilä et al., 2007; Himmel et al., 2005) and the fact is that there has been an increase in generic medicines sales in many countries over the last few years. Consequently, it triggered the interest of some researchers to study the effects of the competition that still arise when new generic products are introduced in the market. Grabowski and Vernon (1992) concluded that shortly after a patent expires, generic drugs can capture a large market share due to the difference between the price of the two products. Moreover, some other authors have studied the change in the brand drugs price after the introduction of equiv-alent generics and here the results diverge (see Caves et al., 1991; Frank and Salkever, 1997; Hudson, 1992). Aronsson et al. (2001) studied the impact of generic medicines competition on the market shares of the branded drugs, analyzing micro data from the Swedish drug market, which is regulated by a Reference Price System since 1993. However, by assuming that the demand is inelastic relatively to price, they focus more on the changes of market shares caused
by price differences and not by differences in quantity demanded.
The drug market in Portugal has also been changing during the last years. Generic drug sales have also been increasing and the forecast is that they will continue to increase in the future, as argued by Barros et al. (2015). Even though the price of each medicine that re-quires a medical prescription is previously authorized and regulated by the National Authority of Medicines and Health Products (INFARMED, I.P.), leading to equal prices of each medicine in the whole country, the preferences for generic drugs show a large variation between Por-tuguese municipalities, which are the focus of this dissertation.
After this introduction, an overview on the characterization of the Portuguese drugs mar-ket will be presented in Section 2, with a brief analysis of the Portuguese law. After that, Section 3 will describe the dataset and methodology used in this study and in Section 4 the two econo-metric regressions will be explained and commented: the first one looks specifically for the individual share of each medicine in comparison to the other equivalent drugs, while the second regression takes into consideration the share of all the equivalent generic products. Section 5 will present the same analysis but assuming the special reimbursement regime existent in Por-tugal. A quick analysis of the econometric model used will be made in Section 6 and Section 7 concludes by discussing some of the main results obtained in this dissertation, presenting the limitations of the analysis made and some possible suggestions of work to develop in the future.
2
The Portuguese Drugs Market
The Portuguese law has a very well-defined framework according to which the Portuguese drugs market is established. The National Authority of Medicines and Health Products (INFARMED, I.P.) is an institute integrated in the indirect administration of the Government and reports to the Health Ministry. Its role is to evaluate, authorize, regulate and control the human medicines and health products in the Portuguese market. In consonance with the Decree-law no. 176/2006 of August 30th, the INFARMED has the responsibility to manage the database that includes all the medicines with authorization to be traded in Portugal. In order for the producer to be a market authorization holder, it has to present a detailed requirement directed to INFARMED, including the results of the pharmaceutical and clinical tests made to the medicines.
As established by article no. 113 of the same Decree-law, the drugs can be classified as medicines subject to medical prescription or not, depending on the risk that they may cause to patients when administrated without medical vigilance, when taken in certain quantities and some other aspects. The latter are usually not reimbursed by the Government, except for some specific cases. However, these can be bought in a great variety of shops apart from pharmacies, such as supermarkets and service stations but, in accordance with article no. 1 of the Decree-law no. 238/2007, that was changed by the Law no. 51/2014, they are not reimbursed. Apart from that, the prices of medicines not subjected to medical prescription sold outside pharmacies are not controlled, except for those subjected to a maximum price.
The maximum price regime was assigned to the medicines requiring medical prescription as well as to the medicines not requiring it but that are reimbursed by the Government, by the article no. 3 of the Decree-law no. 112/2011 that was changed by the Decree-law no. 34/2013. However, from 2015 onwards, the Decree-law no. 97/2015 defines that the medicines covered by the maximum price regime should be specified in a government ordinance, which in case are defined be the Ordinance no. 195-C/2015, article no. 2, but remain the same. In those cases, the market authorization holder may charge lower prices but never higher prices than the defined maximum price. The maximum price is defined by INFARMED since 2012 (according to the Decree-law no. 152/2012, article no. 2, that introduces changes to the Decree-law no. 112/2011, and was updated by the Decree-law no. 97/2015).
There are two reimbursement regimes in Portugal, as established by the Decree-law no. 48-A/2010 from May 13th, in the version of the Decree-law no. 106-A/2010 from October 1st. Hence, the general regime has four reimbursement categories defined, A, B, C and D, which are reimbursed at 90%, 69%, 37% and 15%, respectively. The medicines are distributed to these categories in accordance to a government ordinance, updated in 2015 by the Ordinance no. 195-D/2015, article no. 2. On the other hand, there is the special regime with higher percentages, that is applied to people with low income, such when the yearly income is lower or equal to fourteen times the guaranteed minimum monthly income, or even to medicines used to treat certain diseases specified in a government ordinance (see articles no. 19 and 20 from the Appendix of the Decree-law no. 48-A/2010).
When there is at least one generic medicine with the same qualitative and quantitative composition in terms of the active substances, pharmaceutical form, dosage and route of admin-istration, homogeneous groups are formed and published by the INFARMED, in accordance to the Decree-law no. 103/2013, updated by the Ordinance no. 195-B/2015.
Moreover, it is approved by the government members the reference price for each ho-mogeneous group, previously proposed by the INFARMED. Since 2010 the reference price is computed as the price of the generic product with the highest maximum price in each homo-geneous group, and it will be over this reference price that the government reimburse will be applied (article no. 25 from the Appendix of the Decree-law no. 48-A/2010) However, from 2015 onwards, the reference price is computed as the average of maximum prices of the 5 generic drugs with the lowest prices (article no. 19 of the Decree-Law no. 97/2015). Therefore, the maximum government reimbursement for the general regime of drugs covered by the refer-ence price system will be equal to the percentage of the respective category times the referrefer-ence price (article no. 28 of the Appendix of the Decree-law no. 48-A/2010).
It is worth mentioning that, since 2012, the medical prescription must be done using not the name of the drug brand, but the International Non-proprietary Name (INN) of the active substance instead. However, the physician may just in a few cases specify the brand of the medicine that should be used by the patient, such as when the drug will be used to continue a treatment already started (Article no. 2 of the Law no. 11/2012). When buying the medicine
at the pharmacy, each patient should be informed about other existing equivalent drugs and the ones that are reimbursed by the government. It is mandatory that all the pharmacies have at least 3 of the 5 generic drugs with the lowest prices for each homogeneous group and they should sell the one with the lowest price to patients. Nevertheless, the customers have the right to choose which one they prefer among the ones with the same INN, pharmaceutical form and dosage according to the medical prescription (Article no. 3 of the Law no. 11/2012).
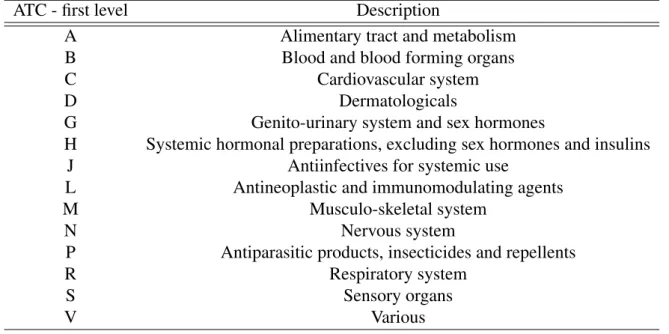
One should also note that in Portugal the medicines are also classified according to their pharmacotherapeutic classification. This classification has a direct correspondence with the Anatomical Therapeutic Chemical Code (ATC code) which is controlled by the World Health Organization (WHO), specifically the Collaborating Centre for Drug Statistics Methodology. This code is internationally used and it groups the medicines according to the organ or system of organs over which the drugs act in the body, as well as their therapeutic, pharmacological and chemical properties. One can check this correspondence by reading, for instance, the Order of the Secretary of the State for Health no. 4742/2014, of March 21st. Another aspect of the ATC code is that is it composed by 5 different levels and the first one (the first letter of the code) relates to the anatomical main group.
3
Data and Methodology
3.1
Sample selection
In order to study the consumers’ preferences, a database that includes the sales of each drug aggregated in municipalities was used. It was kindly made available by the Portuguese National Association of Pharmacies (Associação Nacional de Farmácias - ANF) for this study and con-tains monthly data on the sales in value and in volume between the years 2013 and 2018, as well as some variables that characterize each drug, such as if the drug is a generic one, its ho-mogeneous group, its ATC code and its official reimbursement by the National Health Service (NHS). However, only about 82% to 85% of the Portuguese pharmacies report their sales to ANF, which means that it was not possible to have access to the whole Portuguese drug market. As a consequence, the sample includes only 305 of the 308 counties, with São Vicente, Lajes das Flores and Corvo not being represented.
Simultaneously, a group of socioeconomic variables that allows for the characterization of each Portuguese county was also collected from the Portuguese National Statistics Institute (Instituto Nacional de Estatística - INE). However, these variables were only available for coun-ties with an annual periodicity and up to the year of 2017. Consequently, in order to cross the two databases, it was needed to convert the monthly data on drug sales into annual data. More-over, the period of the analysis was reduced to the years 2013 to 2017 in order to be possible to characterize the counties (See Table 1 for a description of the data selection). Regarding the variables related to the level of education, such as the percentage of people more than 14 years
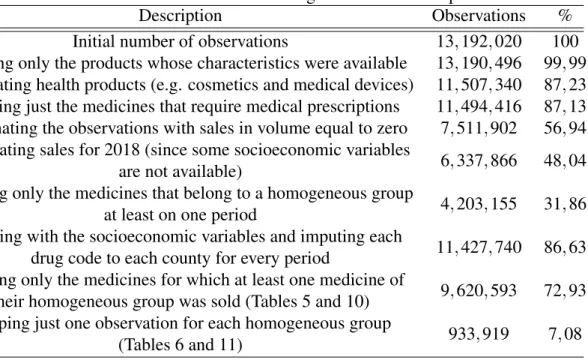
Table 1: Number of observations during the data selection process
Description Observations %
Initial number of observations 13, 192, 020 100
Keeping only the products whose characteristics were available 13, 190, 496 99, 99 Eliminating health products (e.g. cosmetics and medical devices) 11, 507, 340 87, 23 Keeping just the medicines that require medical prescriptions 11, 494, 416 87, 13 Eliminating the observations with sales in volume equal to zero 7, 511, 902 56, 94 Eliminating sales for 2018 (since some socioeconomic variables
are not available) 6, 337, 866 48, 04
Keeping only the medicines that belong to a homogeneous group
at least on one period 4, 203, 155 31, 86
Crossing with the socioeconomic variables and imputing each
drug code to each county for every period 11, 427, 740 86, 63 Keeping only the medicines for which at least one medicine of
their homogeneous group was sold (Tables 5 and 10) 9, 620, 593 72, 93 Keeping just one observation for each homogeneous group
(Tables 6 and 11) 933, 919 7, 08
old that completed only the high-school, that have an academic degree or that did not complete any educational level at all, are only available at a county level from the Censos database. The last data collection is of 2011, two years before the first year of our database, but these variables were still introduced since they are considered as the best proxy for the educational level of the population possible. Hence, all the socioeconomic variables change annually, except for the education related ones that were considered constant over the whole period. See Table 2 for a description of the socioeconomic variables. Notice that one observation is the detail of one medicine in a county, for a given year.
Hence, the used database included the sales of each drug in each county, but then select-ing the drugs was necessary. Firstly, only the drugs that require a medical prescription were considered since these are the ones that have their prices controlled. Additionally, because it is of our interest to study the preference for generic drugs, only the medicines that have at least one equivalent generic drug were considered, ignoring all the medicines without generic equiv-alents. Thus, only the drugs that belonged to one homogeneous group at least during one period were kept.
The homogeneous groups are one crucial aspect of this analysis. In fact, all the shares will be computed considering the number of units sold of the individual medicines or the number of units sold of all the generic drugs in the total of units sold in the respective homogeneous group. The reason for this is that, as previously mention in Section 2, one homogeneous group includes all the equivalent drugs in terms of the qualitative and quantitative composition of the active substances, pharmaceutical form, dosage and route of administration. Therefore, the analysis will be performed inside of each homogeneous group, which identifies the equivalent drugs. It is worth mentioning that the optimal unit of measure would be the Defined Daily Dose
Table 2: Socioeconomic variables
Variable Description
youngpeople Percentage of resident population less than 25 years old old people Percentage of resident population more or equal than 65
years old
total pop Average of the total resident population
pharmpc Number of pharmacies per capita
minincome Percentage of the resident population that benefits from the guaranteed minimum income
unemp Percentage of the adult resident population enrolled in the Employment and Professional Training Institutes
density Population density
income Average basic remuneration by worker
noeduc Percentage of resident population with more than 14 years old with no education
highsch Percentage of resident population with more than 14 years old with only the high school completed
acdegree Percentage of resident population with more than 14 years old with
Notes: This Table reports the socioeconomic variables taken into consideration in the cluster analysis. All of them, except for the totalpop, were also included in the regressions analyzed in Section 4.
(DDD) which is defined as the “average maintenance dose per day for a drug used for its main indication in adults” by the WHO (2019), since it would allow us to control for the fact that one person might take one pill with 500mg or two pills with 1g of the same active substance. However, DDD was not available in the ANF database and so this analysis focus on the shares in units (for instance, pills and ampoules).
Additionally, it will be computed the out-of-pocket price per unit for each medicine so as to consider the differences in their prices. Thus, the unitary out-of-pocket price considered is calculated as the difference in the price per unit of one drug and the unitary price of the equivalent drug with the lowest price in their respective homogeneous group. Moreover, the unitary prices previously mentioned are not the total price of the medicines but only the part actually paid by consumers.
3.2
Descriptive statistics
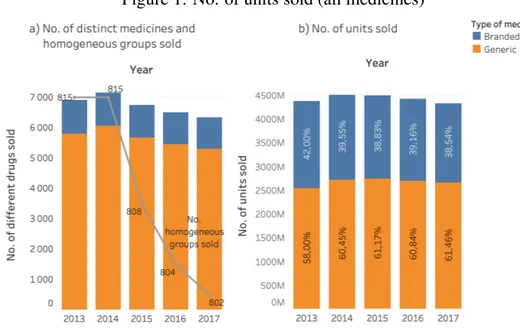
Just by using some simple descriptive statistics, it was possible to identify some facts. The number of medicines sold has been decreasing from 2013 to 2017, in about 800 homogeneous groups, as shown in panel a) of Figure 1. Moreover, the market share of generic drugs in units sold has been slightly increasing, despite the fact of the total number of units sold of all the medicines has been decreasing (see panel b) of Figure 1).
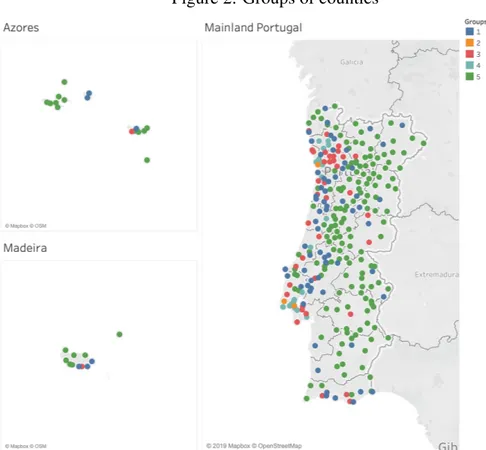
There can also be seen some differences in the consumption patterns across the different regions of Portugal. In a first analysis, the Portuguese counties were organized into 5 groups according to their socioeconomic characteristics (see Figure 2 for a geographical localization of
Figure 1: No. of units sold (all medicines)
Notes: Panel a) reports the number of different medicines that are subjected to medical prescription sold in each year, in bars. In grey, in the same graph, the number of homogeneous groups among which the drugs sold are included is represented. Panel b) reports the number of medicines sold in each year, in total of units, and the proportion of generic and branded products are shown inside each bar.
the counties belonging to each group), using a k-means clustering method, and the coast ones immediately stood out from the interior municipalities, with a special highlight of the counties from the Lisbon and Porto metropolitan areas. (The list of the counties by group can be found in the Appendix). The group number 2 that includes only the counties of Lisbon, Sintra and Vila Nova de Gaia is the one with a higher level of socioeconomic conditions, opposed to the group number 5 that includes 174 counties mainly from the interior of the country where there is a higher percentage of old population, as well as a higher percentage of people with no education or that benefit from the guaranteed minimum income. See Table 3, which shows the relative characterization of the groups.
It can be recognized that the third group is the one with more intermediate values for the majority of the considered variables. On one hand, groups 2 and 4 have a higher average of total resident population, as well as higher population density, higher average basic remuneration by worker and higher percentage of resident population with more education. It is notorious that these are the groups with more “++” signs. On the other hand, these groups oppose the first and fifth ones, which have lower levels of total resident population, lower population density, lower average basic remuneration by worker and higher percentage of population without education. Groups 1 and 5 are also the ones with lower percentage of resident people less than 25 years old but higher percentage of residents more than 64 years old. This division is not straightforward regarding the variables related to the number of pharmacies per resident, the percentage of resident people benefiting from the guaranteed minimum income and the ones enrolled in the Employment and Professional Training Institutes, that works as a proxy for the unemployment rate. Nonetheless, the groups can be ordered by a decreasing level of various socioeconomic
Figure 2: Groups of counties
Notes: This Figure shows the geographical localization of the counties belonging to each group that resulted from the cluster analysis.
indicators as follows: 2>4>3>1>5.
Although medicines for the cardiovascular system, nervous system and alimentary tract are the ones more bought (see the correspondence between the first level of the ATC code and the organ or system of organs over which the medicines act in the Appendix), there are yet some differences across municipalities (see Figure 3). Lisbon, Sintra and Vila Nova de Gaia, for instance, are the ones where less units of medicines that act in the cardiovascular system (code C) are bought but are where more drugs for the respiratory system (code R) are bought, opposed to the counties in the interior. Therefore, some medicines sell more in different regions, probably due to the health problems that may vary between counties. The coast counties suffer more from air pollution and indeed seem to be the ones that need more medicines for respiratory diseases.
As it can be seen in part a) of Table 4, the shares of medicines in their respective homoge-neous group are higher for group 2, meaning that this is the group that diversifies less between the available equivalent drugs, as well as the group number 4. On the other hand, the coun-ties from group 5 are the ones that have lower market shares of each equivalent drug, which indicates that more equivalent drugs are bought at the same time.
We can also have an idea of the differences between regions related to the preferences for generic or branded products. In panel b) of Table 4, the average of the shares of all the equivalent generic products for each group of counties is represented. Notice that these shares
Table 3: Characterization of the counties’ groups Socioeconomic variables Groups 1 2 3 4 5 (Big cities from the interior) (Lisbon, Sintra and Vila Nova de Gaia (Coast counties and district capitals) (Metropolitan areas of Lisbon and Oporto) (Counties from the interior) youngpeople – | ++ + – – old people + | – – – ++ total pop – ++ | + – – pharmpc + | – – – ++ minincome – – ++ | – + unemp – – ++ | + – density – ++ | + – – income – ++ | + – – noeduc + – – | – ++ highsch – ++ | + – – acdegree – ++ | + – –
Notes: This Table represents the relative characterization of the groups of counties. The sign “– –” indicates the group of counties with the lowest average value of the respective variable, opposed to the sign “+ +” that indicates the group of municipalities with the highest average value. The vertical bar indicates the intermediate one. In order to create the groups, it was considered annual data on every mentioned variable for each of the 308 Portuguese municipalities between 2013 and 2018, with the exception of the variables noeduc, highsch, and acdegree that were assumed constant over time for each county.
were computed in each homogeneous group and in the table we have only an aggregated mean of all the homogeneous groups, not controlling for the possibility of some counties buying more of one specific type of medicines that can even have more equivalent generic drugs available to choose while others buy more of another type of drugs without many generic substitutes available. However, it is possible to have an idea that the municipalities belonging to group 5 (the group with the lower socioeconomic conditions and less education) are the ones that buy a higher percentage of generic drugs, opposed to the more developed counties. Moreover, it is even possible to see that the generic shares are slightly increasing during the period in analysis, as expected.
Figure 3: Types of drugs bought by groups of counties
Notes: The Figure reports the shares of medicines sold (in units) included in each ATC code, only until the first level. Notice that it identifies the anatomical main group of the medicines, i.e. the system or group of organs over which the medicine acts.
Table 4: Shares of individual drugs and generic drugs as a whole a) Average shares of individual medicines (in their homogeneous group)
Year Groups of counties Average
1 2 3 4 5 2013 10.61% 11.50% 10.91% 11.22% 10.09% 10.86% 2014 9.86% 10.56% 10.11% 10.36% 9.38% 10.05% 2015 9.74% 10.36% 9.93% 10.17% 9.25% 9.89% 2016 9.67% 10.25% 9.89% 10.10% 9.19% 9.82% 2017 9.62% 10.16% 9.83% 10.02% 9.13% 9.75% Average 9.89% 10.55% 10.12% 10.36% 9.40%
b) Average shares of generic drugs (in their homogeneous group)
Year Groups of counties Average
1 2 3 4 5 2013 53.67% 57.49% 55.58% 57.38% 52.47% 55.32% 2014 55.79% 58.95% 57.36% 59.25% 54.67% 57.20% 2015 56.84% 59.67% 58.19% 59.48% 55.81% 58.00% 2016 57.09% 59.38% 58.25% 59.45% 56.36% 58.10% 2017 57.66% 59.54% 58.73% 59.65% 57.09% 58.53% Average 56.21% 59.01% 57.62% 59.04% 55.28%
Notes: Panel a) reports the average share, in units, of the individual medicines sold in each group of counties over the period in analysis. These shares are calculated with respect of the homogeneous group in which the medicines are inserted. Panel b) shows the average share of all the equivalent generic drugs, in units, also computed for each homogeneous group.
4
Econometric analysis
4.1
Changes in individual drug market shares when new equivalent
medicines are introduced
In order to try to understand the changes in the share of each individual drug when a new equiv-alent generic is introduced in the market, a regression was run. It takes the variable drugshare as its dependent variable, representing the share of each medicine in the total sales of its respective homogeneous group, in units, in the considered county and year. Assuming that the shares may vary depending on the fact that the product is a generic or not, the variable generic is included, which is a dummy variable that takes the value 1 if the observed drug is a generic product and 0 otherwise. It was also expected that the medicines with higher prices paid by consumers have lower shares when compared to the other equivalent drugs, and so the unitary out-of-pocket price was computed and introduced in the regression with the logarithm (log(outpocketuni)).1 Because we are only interested in comparing the shares of the equivalent drugs sold, i.e. the drugs that belong to the same homogeneous group, the unitary out-of-pocket price was com-puted as the difference in the price of that specific drug and the price of the equivalent drug with the lowest price in the respective homogeneous group, as previously mentioned, per unit. Moreover, due to the aggregation of the data in counties, it was not possible to distinguish which and how many drug sales were covered by the general or the special reimbursement regimes. However, since the majority of the sales are covered by the general regime (see Table 9 in the Appendix), the analysis was made assuming this regime for all the sales.2So as to allow for some differences in the drug shares between the different regions that are characterized by their socioeconomic variables, these were also included: youngpeople, oldpeople, pharmpc, minin-come, unemp, density, inminin-come, noeduc, highsch and acdegree. Additionally, in order to study the impact of the introduction of new equivalent drugs in the market, two new crucial variables were created as well: the variable newgen identifies the number of new generic drugs in that homogeneous group for that year, and newbrand identifies the number of new branded prod-ucts that entered in that homogeneous group in that period. So as to allow different effects on the market share of generic versus branded drugs sold inside their respective homogeneous group and county, these last two variables were also crossed with the dummy variable generic. Therefore, the first estimated regression is the following:
1The variable outpocketuni is introduced in the regression with the logarithm in order to simplify the
interpreta-tion of its coefficient. In this way, the obtained coefficient is a semi-elasticity. Therefore, the interpretainterpreta-tion should be that an increase in the price paid by patients of 1% will lead to an increase (or decrease, in the case of a negative sign) of the drug share of X/100 units. Since we are considering the share, which is a number between 0 and 1 (or a percentage) its unit is the percentage point (p.p.).
drugsharem,c,t= β0+β1genericm+β2log(out pocketuni)m,c,t+β3newgeng,t+β4newbrandg,t+ + β5newgeng,t× genericm+ β6newbrandg,t× genericm+ β Xc,t+ αZc+ εm,c,t (1) where the vector X represents all the socioeconomic variables that change across time and Z represents the variables related to education (remember that they were assumed as constant). Regarding the components, m identifies each medicine, g identifies the homogeneous group, t relates to the year and c identifies the county. Remark that the variables drugshare, generic and outpocketuni do not have the component g that identifies the homogeneous group, since one specific drug can only be part of one group. Therefore, each medicine m is immediately identified by the matching homogeneous group.
Notice that a positive coefficient indicates that the variable contributes to a higher share of each medicine m sold in the total sales of its respective homogeneous group g, in units, in the considered county c and period t. On one hand, if the obtained coefficient β1is positive (the one associated with the dummy variable generic), it means that the share of each individual generic drug is greater than the one for a branded-name product, on average, considering everything else constant. Similarly, if a positive β2is obtained, it means that the higher the unitary out-of-pocket price, the higher the expected share of the individual medicine, on average, ceteris paribus. Re-garding the coefficient on the generic variable, no information is known until now that allows to predict its sign but, as previously mentioned, it is expected that a higher price leads to a lower drug share, since people usually respond to higher prices with lower quantities demanded, thus it is expected a negative coefficient associated with the variable log(out pocketuni). Addition-ally, the coefficient on newgen, β3, is expected to be negative, indicating that the shares of the branded products sold tend to reduce when new equivalent generic drugs are introduced. Sim-ilarly, the sum of β3 and β5 is also expected to be negative, with the value of β5 reinforcing the effect of β3, since one more equivalent generic drug in the market is expected to reduce the individual shares of the other generic drugs already existent, even more than the reduction in the individual shares of the brand medicines. Likewise, the coefficients β4and β6, associated with the effects of the introduction of new equivalent brand medicines, are expected to be negative too. However, it is worth mentioning that it is not very common for new equivalent brand drugs to appear in the market after the patent expiration of other brand products already established in the market and, consequently, the coefficients may not be statistically significative.
Finally, regarding the socioeconomic variables included, a positive coefficient will also represent that the higher the value of each variable, the higher will be the individual share of each drug, in the correspondent homogeneous group, county and year. In that way, a positive coefficient associated with the variable unemp, for instance, means that people from a county characterized by a higher proportion of adult people enrolled in Employment and Professional Training Institute, i.e. with more unemployment, tend to diversify less the medicines bought
when compared to resident people in a county with lower unemployment, since higher drug shares is only possible to obtain when less medicines are sold. Thus, the coefficients associated with each of the socioeconomic variables will allow us to identify if those characteristics can be associated with a higher or lower degree of diversity.
It is expected that the counties with a higher percentage of young people are more avail-able to diversify, opposed to those with a higher percentage of old people. Similarly, the higher the number of pharmacies per resident as well as the higher the population density, the higher the diversity is expected to be, resulting in lower shares. Additionally, it is expected that peo-ple that benefit from the guaranteed minimum income or unemployed are more available to try different medicines and thus diversify more, opposed to the ones with higher income, thus leading to negative coefficients associated with variables minincome and unemp but a positive one associated with income. People with higher education are usually more informed about the equivalence of generic drugs and so the coefficients associated with highsch and acdegree are expected to be negative, indicating that the drugs shares are low for counties with higher levels of education, contrasting to the coefficient on noeduc that is expected to be positive for the opposed reason.
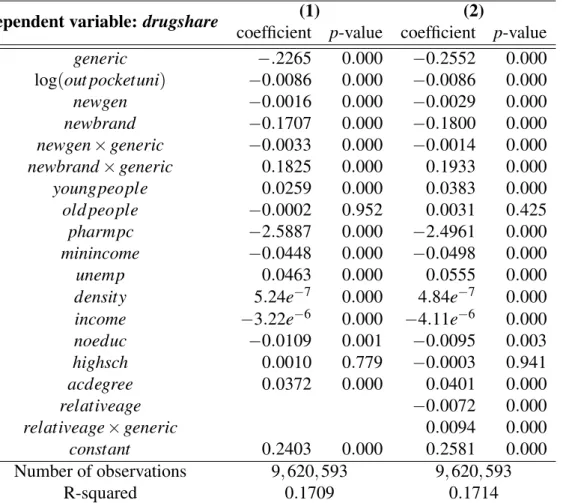
The coefficients obtained are shown in the first columns of Table 5. Table 5: Outputs from equations (1) and (2)
Dependent variable: drugshare (1) (2)
coefficient p-value coefficient p-value
generic −.2265 0.000 −0.2552 0.000 log(out pocketuni) −0.0086 0.000 −0.0086 0.000 newgen −0.0016 0.000 −0.0029 0.000 newbrand −0.1707 0.000 −0.1800 0.000 newgen× generic −0.0033 0.000 −0.0014 0.000 newbrand× generic 0.1825 0.000 0.1933 0.000 youngpeople 0.0259 0.000 0.0383 0.000 old people −0.0002 0.952 0.0031 0.425 pharmpc −2.5887 0.000 −2.4961 0.000 minincome −0.0448 0.000 −0.0498 0.000 unemp 0.0463 0.000 0.0555 0.000
density 5.24e−7 0.000 4.84e−7 0.000
income −3.22e−6 0.000 −4.11e−6 0.000
noeduc −0.0109 0.001 −0.0095 0.003 highsch 0.0010 0.779 −0.0003 0.941 acdegree 0.0372 0.000 0.0401 0.000 relativeage −0.0072 0.000 relativeage× generic 0.0094 0.000 constant 0.2403 0.000 0.2581 0.000 Number of observations 9, 620, 593 9, 620, 593 R-squared 0.1709 0.1714
Notes: The Table shows the obtained coefficients and p-values for regressions (1) and (2), run using the OLS estimators and assuming the general reimbursement regimes for all the sales.
The shares of generic products are smaller by, on average, 0.2265 p.p than the shares of the equivalent branded medicines, as shown by the coefficient associated with the dummy variable generic (β1). This may happen due to two main reasons: there are more generic drugs in each homogeneous group, on average, and so the individual share of each one is smaller, but it is also possible that people buy more branded products in total. In fact, the average number of generic drugs in each homogeneous group is 8.7, whereas the average number of brand-name drugs is 1.7. Nevertheless, the last hypothesis is not supported by the descriptive statistics presented before (see panel b) of Table 4 in the previous section), so it was concluded that, the lower shares of the generic drugs has to do with the higher availability of generic equivalent products. Also, as expected, as the out-of-pocket price increases by 1%, it is estimated that the share of the product decreases by 0.000086 p.p., on average. Thus, the higher the price, the lower the share of the product, but by a small amount.
The diversification between equivalent medicines may arise in part from the consumers’ habits but also from the availability of different drugs in each region. Despite the pharmacies having to provide access to at least three of the five equivalent generic drugs, if there are more pharmacies in a county there may also be available different generics, since each pharmacy could provide different equivalent generic products, from different producers. Actually, the coefficient on the variable pharmpc is negative, meaning that the more pharmacies per resident tend to lead to lower shares of each drug, which supports this idea.
Notice, however, that the counties with a higher percentage of people benefiting from the guaranteed minimum income have lower shares of each individual medicine, considering ev-erything else constant, since the coefficient on minincome is negative, which means that people tend to diversify more between the equivalent drugs. What is unexpected is the fact that the coefficient on income is also negative, meaning that the counties with people receiving a higher income also tend to diversify, not being loyal to one specific brand. Regarding the education level, it is interesting to see that people with an academic degree seem to be more loyal to the same drugs, not allowing for a great diversity, since the shares tend to be lower when compared to people without any education: note that the coefficient on acdegree is positive, whereas the one associated with noeduc is negative meaning that people with no education tend to buy less units of the same equivalent medicine, opposed to the expected results. It was also estimated that, ceteris paribus, the counties in which there is a higher percentage of young people, a higher percentage of unemployed people or even the ones with a higher population density are the ones in which the individual drug shares are higher, meaning that these tend to be loyal to the same medicines, without diversifying contrarily to the expected hypothesis.
Besides these regional preferences, let us then focus on what happens to the shares when new equivalent drugs are introduced in the market: it is estimated that when a new equivalent generic medicine is introduced, the share of all the other (equivalent) drugs decreases, with the share of the generic drugs decreasing more 0.0033 p.p. than the shares of branded drugs (see coefficients β3 and β5 in the second column of Table 5). On the other hand, in the case of
an introduction of a new equivalent branded product (like the situation in which another brand produces an identical product to one already in the market), the shares of the branded medicines are expected to decrease even more than when it was a new generic drug entering the market (they are expected to decrease by 0.1707 p.p. when a new branded product enters the market, but decrease only 0.0016 p.p. when the entering product is a generic one). Notwithstanding, a new branded drug is expected to increase the shares of the generic products by, on average, 0.0117! This is an unpredicted but curious result! However, it is worth mentioning that the introduction of a non-generic product in an already existent homogeneous group is not very common since, usually, the branded products are the first ones to be developed and commercialized and only after the patent expiration new equivalent generic products appear in the market, thus leading to the creation of the homogeneous group.
The R-squared of this regression is not really high, but it must be considered that there are many other variables that certainly explain the shares of medicines and are not considered in the equation. Examples of these possible features are hereditary factors that may contribute to a necessity to certain medicines, consumers aversion to generic drugs or even previous al-lergic reactions of some active substances included in drugs. These are factors that can only be exploited if individual data is available, which is not the case in this study, but they were assumed as uncorrelated with the main variables included in the regression. This might be an unrealistic assumption, but it is what was possible with the available data. Notice, however, that these aspects not covered in the regression will be included in the error term, εm,c,t. Note also that only two socioeconomic variables seem to be non-statistically significant: oldpeople and highsch, which means that they do not seem to explain the dependent variable drugshare.
4.2
The market share of each individual drug as time passes by
The literature has already shown that there is a certain aversion to the consumption of generic products in detriment of branded drugs. However, many governments are trying to solve this problem by applying some new policies and even advertisement campaigns that may lead to a lower aversion from consumers. Specifically in Portugal, some measures have been taken, such as the previously mentioned requirement that the medical prescriptions must be done using the NII instead of the brand of the medicine, which can be considered as part of a nudge technique that tries to influence consumers’ behavior without forbidding brand drugs, or the requirement that pharmacies have available at least three of the five generic products with the lowest prices of their respective homogeneous group, as an attempt to guarantee that generic products are available. Additionally, the INFARMED has been practicing some marketing and information campaigns in order to contribute to a well-informed society. But are these measures having a positive effect? In order to test if the measures that promote generic drugs have been effective, one more variable was created and included in the previous model: relativeage. This variable identifies the age of the medicine starting at 2012, i.e. it takes the value 1 in the first period of
the sample with positive sales and after that it sums one as one more year passes by. This is just a simple way of controlling for what happen as time passes, from the moment when the drug first appears in the database onwards. So as to allow different effects on the share of generic versus branded drugs, it was also crossed with the dummy variable generic and, if policies are having positive effects, it is expected a negative sign on β7but a positive and greater one on β8. Therefore, the estimated regression now is the following:
drugsharem,c,t= β0+β1genericm+β2log(out pocketuni)m,c,t+β3newgeng,t+β4newbrandg,t+ + β5newgeng,t× genericm+ β6newbrandg,t× genericm+
+ β7relativeagem,t+ β8relativeagem,t× genericm+ β Xc,t+ αZc+ εm,c,t (2) As previously mentioned, the vector X represents all the socioeconomic variables that change across time, and Z represents the variables related to education (they were assumed as constant over time). The components are also the same as in the previous regression.
The R-squared increased slightly, but the difference is not that significant. Nonetheless, the coefficients obtained (see Table 5) are very similar to the previous regression without the two new variables. Hence, one can easily see that, everything else constant, the shares of the generic and non-generic drugs tend to change in different directions: branded products tend to have lower shares over the years, while the generic products tend to see their shares increase over time. Moreover, we estimate that one more year makes generic shares increase by 0.0022 p.p., on average, while the branded product shares tend to decrease by 0.0072 p.p. as one more year passes by, on average. Thus, the decrease of the non-generic product shares is higher in absolute value than the increase in the generic drug shares.
Therefore, one can conclude that the policies and measures that have been implemented seem to be effective, since the predictions about the coefficient signs were verified. Thus, as time passes by it can be observed an increase on generic drugs shares and a decrease on the shares of non-generic products, ceteris paribus.
4.3
The market shares of all the equivalent generic drugs
The previous regressions allow us to understand what happens to the consumption of each individual drug, being it a generic product or not, when there are some changes in selected socioeconomic variables, the drug’s prices and even some changes in the composition of the homogeneous group. It also allows us to identify some consumer’s preferences over the same medicines or their availability to diversify. However, if we are talking about equivalent drugs and the focus is the share of generic products as a whole, we should actually try to understand what happens to their aggregated shares in the respective homogeneous group. It was seen that generic drugs tend to have lower shares than the non-generic ones, but is it true that the share of all the equivalent generic drugs is smaller than the share of the branded products? In order
to answer this question, no econometric regression is needed. Computing the average of the generics’ share in each homogeneous group we get a value of 56,2%, which means that for the competitive drug market where substitutes are available, the generic drugs have a higher share than the branded ones. But how does it change when new medicines are introduced in the homogeneous group? A new econometric regression was estimated in order to answer this question that also helps us to understand consumer’s preferences over generic drugs:
genericshareg,c,t= β0+ β1genericpropg,t+ β2newgeng,t+ 13
∑
k=3
βkDk,g+ β Xc,t+ αZc+ εg,c,t (3) Similarly to the previous equations, the vector X represents all the socioeconomic vari-ables that change across time, and Z represents the varivari-ables related to education (assumed as constant over time). Once again, the components are the same.
The dependent variable is now the share of all the generic drugs in their respective homo-geneous group g, in period t and for the county c. The regressors included are the previous so-cioeconomic variables, the number of new generic drugs introduced in the homogeneous group gin period t (newgen), a new variable named genericprop that represents the proportion of the generic products that exist in the homogeneous group g at time t, and some dummy variables that identify the ATC code (until the first level) of the observed homogeneous group g. This said, we are now looking just at the homogeneous group level, and not taking into consideration the individual medicines that belong to it, so it is as if we have now a more general overview of the market.
Notice that a positive coefficient associated with the genericprop is expected, since more equivalent generic drugs available should also lead to a higher percentage of generic drugs sold, as a whole. However, the coefficient on the variable newgen must be interpreted very carefully: in order for us to interpret it directly, using a ceteris paribus analysis, we should consider that the proportion of generic drugs in the respective homogeneous group should remain unchanged, since the variable genericprop is also included in the regression. Therefore, a positive coefficient on the variable newgen means that adding one more generic drug in one homogeneous group while adding the correspondent proportion of branded medicines such that the proportion of generic ones does not change, the total share of generic drugs sold will increase, and so the generic drugs will capture a higher proportion of the market.
Additionally, positive coefficients associated with a socioeconomic variable will now mean that the higher its value is, the higher the consumption of generic drugs will be. For instance, a positive coefficient associated with the variable unemp means that, ceteris paribus, the counties with higher levels of unemployment seem to be the ones with a higher preference for generic drugs. Thus, it is expected a positive coefficient associated with the variable young-people, opposing the one associated with oldyoung-people, since the elder tend to be more reluctant to changes of habits. The counties with a higher number of pharmacies per resident are also
ex-pected to have a higher share of all the equivalent generic drugs since more equivalent generic drugs will be available and so it is expected a positive coefficient on pharmpc. Since people with high education levels are usually more informed, the coefficients on highsch and acdegree are expected to be positive too. Contrarily to these, the coefficient on noeduc is expected to be negative for the opposite reason, as well as the one associated with the variable income, due to the fact that people with high income may prefer to continue using the same brand-name prod-ucts and be more reluctant to change. Counties with a higher percentage of unemployed people and higher percentage of people benefiting from the guaranteed minimum income are expected to buy more generics and so the coefficients associated with unemp and minincome will be pos-itive. Similarly, due to the easier spread of information where the population density is higher, it is expected a positive coefficient on density, too. Finally, the dummy variables that identify the first level of the ATC code will allow us to see if there are some significant differences in the consumers’ preferences for generic drugs depending on the organ or system of organs over which the medicines act.
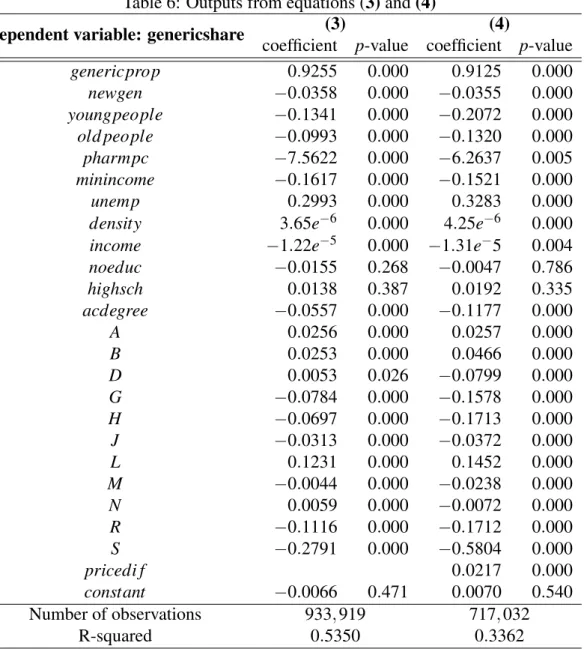
The obtained coefficients are shown in the first columns of Table 6.
Regarding the socioeconomic factors considered, it is interesting to see that the higher the average income in the municipality, the lower the generic share, probably indicating that people with a higher income are more willing to pay a higher price and buy the branded product. On the other hand, the higher the percentage of unemployment in the county, the higher the generic consumption as well, but the more percentage of people that benefit from the guaranteed minimum income, the lower the generic shares, which is an unexpected result since it seems to go against the obtained coefficient on the income.
It was also expected the people with higher levels of education, who are well-informed about the equivalence and availability of the generic products, would be the ones that could buy more generics. However, the coefficient on acdegree is negative, which supports the opposite and contradicts the previous literature (see Dylst et al., 2013; Quintal and Mendes, 2012 and Vallès et al., 2003). This seems to be a situation in which the correlation between income and level of education is very high (note that the correlation between these two variables – income and acdegree – is about 0.66), leading to unexpected results, as previously argued. Furthermore, there seems not to be significant differences in the preferences for generic drugs between people of different ages, with the coefficients associated with the percentage of young and old people being both negatives. The coefficient on density confirms that the counties with higher population density have higher preferences for generic drugs as expected, since a positive coefficient was obtained, but it was curious to find a negative coefficient associated with the variable pharmpc, which contradicts the prediction that more pharmacies would lead to higher shares of the generic drugs in total.
Particularly interesting are the results obtained for the variables related to the composition of the homogeneous group. The coefficient on genericprop indicates that as the percentage of generic drugs existent in the homogeneous group increases by 1 p.p., the generics share is
esti-Table 6: Outputs from equations (3) and (4)
Dependent variable: genericshare (3) (4)
coefficient p-value coefficient p-value
genericprop 0.9255 0.000 0.9125 0.000 newgen −0.0358 0.000 −0.0355 0.000 youngpeople −0.1341 0.000 −0.2072 0.000 old people −0.0993 0.000 −0.1320 0.000 pharmpc −7.5622 0.000 −6.2637 0.005 minincome −0.1617 0.000 −0.1521 0.000 unemp 0.2993 0.000 0.3283 0.000
density 3.65e−6 0.000 4.25e−6 0.000
income −1.22e−5 0.000 −1.31e−5 0.004
noeduc −0.0155 0.268 −0.0047 0.786 highsch 0.0138 0.387 0.0192 0.335 acdegree −0.0557 0.000 −0.1177 0.000 A 0.0256 0.000 0.0257 0.000 B 0.0253 0.000 0.0466 0.000 D 0.0053 0.026 −0.0799 0.000 G −0.0784 0.000 −0.1578 0.000 H −0.0697 0.000 −0.1713 0.000 J −0.0313 0.000 −0.0372 0.000 L 0.1231 0.000 0.1452 0.000 M −0.0044 0.000 −0.0238 0.000 N 0.0059 0.000 −0.0072 0.000 R −0.1116 0.000 −0.1712 0.000 S −0.2791 0.000 −0.5804 0.000 pricedi f 0.0217 0.000 constant −0.0066 0.471 0.0070 0.540 Number of observations 933, 919 717, 032 R-squared 0.5350 0.3362
Notes: This Table shows the results obtained with regressions (3) and (4), using the OLS estimators. For the calculation of the variable pricedif in regression (4), it was assumed that all medicines were covered by the general reimbursement regime. The dummy variables A to S represent the first level of the ATC code, with category C being the base level. See Table 7 in the Appendix for the correspondence between the ATC code and the group of organs that they represent. The number of observations in equation (4) is smaller than in the previous regression because for some homogeneous groups only generic products or only branded drugs were sold. As a consequence, it is not possible to compute the variable pricedif for those observations and they were excluded.
mated to increase by, on average, 0.9255 p.p., as it was expected, supporting the hypothesis that the more generic products available, the higher the generics share. However, as previously men-tioned, one should interpret the coefficient on newgen very carefully. This coefficient is negative (−0.0358) which means that, ceteris paribus, one more generic drug leads to a decrease in the generics share. Nevertheless, note that it is true only if we consider that all the other variables remain constant. Thus, in order for the proportion of the generics in the homogeneous group to remain constant when one more generic product is introduced, we need to be introducing the same proportion of branded products. Consequently, that coefficient indicates that as we introduce one more generic drug in the homogeneous group while introducing at the same time the equivalent proportion of non-generic products, the share of all generic products is expected to decrease by, on average, 0.0358 p.p.. As previously mentioned, it is not very common that new branded products enter the market in a homogeneous group that already exists. However, this regression allows us to see that if we introduce the same proportion of generic and branded products, the last ones will immediately capture a higher share of the market.
The dummy variables that allow to identify the organ or system of the human body over which the medicines react allow us to identify that there are in fact some differences in the utilization of generic groups depending on the type of medicine. The group used as the reference group is the ATC C, that includes the medicines that act in the cardiovascular system, since it is the group that represents the highest portion of all the medicines sold in Portugal, in units, as seen in Figure 3. Therefore, the coefficients on each dummy variable supports the hypothesis that the generic consumption is higher when we consider some ATC groups, such as group L, A and B, that include antineoplastic and immunomodulating agents, medicines for the alimentary tract and metabolism and for the blood and blood forming organs, respectively. On the other hand, the medicines included in groups S and R are the ones with a lower share of generics, which include medicines for the sensory organs and respiratory system, respectively. Crossing these coefficients with the descriptive statistics table presented before (see Figure 3 again), it is also possible to conclude that the medicines that have less sales are not necessarily the ones with the lowest generic sales, since the ones belonging to group L (antineoplastic and immunomodulating agents) are some with the highest share in terms of generic products but they are also the second group with lower sales in total. On the opposite side, the drugs included in group R, for instance, form the fourth group with more sales in the market, but this is one of the groups with lower share of generic products sold.
4.4
Including price differences
With the previous regression it was possible to have a wider perspective of the generics share inside each homogeneous group. However, the difference in the price paid by consumers when buying a generic or a non-generic drug is not being taken into consideration, but it may differ from one homogeneous group to others. Furthermore, previous researchers considered the price