Characterization of the
potential reactivity to
alkalis of Portuguese
aggregates for
concrete
Violeta Isabel Monteiro Ramos
Plano Doutoral em GeociênciasDepartamento de Geociências, Ambiente e Ordenamento do Território 2013
Orientador
Maria Isabel Gonçalves Fernandes, Professora Auxiliar Faculdade de Ciências da Universidade do Porto
Coorientador
Fernando Manuel Pereira de Noronha, Professor Catedrático Faculdade de Ciências da Universidade do Porto
Characterization of the potential reactivity to alkalis of Portuguese aggregates for concrete
Acknowledgements
The accomplishment of this thesis would not be possible without the contribution of many people. To those, I express my immense gratitude being aware that the following words will not suffice to truly thank them.
First and foremost, I am extremely grateful to my supervisor Doctor Isabel Fernandes who patiently provided all the necessary knowledge and encouragement for me to complete my dissertation. I feel honored to be her first PhD student.
I am also greatly indebted to my co-supervisor Professor Fernando Noronha for his invaluable insights, suggestions and guidance.
To the Department of Geosciences, Environment and Spatial Planning of Faculty of Sciences of the University of Porto, namely its President Professor Deolinda Flores, for providing the facilities and the access to investigation equipment.
To the Centre of Geology of the University of Porto, and once again to Professor Fernando Noronha as its President, for granting all the needed support for the development of this work.
My gratitude to Doctor António Santos Silva, as the responsible for Project IMPROVE, for all the support granted concerning laboratory tests.
To all the owners and workers of aggregates’ quarries who kindly provided the materials for this investigation. A special thank you to Doctor João Baptista for facilitating the contacts with aggregate producers of Madeira Archipelago.
To Dora Soares from “Laboratório Nacional de Engenharia Civil” for performing laboratory tests and for the backup during the whole process.
Doctor Maria dos Anjos Ribeiro and Doctor Helena Brites Martins for their kind assistance when doubts rose on igneous rocks and minerals.
Doctor Tetsuya Katayama for kindly assisting with his experience in the examination of volcanic aggregates.
Cândida Garcia Neto for performing all chemical tests.
Characterization of the potential reactivity to alkalis of Portuguese aggregates for concrete
Daniela Silva from “Centro de Materiais da Universidade do Porto” for performing SEM-EDS analyses.
Engineer Fernanda Guimarães from “Laboratório Nacional de Engenharia Civil” for SEM-WDS analyses.
The Faculty of Sciences of the University of Lisbon, namely Doctor Isabel Moitinho, for generously offering the facilities for the preparation of aggregates for laboratory tests. Romeu Vieira for his priceless help and companionship during the collection of aggregates in Madeira and Porto Santo Islands under dramatic circumstances for Madeira Archipelago. Filipa Pinheiro and Milene Raimundo for their contribution in the preparation of endless quantities of aggregates for laboratory tests.
Sara Leal for all the priceless help provided in the final phase of this thesis. Maria José Coelho for the final revision of the text.
António Silva for his great contribution in the sampling of aggregates and tests preparation, and also for his friendship.
My friends and colleagues who share with me the love for Geology and that somehow made part of this journey: Alexandra Frias, Alexandra Pinho, Anabela Costa, Andreia Rodrigues, Dilma Lima, Heloísa Corrêa-Ribeiro, Joana Ribeiro, Magda Roque, Maria Areias, Maria João Fontoura, Miguel Oliveira, Mónica Sousa, Nélia Castro, Nuno Durães, Patrícia Santos, Paula Gonçalves, Pedro Correia, Sandra Rodrigues, Sílvia Aires and Tânia Martins. Thank you for all the friendship, encouragement and great times spent. A special thank you to Joana Ribeiro for the amazing help with formatting all text in this thesis.
All my friends for being a constant and supportive presence in my life.
My thank you to all who contributed to this work and that I might have forgotten to refer. All my big family for the unconditional encouragement. A special thank you to my aunt Fátima Monteiro for always being there. My parents, sister and nephew for their love, patience and all the support on pursuing my dreams.
Lastly to Fundação para a Ciência e Tecnologia (FCT) for the financial support concerning my PhD scholarship (Ref: SFRH/BD/47893/2008) and Project IMPROVE (Ref: PTDC/ECM/115486/2009).
Characterization of the potential reactivity to alkalis of Portuguese aggregates for concrete
Abstract
Concrete is sometimes regarded as a synonym of progress, resistance and durability. Still, this material is not immune to deterioration which affects its performance, ultimately leading to a loss of serviceability of structures. Among the various pathologies that can affect concrete is the alkali-aggregate reaction, which results from the chemical reaction between alkalis in the cement and reactive minerals present in aggregates.
In Portugal, the alkali-aggregate reaction was recognized in structures in the beginning of the 1990’s and since then a lot of work has been carried out in order to study the components of concrete but also to repair the affected structures, when possible, and prevent the occurrence of this pathology.
As part of a major project (Project IMPROVE), the work developed in this thesis focus on the prevention of alkali-aggregate reaction by investigating fourteen Portuguese aggregates that are currently being exploited for concrete purposes, namely granitic, volcanic and carbonate rocks. The aggregates were characterized by polarizing microscopy, complemented with several techniques, such as chemical analysis, scanning-electron microscopy, electron-probe micro-analysis, X-ray diffraction and phosphoric acid method. Expansion tests were performed by producing mortar-bars and concrete prisms with the aggregates and exposing the specimens to various environmental conditions in order to determine the potential reactivity of the different rock types.
While the petrographic examination revealed the presence of potential deleterious materials in various aggregates, the expansion tests allowed confirming or discarding the possibility of these constituents to trigger alkali-aggregate reaction. The results were plotted in comparison charts in order to find which method best fits the petrographic conclusions and also to define which of the accelerated tests seems to correlate with field performance. The results obtained will be useful in predicting the field performance of concrete in accordance to international and national recommendations and specifications.
Characterization of the potential reactivity to alkalis of Portuguese aggregates for concrete
Resumo
O betão é, muitas vezes, considerado um sinónimo de progresso, resistência e durabilidade. No entanto, este material não é imune a deterioração, a qual afecta o seu desempenho em obra, levando, em último caso, a uma diminuição da vida útil das estruturas. Entre as diferentes patologias que podem afectar o betão encontra-se a reacção álcalis-agregado, a qual resulta da reacção química entre os álcalis do cimento e minerais reactivos presentes nos agregados.
Em Portugal, a reacção álcalis-agregado foi reconhecida em estruturas no início da década de 90 do século passado, e desde aí um grande volume de trabalho tem vindo a ser desenvolvido com o objectivo de estudar os componentes do betão e também, quando possível, reparar as estruturas afectadas e prevenir a ocorrência desta patologia.
Como parte de um projecto mais abrangente (Projeto IMPROVE), o trabalho desenvolvido no âmbito desta tese foca-se na prevenção da reacção álcalis-agregado através da investigação de catorze agregados portugueses, nomeadamente rochas graníticas, vulcânicas e carbonatadas, que atualmente se encontram a ser explorados para serem utilizados no fabrico de betão. A caracterização dos agregados foi realizada ao microscópio polarizante e complementada com diversas técnicas, tais como análise química, microscopia electrónica de varrimento, microssonda eletrónica, difração de raios-X e método do ácido fosfórico. Foram realizados ensaios de expansão através da produção de barras de argamassa e prismas de betão com os agregados investigados, expondo os provetes a várias condições ambientais com o objectivo de determinar a reatividade potencial dos diferentes tipos de rochas.
Enquanto o exame petrográfico revelou a presença de componentes potencialmente reativos em vários agregados, os ensaios de expansão permitiram confirmar ou descartar a possibilidade destes constituintes desencadearem a reacção álcalis-agregado. Os resultados foram projetados em gráficos comparativos com as finalidades de avaliar qual o ensaio que melhor se coaduna às conclusões do exame petrográfico e de definir qual dos ensaios acelerados se correlaciona com o desempenho em obra. Os resultados obtidos serão úteis na previsão do desempenho em obra dos agregados e do betão de acordo com recomendações e especificações nacionais.
Characterization of the potential reactivity to alkalis of Portuguese aggregates for concrete
Contents
Acknowledgements Abstract Resumo Contents List of figures List of tablesList of acronyms and abbreviations
iii v vii ix xiii xxvii xxxi Chapter 1 – Introduction 1.1 Subject 1.2 Objectives
1.3 Organization of the thesis
1
3 5 6
Chapter 2 – Alkali-aggregate reaction
2.1 Overview
2.2 Key parameters controlling ASR 2.2.1 Reactive minerals
2.2.1.1 “Pessimum” content
2.2.1.2 Grading, size, shape and time 2.2.2 Sources of alkalis
2.2.2.1 Alkalis and pH in the cement 2.2.2.2 Sufficient alkalis
2.2.2.3 Alkalis release from aggregates 2.2.3 Moisture
2.2.4 Other parameters controlling ASR 2.2.4 2.3 Mechanisms of ASR
2.3.1 Alkali-silica gel formation
2.3.2 Alkali-silica gel structure and composition 2.3.3 Expansion and cracking mechanisms 2.3.4 Gel composition v.s. expansibility 2.4 Recognising ASR in a concrete structure
2.4.1 ASR external concrete features 2.4.1.1 Cracking
2.4.1.2 Movements, displacements and deformations 2.4.1.3 Surface deposits (exudations v.s. efflorescence) 2.4.1.4 Pop-outs 2.4.2 Laboratory investigation 2.4.2.1 Petrographic examination Microcracks Reaction rims Gel
Cement paste-aggregate bond
2.4.2.2 The Damaging Rating Index
9 11 12 13 17 19 21 22 24 26 29 32 34 34 40 43 45 47 49 49 51 52 53 55 56 59 61 61 64 64
Chapter 3 – Alkali-silica reaction in Portugal
3.1 Historical background 3.2 National recommendations 3.3 Case studies 3.4 Project IMPROVE 67 69 72 76 81
Chapter 4 – Materials and methods
4.1 Materials
4.1.1 Geotectonic and geological setting of Portugal
83
85 85
Characterization of the potential reactivity to alkalis of Portuguese aggregates for concrete
4.1.1.1 The Portuguese Mainland 4.1.1.2 The Madeira Archipelago 4.1.2 Selected aggregates 4.2 Methods
4.2.1 Applied methodology
4.2.1.1 Petrographic examination method (RILEM AAR-1.1) 4.2.1.2 Supplementary techniques to petrography
Chemical analysis of whole-rock composition
Scanning electron microscopy (SEM) and microanalysis Phosphoric acid method
X-ray diffraction (XRD)
4.2.1.3 Expansion tests
Screening test: Accelerated mortar-bar test at 80ºC (ASTM C 1260) Screening test: Carbonate aggregate testing (RILEM AAR-5) Performance test: Accelerated concrete prism test at 60ºC (RILEM AAR-4.1)
Performance test: Concrete prism test at 38ºC (RILEM AAR-3)
4.2.1.4 Additional tests
Chemical method (ASTM C 289) Modified chemical method
4.3 Methodologies’ main advantages and disadvantages
85 87 88 91 95 96 100 100 101 103 104 105 105 108 111 113 115 115 118 119
Chapter 5 – Characterization of granitic aggregates
5.1 Overview 5.2 Materials
Geotectonic and geological setting of selected granitic aggregates
5.3 Methods
5.3.1 Petrographic characterization 5.3.2 Chemical method
5.3.3 Expansion tests
5.3.4 Post-mortem concrete petrography 5.4 Results
5.4.1 Petrographic examination method 5.4.1.1 Aggregate GR1 5.4.1.2 Aggregate GR2 5.4.1.3 Aggregate GR3 5.4.1.4 Aggregate GR7 5.4.1.5 Aggregate GR17 5.4.1.6 Aggregate GR18 5.4.1.7 Aggregate GR19 5.4.1.8 Aggregate GR20
5.4.2 Classification of the granitic aggregates 5.4.3 Chemical method (ASTM C 289) 5.4.4 Expansion tests
5.4.4.1 Screening tests
Accelerated mortar-bar test at 80ºC (ASTM C 1260)
5.4.4.2 Performance tests
Accelerated concrete prism test at 60ºC (RILEM AAR-4.1) Concrete prism test at 38 ºC (RILEM AAR-3)
5.4.5 Post-mortem concrete petrography 5.4.5.1 Aggregate GR1 5.4.5.2 Aggregate GR2 123 125 127 128 130 131 133 133 134 134 134 136 142 148 154 160 166 172 178 184 185 186 186 186 188 188 190 192 193 196
Characterization of the potential reactivity to alkalis of Portuguese aggregates for concrete
5.4.5.3 Aggregate GR3 5.5 Discussion
201 204
Chapter 6 – Characterization of volcanic aggregates
6.1 Overview 6.2 Materials
Geotectonic and geological setting of selected volcanic aggregates
6.3 Methods
6.3.1 Petrographic examination 6.3.2 Chemical method
6.3.3 Expansion tests
6.3.4 Post-mortem concrete petrography 6.4 Results 6.4.1 Petrographic examination 6.4.1.1 Aggregate BS6 Sample BS6hawaiite Sample BS6basalt Sample BS6basanitoid 6.4.1.2 Aggregate BS7 6.4.1.3 Aggregate BS8 6.4.1.4 Aggregate BS9
6.4.2 Chemical method (ASTM C 289) 6.4.3 Expansion tests
6.4.3.1 Screening tests
Accelerated mortar-bar test at 80ºC (ASTM C 1260)
6.4.3.2 Performance tests
Accelerated concrete prism test at 60ºC (RILEM AAR-4.1) Concrete prism test at 38ºC (RILEM AAR-3)
6.4.3 Post-mortem concrete petrography 6.4.3.1 Aggregate BS6 6.4.3.2 Aggregate BS8 6.4.3.3 Aggregate BS9 6.5 Discussion 221 223 227 228 231 231 234 234 235 236 236 241 241 250 257 268 278 286 295 296 296 296 297 297 298 299 300 301 302 305
Chapter 7 – Characterization of carbonate aggregates
7.1 Overview 7.2 Materials
Geological setting of the selected carbonate aggregates
7.3 Methods
7.3.1 Petrographic characterization 7.3.2 Modified chemical method 7.3.3 Expansion tests
7.4 Results
7.4.1 Petrographic characterization 7.4.1.1 Aggregate CL3 7.4.1.2 Aggregate DL2 7.4.2 Modified chemical method 7.4.3 Expansion tests
7.4.3.1 Screening tests
Accelerated mortar-bar test at 80ºC (ASTM C 1260) Carbonate aggregate testing (RILEM AAR-5)
7.4.3.2 Performance tests
Accelerated concrete prism test at 60ºC (RILEM AAR-4.1)
309 311 316 316 318 319 320 320 321 321 322 327 333 335 335 335 336 337 337
Characterization of the potential reactivity to alkalis of Portuguese aggregates for concrete
Concrete prism test at 38ºC (RILEM AAR-3)
7.4.4 Post-mortem concrete petrography 7.5 Discussion
338 339 339
Chapter 8. Overall discussion of laboratory tests
ASTM C 1260 (fourteen days) days v.s. RILEM AAR-4.1 ASTM C 1260 (twenty-eight days) v.s. RILEM AAR-4.1 ASTM C 1260 v.s. RILEM AAR-3
RILEM AAR-3 v.s. RILEM AAR-4.1
343 347 349 352 353
Chapter 9. Conclusions and future research
9.1 Conclusions Granitic aggregates Volcanic aggregates Carbonate aggregates General conclusions 9.2 Future research 357 359 360 361 362 363 364 References 367 Annexes 419
Characterization of the potential reactivity to alkalis of Portuguese aggregates for concrete
List of figures
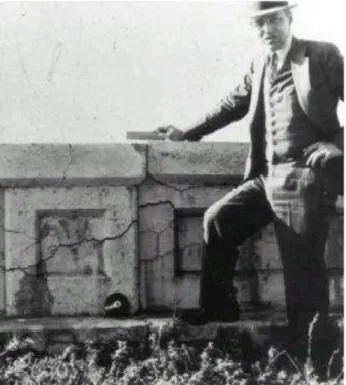
Figure 1 – Thomas Stanton standing next to a wall affected by alkali-aggregate
reaction (http://www.fhwa.dot.gov/pavement/concrete/reactive/issue01.cfm).
Figure 2 – Primary factors influencing alkali-silica reaction in concrete; 1
Supplementary Cementitious Materials (adapted from Zollinger et al., 2009).
Figure 3 – “Pessimum” behaviour of pure siliceous aggregate. Water/cement ratio and
aggregate/cement ratio are 0.4 and 2.75, respectively; 6.0 kg/m3 of Na2Oeq (Hobbs, 1988).
Figure 4 – Alkali metals in the period table of elements (http://www.onlinemathlearning.com/alkali-metals.html).
Figure 5 – Effect of cement alkalinity on ASR. Malmesbury coarse aggregate (greywacke) in combination with different cements. Cement content of concrete = 350 kg/m3. Stored under ASTM C 227 conditions above water in sealed containers at 30ºC. The figures in brackets refer to the total %Na2Oeq of the cement (Oberholster, 1986).
Figure 6 – Effects of alkali content on expansion of concrete prisms stored over water
at 38ºC, leading to the development of an S-shape pattern curve (CSA – Canadian Standard Association) (Folliard et al., 2007).
Figure 7 – Alkalis (as Na2Oeq) per cubic meter of concrete as a function of cement alkali and cement content (Farny and Kosmatka, 1997).
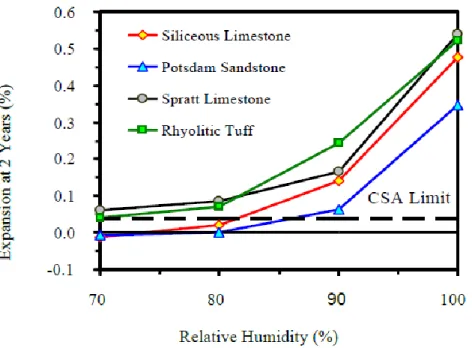
Figure 8 – Effects of relative humidity on expansion of different aggregates using the
ASTM C 1293 (Pedneault, 1996).
Figure 9 – Relative humidity v.s. depth of concrete for pavement in various climates
(California – Mediterranean; Georgia – Humid to subtropical; New Mexico – Semi-arid to arid; South Dakota – Continental) (Stark, 1993).
Figure 10 – Three ways of drawing the silica tetrahedron: a) Left: ball and stick model,
showing the silicon cation in orange surrounded by four oxygen anions in blue; b)
Centre: space-filling model; c) Right: geometric shorthand
(http://www.visionlearning.com/library/module_viewer.php?mid=140).
Figure 11 – Stability fields of the different silica polimorphs (Swamy et al., 1994). Figure 12 – Crystalline (A) and amorphous silica (B) structures (http://people.ce.gatech.edu/~kkurtis/gwillis/tutorials/asr_theory_final.ppt).
Figure 13 – Effect of pH on dissolution of amorphous silica (Tang and Su-Fen in
Zollinger, 2009).
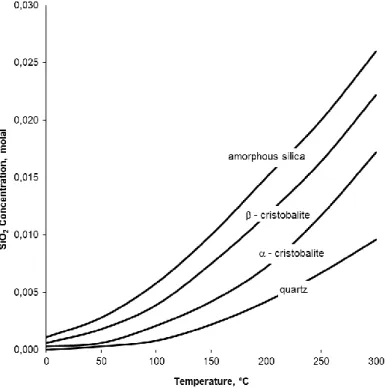
Figure 14 – Solubility of silica polymorphs with temperature based on equations from
Rimstidt and Barnes (1980) (Dove, 1995).
Figure 15 – Alkali-silica reaction process (Deschenes et al., 2009).
Figure 16 – Scheme for preliminary diagnostic examination of concrete structures to
ascertain probable deterioration mechanism (Blight and Alexander, 2011).
Figure 17 – Schema of the progression and consequence of the swelling of the ASR
gel (Hobbs, 1988).
Figure 18 – Map cracking in the crest of a concrete dam.
Figure 19 – Expansion (A) and cracking (B) due to ASR (adapted from Courtier in
Deschenes et al., 2009).
Figure 20 – Misalignments due to AAR in two different dams. Figure 21 – White exudation in a concrete structure.
Figure 22 – Schematic model of pop-out formation (Idorn, 1967). Figure 23 – Pop-out in a concrete structure.
Figure 24 – Internal macrocrack pattern which can be caused by ASR. A) Reactive silica in the sand fraction; B) Reactive silica in the coarse aggregate (BCA, 1992).
11 13 18 22 23 25 25 30 31 34 35 35 37 37 39 48 50 50 51 52 53 53 54 57
Characterization of the potential reactivity to alkalis of Portuguese aggregates for concrete
Figure 25 – Microcracks within an aggregate. (Microphotograph in plane polarized light
(PPL)).
Figure 26 – Sketches displaying texture, morphology and compositions of the primary
alkali susceptible rocks and characteristic patterns when affected by ASR (Idorn et al., 1992).
Figure 27 – Brownish gel filling a void. It is possible to observe microcracks in the matrix responsible for gel infilling (Microphotograph in PPL).
Figure 28 – Alkali-silica gel texture in SEM (secondary electrons imaging mode). Figure 29 – Prepared concrete sample for DRI evaluation.
Figure 30 – Köppen-Geiger climate classification for the Iberian Peninsula and the
Balearic Islands (E – polar climates: ET – tundra; D – cold climates: Dfc – cold with a dry season and fresh Summer; Dfb – cold without dry season and temperate Summer; Dsc – cold with dry and fresh Summer; Dsb – cold with temperate and dry Summer; C – temperate climates: Cfb – temperate with a dry season or hot Summer; Cfa – temperate without a dry season or hot Summer; Csb – temperate with dry and temperate Summer; Csa – temperate with dry and hot Summer; B – dry climates: BSk – cold steppe; BSh – hot steppe; BWk – cold desert; BWh – hot desert) (Atlas Climático Ibérico, 2011).
Figure 31 – Köppen-Geiger climate classification for the Archipelagos of the Azores
and Madeira (E – Polar climates: ET – tundra; D – cold climates: Dsc – cold with dry and fresh Summer; C – temperate climates: Cfc – temperate with no dry season with a short and cool Summer; Cfb – temperate with a dry season and hot Summer; Cfa – temperate without a dry season and hot Summer; Csc – temperate with hot and dry Summer; Csb – temperate with dry and warm Summers; Csa – temperate with dry and cool Summers; B – dry climates: BSk – cold steppe; BSh – hot steppe; BWk – cold desert; BWh – hot desert) (Atlas Climático dos Arquipélagos das Cánarias, da Madeira e dos Açores, 2012).
Figure 32 – Methodology in order to assess aggregate reactivity (LNEC E 461, 2007). Figure 33 – Methodology for assessing the susceptibility of an aggregate or concrete
mixture to develop alkali-silica reactions (LNEC E 461, 2007).
Figure 34 – Portuguese dams affected by ASR (Source: Project IMPROVE).
Figure 35 – Portuguese bridges and viaducts affected by ASR (Source: Project
IMPROVE).
Figure 36 – Geological map of the Portuguese Mainland (http://webcarta.net/carta/mapa.php?id=28974&lg=en).
Figure 37 – Geological map of Madeira Archipelago. The dashed line indicates the
postulated Madeira hotspot track (Schwarz et al., 2005).
Figure 38 – Geographic and geological distribution of IMPROVE’s selected aggregate
quarries in the Portuguese Mainland (Source: Project IMPROVE).
Figure 39 – Geographic and geological distribution of IMPROVE’s selected aggregate
quarries in Madeira and Porto Santo Islands (Source: Project IMPROVE).
Figure 40 – Geographic and geological distribution of IMPROVE’s selected aggregate quarries in Azores Islands (Source: Project IMPROVE).
Figure 41 – Integrated assessment scheme of RILEM’s methodology (RILEM AAR-0,
2013).
Figure 42 – Flow chart for petrographic assessment of aggregate materials to
determine AAR potential according to RILEM AAR-1.1 (2013).
Figure 43 – A) Casting of mortar-bars used in ASTM C 1260; B) Final aspect of
mortar-bars after demoulding.
Figure 44 – Flow chart for AAR assessment of carbonate rocks (RILEM AAR-0, 2013). Figure 45 – Concrete prisms stored over water in a sealing container.
60 61 63 63 65 70 71 75 76 77 80 86 88 89 89 90 95 98 106 110 111
Characterization of the potential reactivity to alkalis of Portuguese aggregates for concrete
Figure 46 – Preparation of concrete prisms for RILEM AAR-3
Figure 47 – Graph illustrating the division between innocuous and deleterious
aggregates in accordance to ASTM C 289 chemical test (adapted from ASTM C 289, 2007 and Fernandes, 2005).
Figure 48 – Plot of Sc v.s. Rc showing the increase in Sc values obtained using the
modified chemical test, comparing the results obtained using ASTM C 289. The arrows show the increase in Sc obtained with the modified test procedure (graph plotted with data from Bérubé and Fournier (1990) in Grattan-Bellew, 2001).
Figure 49 – Geological distribution of Hercynian syn- to post-D3 granitoids in the CIZ,
northern Portugal.
Figure 50 – Hand sample of aggregate GR1.
Figure 51 – Microphotographs of aggregate GR1. Photos A, B, C, D, E, F and G in
cross-polarized light (XPL). Photo H in plane polarized light (PPL). A) Subgrains in a quartz crystal; B) Micrographic quartz in a microcline megacryst; C) Globular quartz in a plagioclase with polysynthetic and Carlsbad twinning; D) Myrmekites in plagioclase crystal neighbouring microcline; E) Cross-hatch and Carlsbad twinning in a perthitic microcline; F) Plagioclase with oscillatory zoning; G) Albitic crown in plagioclase; H) Biotite with inclusions of monazite and zircon.
Figure 51 (cont.) – Microphotographs of aggregate GR1. Photos I and J in XPL.
Photos K, L, M, N, O and P in PPL. I) Symplectic fringes of muscovite and vermicular quartz in plagioclase; J) Plagioclase altered into microcrystalline muscovite; K) Prismatic zircon included in plagioclase; L) Apatite, opaque minerals and zircon inclusions in biotite; M) Leucoxene filling cleavage planes in muscovitized biotite; N) Fibrolite needles in association with biotite; O) Fluorite crystal; P) Rutile needles in partially chloritized biotite.
Figure 52 – Aggregate GR1. Classes of the undulatory extinction angle of the quartz
crystals.
Figure 53 – Aggregate GR1. Boxplot of the undulatory extinction angle of the quartz
crystals.
Figure 54 – Hand sample of aggregate GR2.
Figure 55 – Microphotographs of aggregate GR2. All photos in XPL. A) Chess-board
subgrain pattern in a quartz crystal with irregular boundaries; B) Preferred orientation of elongated quartz crystals with subgraining and recrystallized quartz grains; C) Globular quartz in microcline megacryst; D) Colonies of myrmekites in plagioclase. Polysinthetic twins show tapering edges; E) Parallel preferred orientation of plagioclase inclusions in a microcline megacryst; F) Flame-like perthites in K-feldspar; G) Bent and broken polysynthetic twin planes with tapering edges in plagioclase; H) Microclinitization and muscovitization of an altered plagioclase crystal.
Figure 55 (cont.) – Microphotographs of aggregate GR2. Photos J and K in XPL.
Photos I, L, M, N, O, and P in PPL. I) Deformed biotite; J) Deformed muscovite; K) Bent muscovite crystal; L) Microcracked tourmaline; M) Biotite crystal with abundant zircon inclusions and pleochroic haloes; N) Euhedral apatite crystal with zircon inclusions; O) Leucoxene and opaque minerals along chlorite cleavage planes; P) Rutile needles scattered in chlorite.
Figure 56 – Aggregate GR2. Classes of the undulatory extinction angle of the quartz
crystals.
Figure 57 – Aggregate GR2. Boxplot of the undulatory extinction angle of quartz
crystals.
Figure 58 – Hand sample of aggregate GR3.
113 116 119 130 136 139 140 141 141 142 145 146 147 147 148
Characterization of the potential reactivity to alkalis of Portuguese aggregates for concrete
Figure 59 – Microphotographs of aggregate GR3. Photos B, C, D, E, F, G and H in
XPL. Photo A in PPL. A) Microcrack filled with oxides crossing the essential minerals of aggregate GR3; B) Extinction bands in quartz; C) Reaction texture between quartz and K-feldspar; D) Globular quartz in microcline megacryst; E) Globular quartz in plagioclase; F) Myrmekitised plagioclase; G) Perthitic microcline; H) Microcrystalline muscovite in the core of a microcraked plagioclase. Microcracks filled with oxides.
Figure 59 (cont.) - Microphotographs of aggregate GR3. Photos J, L and O in XPL.
Photos I, K, M, N and P in PPL. I) Poikilitic biotite with inclusions of zircon, apatite and opaque minerals. A slight chloritization can be observed on the left border along with the formation of rutile needles; J) Late muscovite with low interference colours; K) Pinkish andalusite crystal; L) Subhedral microcracked andalusite crystal in association with muscovite; M) Zircon inclusions in apatite; N) Leucoxene in muscovitized biotite; O) Chlorite with inclusions of apatite, zircon, opaque minerals. Leucoxene is filling the cleavage planes; P) Rutile needles in partially chloritized biotite.
Figure 60 – Aggregate GR3. Classes of the undulatory extinction angle of the quartz
crystals.
Figure 61 – Aggregate GR3. Boxplot of the undulatory extinction angle of the quartz
crystals.
Figure 62 – Hand sample of aggregate GR7.
Figure 63 – Microphotographs of GR7 aggregate. All photos in XPL. A) Serrated limits
in quartz grains; B) Undulatory extinction in quartz grain; C) Globular quartz in microcline; D) Micrographic quartz in plagioclase; E) Myrmekites in the interface plagioclase/microcline; F) Intra- and intercrystalline microcracks in quartz; G) Poikilitic microcline with plagioclase inclusions; H) Perthites in microcline.
Figure 63 (cont.) - Microphotographs of GR7 aggregate. Photos I, J, L, M and N in
XPL. Photos K, O and P in PPL. I) Carbonates and microcrystalline muscovite as alteration products in plagioclase; J) Oscillatory zoning in plagioclase showing microcrystalline muscovite as an alteration product; K) Inclusions of leucoxene, opaque minerals and fluorite in chloritized biotite; L) Chlorite with leucoxene filling its cleavage planes; M) Leucoxene, opaque minerals and K-feldsparalong chlorite cleavage plains; N) Symplectic muscovite; O) Zircon inclusions with pleochroic haloes in biotite; P) Zircon and opaque mineral inclusions in apatite.
Figure 64 – Aggregate GR7. Classes of the undulatory extinction angle of the quartz
crystals.
Figure 65 – Aggregate GR7. Boxplot of the undulatory extinction angle of the quartz
crystals.
Figure 66 – Hand sample of aggregate GR17.
Figure 67 - Microphotographs of aggregate GR17. All photos in XPL. A) Serrated
boundaries in quartz crystals with scattered rutile inclusions; B) Chessboard subgrain pattern in a quartz crystal; C) Euhedral quartz inclusion in K-feldspar; D) Globular quartz in microcline; E) Micrographic quartz in an altered plagioclase; F) Myrmekites in plagioclase; G) Cross-hatch twinning in microcline; H) Microcline with inclusions of plagioclase and globular quartz.
Figure 67 (cont.) - Microphotographs of GR17 aggregate. Photos I, J, K, M, N and O
in XPL. Photos L and P in PPL. I) Perthites in K-feldspar; J) Altered plagioclase into microcrystalline muscovite; K) Biotite included in quartz; L) Apatite inclusions and muscovite flake replacing biotite with opaque minerals along the cleavage planes; M) Reaction texture between quartz and late muscovite; N) Zircon with pleochroic haloes in muscovite; O) Well-developed zircon in association with opaque mineral and leucoxene; P) Chloritized biotite with rutile inclusions.
151 152 153 153 154 157 158 159 159 160 163 164
Characterization of the potential reactivity to alkalis of Portuguese aggregates for concrete
Figure 68 – Aggregate GR17. Classes of the undulatory extinction angle of the quartz
crystals.
Figure 69 – Aggregate GR17. Boxplot of the undulatory extinction angle of the quartz
crystals.
Figure 70 – Hand sample of aggregate GR18.
Figure 71 – Microphotographs of aggregate GR18. All photos in XPL. A) Undulatory extinction in a quartz crystal; B) Sutured quartz boundaries; C) Chessboard subgrain pattern in an elongated quartz crystal (on the top). Recrystallized quartz occurs in the interface of the larger grains; D) Globular quartz and plagioclase inclusions in microcline; E) Globular quartz in plagioclase; F) Myrmekites in plagioclase neighbouring K-feldspar; G) Microcline with cross-hatch and Carlsbad twins. Perthites can also be observed; H) Flame-like perthites in microcline.
Figure 71 (cont.) - Microphotographs of aggregate GR18. Photos I, J, L, M and N in
XPL. Photos K, O and P in PPL. I) Bent plagioclase crystal; J) Microcrystalline muscovite in the core of plagioclase. More well-developed late muscovite also grows in plagioclase; K) Kinked cleavage planes in biotite; L) Folded muscovite crystal; M) Bent muscovite cleavage planes filled with leucoxene; N) Symplectic fringes of muscovite; O) Totally chloritized biotite with zircon, apatite and opaque mineral inclusions; P) Fibrolite needles replacing muscovite and biotite.
Figure 72 – Aggregate GR18. Classes of the undulatory extinction angle of the quartz
crystals.
Figure 73 – Aggregate GR18. Boxplot of the undulatory extinction angle of the quartz
crystals.
Figure 74 – Hand sample of aggregate GR19.
Figure 75 – Microphotographs of aggregate GR19. All photos in XPL. A) Deformation
lamellae in quartz; B) Chessboard subgrain pattern in a quartz crystal; C) Sutured quartz boundaries; D) Micrographic quartz in microcline; E) Myrmekites in plagioclase; F) Perthitic microcline; G) Microcline with cross-hatch twinning and a plagioclase inclusion; H) Albitic crown in an altered plagioclase crystal included in microcline.
Figure 75 (cont.) – Microphotographs of aggregate GR19. Photos I, J, L, M and P in XPL. Photos K, N and O in PPL. I) Carlsbad twinning in plagioclase; J) Plagioclase with oscillatory zoning. The occurrence of microcrystalline muscovite is stronger in the calcium-richer core of the crystal; K) Biotite with numerous zircon inclusions and respective pleochroic haloes; L) Late symplectic muscovite growing on microcline; M) Slightly bent muscovite; N) Subhedral andalusite crystal with microcracks; O) Chloritized biotite with leucoxene filling the cleavage planes and inclusions of apatite; P) Fibrolite needles in plagioclase.
Figure 76 – Aggregate GR19. Classes of the undulatory extinction angle of the quartz
crystals.
Figure 77 – Aggregate GR19. Boxplot of the undulatory extinction angle of the quartz
crystals.
Figure 78 – Hand sample of aggregate GR20.
Figure 79 – Microphotographs of aggregate GR20. All photos in XPL. A) Quartz with
serrated boundaries and intercrystalline microcracks; B) Undulatory extinction in quartz; C) Globular quartz in plagioclase; D) Myrmekites in plagioclase neighbouring K-feldspar; E) Perthites in orthoclase; F) Microcline with biotite and altered plagioclase inclusions; G) Albitization of orthoclase; H) Carlsbad twin in plagioclase.
165 165 166 169 170 171 171 172 175 176 177 177 178 181
Characterization of the potential reactivity to alkalis of Portuguese aggregates for concrete
Figure 79 (cont.) - Microphotographs of aggregate GR20. Photos I, K and M in XPL.
Photos J, L, N, O and O in PPL. I) Plagioclase with oscillatory zoning; J) Biotite with inclusions of zircon, apatite and opaque minerals; K) Late muscovite including microcline; L) “Muscovite” that results from the loss of iron of biotite; M) Symplectic fringes of muscovite; N) Microcracked tourmaline crystal; O) Pinkish andalusite replaced by muscovite; P) Rutile needles in chloritized biotite.
Figure 80 – Aggregate GR20. Classes of the undulatory extinction angle of the quartz
crystals.
Figure 81 – Aggregate GR20. Boxplot of the undulatory extinction angle of the quartz
crystals.
Figure 82 – Classification of the investigated granitic aggregates according to the QAPF modal classification of plutonic rocks (based on Streckeisen, 1976). The corners of the triangle are Q (quartz), A (alkali feldspar), P (plagioclase). The omission of F (feldspathoid) corner is justified by the silica oversaturation of the studied rocks.
Figure 83 – Distribution of the investigated granitic aggregates in the ASTM C 289
plot.
Figure 84 – Expansion results for the granitic aggregates when submitted to the
accelerated mortar-bar test at 80ºC (ASTM C 1260).
Figure 85 – Expansion results for the granitic aggregates when submitted to the
accelerated mortar-bar test at 80ºC (ASTM C 1260) during one year.
Figure 86 – Expansion results of the accelerated concrete prism test at 60ºC (RILEM
AAR-4.1) concerning the investigated granitic aggregates.
Figure 87 – Expansion results of the extended accelerated concrete prism test at 60ºC (RILEM AAR-4.1) concerning the investigated granitic aggregates.
Figure 88 – Expansion results of the concrete prism test at 38ºC (RILEM AAR-3)
concerning the investigated granitic aggregates.
Figure 89 – Expansion performance of aggregate GR2 in the concrete prism test at
38ºC (RILEM AAR-3) for two years of testing.
Figure 90 – Aggregate GR1. Void totally filled with gel. It was observed in the
thin-section produced from the concrete prism tested according to RILEM AAR-3. A) Under optical microscope (PPL); B) Image obtained by SEM.
Figure 91 – Aggregate GR1. Voids filled by gel observed in the thin section from the
concrete prism with aggregate GR1 tested according with RILEM AAR-4.1. A and B) Under optical microscope (PPL); C and D) Images obtained by SEM; E and F) Spectra by EDS.
Figure 92 – Aggregate GR1. Gel in the interface of an aggregate particle and the
cement paste, in the thin-section from the concrete prism tested according with RILEM AAR-4.1. A and B) Under optical microscope (PPL); C and D) Images obtained by SEM; E and F) Spectra by EDS.
Figure 93 – Aggregate GR2. Gel in the interface of an aggregate particle and the
cement paste, in the thin section from the concrete prism tested according with RILEM AAR-3. A and B) Under optical microscope (PPL); C and D) Images obtained by SEM; E and F) Spectra by EDS.
Figure 94 – Aggregate GR2. Gel filling cracks inside the granitic particle of coarse
aggregate, in the thin-section from the concrete prism tested according with RILEM AAR-3. In the interface between the aggregate particles and the cement paste ettringite acicular particles developed. A) Under optical microscope (PPL); B) Image obtained by SEM; C, D and E) Spectra by EDS (Z1, Z2, Z3).
Figure 95 – Aggregate GR2. Acicular crystals of ettringite in the cracks between the aggregate particles and the cement paste. A and B) Under optical microscope (PPL); C and D) Images obtained by SEM; E) Spectrum by EDS.
182 183 183 184 185 186 187 188 190 191 191 193 194 195 197 198 199 a)
Characterization of the potential reactivity to alkalis of Portuguese aggregates for concrete
Figure 96 – Aggregate GR2. Gel in a void and filling a crack and void in the interface
of cement paste with a granitic particle, in the thin- section from the concrete prism tested according with RILEM AAR-4.1. A and B) Under optical microscope (PPL); C and D) Images obtained by SEM; E and F) Spectra by EDS. In each field Z2 is similar to Z1.
Figure 97 – Aggregate GR3. Gel forming layers in cracks in the interface of cement
paste with the granitic particles, in the thin-section from the concrete prism tested according with RILEM AAR-4.1 (A, B, C under PPL; D under XPL).
Figure 98 – Aggregate GR3. Gel in the interface of cement paste with the granitic
particles, in the thin-section from the concrete prism tested according with AAR-4.1. A, B and C) Images obtained by SEM; D and E) EDS spectra.
Figure 99 – Aggregate GR3. Gel inside a crack crossing a granitic particle in the
thin-section from the concrete prism tested according with RILEM AAR-4.1. A) Under optical microscope (PPL); B and C) Images obtained by SEM; D) EDS spectrum.
Figure 100 – Comparison between the percentages of microcrystalline quartz and the
undulatory extinction angles of the quartz crystals.
Figure 101 – Comparison between the expansions of the granitic aggregates in ASTM
C 1260 at fourteen days and the percentages of microcrystalline quartz.
Figure 102 – Comparison between the expansions of the granitic aggregates in ASTM
C 1260 at twenty-eight days and the percentages of the microcrystalline quartz.
Figure 103 – Comparison between the expansions of the granitic aggregates in ASTM
C 1260 at fourteen days and the undulatory extinction angles of the quartz crystals.
Figure 104 – Comparison between the expansions of the granitic aggregates in ASTM C 1260 at twenty-eight days and the undulatory extinction angles of the quartz crystals.
Figure 105 – Comparison between the expansions of the granitic aggregates in RILEM
AAR-4.1 according to LNEC E 461 (2007) and the percentages of microcrystalline quartz.
Figure 106 – Comparison between the expansions of the granitic aggregates in RILEM
AAR-4.1 according to RILEM AAR-0 (2013) and the percentages of microcrystalline quartz.
Figure 107 – Comparison between the expansions of the granitic aggregates in RILEM
AAR-4.1 according to Lindgård et al. (2010) and the percentages of microcrystalline quartz.
Figure 108 – Comparison between the expansions of the granitic aggregates RILEM
AAR-4.1 according to LNEC E 461 (2007) and the undulatory extinction angles of the quartz crystals.
Figure 109 – Comparison between the expansions of the granitic aggregates in RILEM AAR-4.1 according to RILEM AAR-0 (2013) and the undulatory extinction angles of the quartz crystals.
Figure 110 – Comparison between the expansions of the granitic aggregates in RILEM
AAR-4.1 according to Lindgård et al. (2010) and the undulatory extinction angles of the quartz crystals.
Figure 111 – Comparison between the expansions of the granitic aggregates in RILEM
AAR-3 and the percentages of microcrystalline quartz.
Figure 112 – Comparison between the expansions of the granitic aggregates in RILEM
AAR-3 and the undulatory extinction angles of the quartz crystals.
Figure 113 – Simplified geological map of Porto Santo Island (adapted from Mata et
al., 2013).
Figure 114 – The Late Cretateous magmatism in the Portuguese Mainland. Black circles indicate the main magmatic events. Geodetic coordinates, Datum World Geodetic System 84 (Miranda et al., 2009).
200 201 202 203 205 207 208 209 209 211 211 212 213 213 214 216 217 229 231
Characterization of the potential reactivity to alkalis of Portuguese aggregates for concrete
Figure 115 – Effect in a diffractogram of a sample containing smectite and treated with
ethylene glycol in comparison to an untreated (air-dried) sample (Moore and Reynolds, 1997).
Figure 116 – Chemical classification of the studied volcanic rocks used as aggregates using TAS (total alkali-silica diagram) (after Le Bas et al., 1986). The dashed line between the foidite field and the basanite-tephrite field indicates that further criteria must be used to separate these rock types (after Le Maitre et al., 2002).
Figure 117 – Likelihood of correctly classifying alkali basalt and subalkali basalt using
TAS (after Bellieni et al., 1983) assuming equal chances of a basalt being alkali or subalkali.
Figure 118 – BS6hawaiite occurs as a massive (left sample) or as a vesicular (central sample) rock. Sometimes it is possible to observe cracks filled with carbonates (right sample).
Figure 119 – Microphotographs of sample BS6hawaiite. Photos A, B and D in XPL. Photos C, E, F, G and H in PPL. A) Trachytic texture conferred by the alignment of plagioclase crystals; B) Carbonates partially replacing the rock groundmass; C) Yellowish-brown smectite filling a vesicle; D) Plagioclase microphenocryst with polysynthetic twinning and opaque minerals inclusions in a trachytic textured groundmass; E) Brown hornblende microphenocryst with opaque inclusions; F) Pale greenish augite crystals in the groundmass; G) Hexagonal apatite microphenocryst with parallel opaque inclusions and in association with opaque minerals; H) Apatite euhedral crystals clotted in the groundmass along opaque minerals.
Figure 120 – Sample BS6hawaiite. SEM images and respective EDS spectra of fluorapatite (Z1 and Z3) and its ilmenite inclusions (Z2).
Figure 121 – Sample BS6hawaiite. SEM images and respective EDS spectra of a plagioclase microphenocryst (Z1) and of a plagioclase crystal (Z2) and an alkali feldspar (sanidine) (Z3) which are part of the groundmass.
Figure 122 – Sample BS6hawaiite. SEM images and respective EDS spectra of titanomagnetite, composed of exsolved lamellae of ilmenite and magnetite (Z1, Z2 and Z3), and of diopside (Z4).
Figure 123 – Sample BS6hawaiite. SEM images and respective EDS spectra of amygdaloidal smectite group clay (Z4) and diopside (Z5).
Figure 124 – X-ray diffractograms of sample BS6hawaiite v.s. BS6hawaiite + ethylene glycol. Smec – smectite; Sn – sanidine; Dp – diopside; Ti – titanomagnetite; Ad – andesine; Ap – apatite.
Figure 125 – Reddish tint basalt which composes the diverse lithology of aggregate
BS6. Elongated vesicles define a subparallel alignment.
Figure 126 – Microphotographs of sample BS6basalt. Photos C and E in XPL. Photos A, B, D, F, G and H in PPL. A) Vesicle lined by clay minerals; B) Irregular shaped vesicles randomly distributed in a trachytic groundmass; C) Clot of pyroxenes; D) Iddingsite rimming in an altered and corroded olivine. Alteration is visible inside the crystal; E) Euhedral olivine altered to clay minerals; F) Elongated opaque minerals scattered in the groundmass; G) Large opaque mineral enclosing the groundmass; H) Poorly crystallized red-brownish material replacing volcanic glass.
Figure 127 – Sample BS6basalt. SEM images and respective EDS spectra of titanian augite (Z1) and clay of the smectite group partially filling a vesicle (Z2 and Z3).
Figure 128 – Sample BS6basalt. SEM images and respective EDS spectra of vesicle-lining smectite group mineral evidencing a variation in element content (Z4 – Z8), titanomagnetite (Z9) and apatite (Z10).
Figure 129 – Sample BS6basalt. SEM image and respective EDS spectrum of titanomagnetite (Z11). 234 239 240 241 244 245 246 247 248 249 250 252 253 254 255
Characterization of the potential reactivity to alkalis of Portuguese aggregates for concrete
Figure 130 – X-ray diffractograms of sample BS6basalt v.s. BS6basalt + ethylene glycol. Smec – smectite; Ad – andesine; Au – augite; Ti – titanomagnetite; Ap – apatite.Figure
131 – Hand-samples of massive (left side) and vesicular (right side) BS6basanitoid. Vesicles may contain carbonate crystals (red arrow).
Figure 132 – Microphotographs of sample BS6basanitoid. Photos A, B, D, E, F and H in XPL. Photos C and G in PPL. A) Carbonates with spherulitic texture in void; B) Carbonates disseminated in the groundmass; C) Titanian augite microphenocrysts in a monomineralic cluster (glomeroporphyritic texture); D) Hour-glass twinning in a zoned pyroxene microphenocryst; E) Skeletal olivine microphenocryst rimmed by iddingsite and with a glass-like inclusion (inside red circle); F) Glass-like material in an inclusion in olivine (inside red circle); G) Microcracks in olivine filled with opaque minerals; H) Plagioclase lath with polysynthetic twinning in the groundmass.
Figure 133 – Sample BS6basanitoid. SEM images and respective EDS spectra of spinel (s.s.) (Z1), titanomagnetite (Z2) and titanian augite (Z3).
Figure 134 – Aggregate BS6Basabitoid. SEM images and respective EDS spectra of titanian augite (Z3), nepheline (Z4) and plagioclase (Z5).
Figure 135 – Aggregate BS6Basanitoid. SEM images and respective EDS spectra of Ca and Mg carbonates in voids (Z4) and (Z5).
Figure 136 – Sample BS6basanitoid. SEM images and respective EDS spectra of glass-like material (Z1), and Mg-rich olivine (Z2).
Figure 137 – Sample BS6basanitoid. SEM images and respective EDS spectra of the glass-like inclusion (Z1) in Mg-rich olivine (Z2) rimmed by iddingsite (Z3).
Figure 138 – Sample BS6basanitoid. SEM image and respective EDS spectra of glass-like material (Z1) included in olivine (Z2).
Figure 139 – Sample BS6basanitoid. SEM image of the analysed glass-like inclusion (inside red circle) in olivine.
Figure 140 – X-ray diffractogram of sample BS6basanitoid. Lb – labradorite; Au – augite; Ol – olivine; N – nepheline; Ti – titanomagnetite; D – dolomite.
Figure 141 – Massive (left side) and vesicular (right side) hand-samples of the
basanitoid composing aggregate BS7.
Figure 142 – Microphotographs of aggregate BS7. Photos B, C, D and E in XPL.
Photos A, F, G and H in PPL. A) Irregular shaped vesicles are randomly distributed in the basanitoid; B) Skeletal olivine microphenocryst with embayments filled with groundmass; C) Skeletal olivine with evident zoning; D) The variation of the interference colours denotes the existence of zoning in this olivine microphenocryst; E) Embayed olivine microphenocryst in the vesicular textured sample. Note that plagioclase laths are following the microphenocryst and vesicles’ outline; F) Elongated section of augite in the groundmass; G) Olivine microphenocryts show abundant irregular fractures and alteration to iddingsite; H) Opaque minerals inclusions in olivine microphenocryst altered to iddingsite.
Figure 143 – Aggregate BS7. SEM image and respective EDS spectra of Mg-rich
olivine. From the core (Z1) to olivine’s periphery (Z2), there is an enrichment in Fe.
Figure 144 – Aggregate BS7. SEM image and respective EDS spectra of olivine (Z1
and Z2), plagioclase (Z3), titanian augite (Z4) and titanomagnetite (Z5).
Figure 145 – Aggregate BS7. SEM image and respective EDS spectra of plagioclase
crystals in the groundmass: andesine (Z3 and Z4) and of a rich sodium aluminosilicate (analcime) (Z5).
Figure 146 – Aggregate BS7. SEM images and respective EDS spectra of
titanomagnetite composed of exsolved lamellae of ilmenite and magnetite (Z7 and Z6). 256 257 260 261 262 263 264 265 266 267 267 268 271 272 273 274 275
Characterization of the potential reactivity to alkalis of Portuguese aggregates for concrete
Figure 147 – X-ray diffractogram of aggregate BS7. Ad – andesine; Au – augite; Ol –
olivine; N – nepheline; Ti – titanomagnetite; G – goethite; Hm – hematite.
Figure 148 – X-ray diffractogram of the insoluble residue (assay 1) of aggregate BS7.
Dp – diopside; A – albite.
Figure 149 – X-ray diffractogram of the insoluble residue (assay 2) of aggregate BS7.
Q – quartz; Cr – cristobalite; Lb – labradorite; Ad – andesine; R – rutile.
Figure 150 – Different macroscopic aspects of aggregate BS8 (from left to right:
massive texture; onion skin weathering; and conchoidal fracture).
Figure 151 – Microphotographs of aggregate BS8. Photos A, C, D, E, F and G in XPL.
Photos B and H in PPL. A) General aspect of the groundmass in the sample with compact texture. A slight parallel orientation of the plagioclase laths can be observed conferring a trachytic texture; B) Augite microphenocryst. Fractures and cleavage planes can be clearly identified; C) Clot of augite and olivine microphenocryts (glomeroporphyritic texture); D) Pyroxene cluster. Zoning is evident; E) Iddingsite mantle in olivine microphenocrysts. The partially enclosed crystals are pyroxenes; F) Zoned olivine. A homogeneous core is surrounded by a continuously zoned mantle, as indicated by the variation in interference colours; G) Skeletal olivine with a central gap filled with groundmass; H) Cluster of euhedral opaque minerals.
Figure 152 – Aggregate BS8. SEM image and respective EDS spectra of fluorapatite
(Z1), aluminium silicate clay (Z2) replacing plagioclase crystals (Z3), titanian augite (Z4) and titanomagnetite (Z5).
Figure 153 – Aggregate BS8. SEM images and respective EDS spectra of titanian
augites (Z6 and Z7), aluminium silicate clay replacing plagioclase (Z8) and plagioclase (Z9).
Figure 154 – Aggregate BS8. SEM image and respective EDS spectra of olivine (Z10
and Z11) and aluminium silicate clay (Z12) replacing plagioclase.
Figure 155 – Aggregate BS8. SEM image of the analysed poorly-crystallized material
replacing plagioclase crystals. As observed, this material also fills microcracks in the groundmass.
Figure 156 – X-ray diffractogram of aggregate BS8. Ad – andesine; Au – augite; Ol – olivine; Hb – hornblende; Mo – muscovite; K – kaolinite; Ti – titanomagnetite.
Figure 157 – Hand sample of aggregate BS9.
Figure 158 – Microphotographs of aggregate BS9. Photos A, E and F in XPL. Photos
B, C, D, G and H in PPL. A) Intergranular doleritic texture: olivine microphenocryts scattered in a groundmass of plagioclase, pyroxene and olivine; B) Pinkish-brown cluster of titaniferous augite; C) Titaniferous augite microphenocryst altered to serpentine; D) Bipyramidal section of an olivine microphenocryst altered to serpentine; E) Olivine microphenocryst with abundant microcracks filled with serpentine; F) Glomeroporphyritic texture conferred by the clustering of olivine microphenocrysts; G) Square-shaped opaque minerals forming a small cluster; H) Serpentine along microcracks of a olivine microphenocryst. It is possible to identify inclusions of opaque minerals.
Figure 159 – Aggregate BS9. SEM image and respective EDS spectra of titanian
augite (Z1), plagioclase (Z2), rich-sodium aluminosilicate (possibly albite) (Z3) and titanomagnetite (Z4),
Figure 160 – Aggregate BS9. SEM images and respective EDS spectra of flaky
smectite-chlorite group clay (Z5) filling microcracks in Mg-rich olivine (Z6).
Figure 161 – Aggregate BS9. SEM image and respective EDS spectra of titanian
augite (Z7), smectite-chlorite group clay (Z8 and Z9), anorthoclase (Z10) and albite (Z11). 276 276 277 278 280 281 283 283 284 285 286 288 289 290 291
Characterization of the potential reactivity to alkalis of Portuguese aggregates for concrete
Figure 162 – Aggregate BS9. SEM image and respective EDS spectra of anorthoclase
(Z1) rimmed by smectite (Z2). Apatite’s image and spectrum are presented at the bottom (Z1).
Figure 163 – Aggregate BS9. SEM images of the analyzed areas in EPMA (WDS) in pyroxene (1 and 2) (A) and olivine (3) (B).
Figure 164 – X-ray diffractograms of aggregate BS9 v.s. BS9 + ethylene glycol. Smec – smectite; Lb – labradorite; Au – augite; Ol – olivine; N – nepheline; At – anorthoclase; Mo – muscovite; K – kaolinite; Ti – titanomagnetite.
Figure 165 – Distribution of the investigated volcanic aggregates in ASTM C 289 plot. Figure 166 – Expansion results of the accelerated mortar-bar method test at 80ºC
(ASTM C 1260) concerning the investigated volcanic aggregates.
Figure 167 – Expansion results of the accelerated concrete prism test at 60ºC (RILEM
AAR-4.1) concerning the investigated volcanic aggregates.
Figure 168 – Expansion results of the extended accelerated concrete prism test at
60ºC (RILEM AAR-4.1) concerning the aggregate BS9.
Figure 169 – Expansion results of the concrete prism test at 38ºC (RILEM AAR-3) concerning the investigated volcanic aggregates.
Figure 170 – Aggregate BS6. Gel-like material in a crack in the interface of the aggregate particle with the cement paste in the thin-section from the concrete prism tested according with RILEM AAR-4.1. A and B) Under optical microscope (PPL); C) Image obtained by SEM; D, E and F) EDS spectra, including the composition of the gel lining the void inside the aggregate particle (Z3).
Figure 171 – Aggregate BS8. Material formed in a deeply altered particle of the sand fraction in the thin-section from the concrete prism tested according to AAR-4.1. A) Under optical microscope (PPL); B) Image obtained by SEM; C) EDS spectrum.
Figure 172 – Aggregate BS9. Gel in a crack in the interface between an aggregate
particle and the cement paste in the thin-section from the concrete prism tested according to AAR-4.1. A) Under optical microscope (PPL); B) Image obtained by SEM; C) EDS spectrum.
Figure 173 – Aggregate BS9. Small portion of gel in a crack in the interface between an aggregate particle and the cement paste in the thin-section from the concrete prism tested according to AAR-4.1. A) Under optical microscope (PPL); C) Image obtained by SEM; C) EDS spectra: Z1 corresponds to anorthoclase, Z2 corresponds to gel.
Figure 174 – Aggregate BS9. The groundmass and microphenocrysts are almost
completely altered to clay minerals (brown). (Microphotograph in PPL).
Figure 175 – Schematic diagram of the mechanism and model of ACR (adapted from
Tang and Deng, 2004).
Figure 176 – Schema of two interfaces in ACR (Tang and Deng, 2004).
Figure 177 – Location map of the areas where the quarries of the investigated
carbonate aggregates are placed (MCSA – “Maciço de Condeixa-Sicó-Alvaiázere”; MCE – “Maciço Calcário Estremenho”) (adapted from Martins, 2008).
Figure 178 – Hand-samples of aggregate CL3 revealing different characteristics. From the left to the right: CL3a, CL3b and CL3c.
Figure 179 – Microphotographs of aggregate CL3. All photos in cross-polarized light.
A) Bioclasts scattered in micritic mud; B) Veinlet filled with calcite cutting a micritic matrix; C) Peloids merged in a micritic matrix. Some sparite can be observed (lighter crystals); D) Peloids in sparitic matrix; E) Bioclast double-cut by calcite veinlets. The sparitization of a bioclast can be observed at the left top; F) Carbonate mudstone elements cemented by sparite; G) Anastomosed calcite veinlets; H) Calcite crystals with comb texture filling veinlets.
292 293 294 295 296 297 298 299 300 302 303 304 307 314 315 318 322 324
Characterization of the potential reactivity to alkalis of Portuguese aggregates for concrete
Figure 180 – Aggregate CL3. SEM images (A and B; B is a zoom from A), respective
EDS spectra of a veinlet in sample CL3a filled with aluminosilicates (Z3 and Z4) in a carbonate mud matrix and element mapping (Ca – light blue; Al – dark blue; K – pink; Mg – green; Na – red; and Si – yellow).
Figure 181 – X-ray diffractogram of aggregate CL3. Mo – muscovite; K – kaolinite; Q –
quartz; C – calcite.
Figure 182 – Assessment of potential reactivity of CL3 aggregate using chemical
analysis of whole-rock composition based on CSA A23.2-26A (1994).
Figure 183 – Hand samples of aggregate DL2: DL2a (left); and DL2b (right).
Figure 184 – Microphotographs of aggregate DL2. Photos A, C, D and G in
cross-polarized light. Photos B, E F and H in plane cross-polarized light. A) Planar subhedral dolomite; B) Planar void-filling dolomite. The clearer areas are composed of calcite; C) Planar void-filling dolomite crystals surrounding a calcite crystal at the center; D) Calcite veinlet cutting a mosaic texture of dolomite crystals; E) Dolomite crystal with a cloudy core of fluid inclusions; F) Loosely packed euhedral rhombs of dolomite in a brownish carbonate mud (micrite) (center) and subhedral to anhedral dolomite crystals with scarce intercrystalline matrix (top); G) Bioclasts in the dolomitic limestone; H) Peloid being replaced by dolomite rhombs.
Figure 185 – Aggregate DL2. SEM image and respective EDS spectra of a calcite
crystal filling a void (Z3) surrounded by dolomite crystals with variable Mg content (Z1 and Z2).
Figure 186 – Aggregate DL2. SEM image and respective EDS spectrum of calcite
filling veinlets (Z5) in dolomite (DL2a).
Figure 187 – Aggregate DL2. SEM image and element mapping of Ca and Mg in
dolomite (DL2a) (Ca – blue; and Mg – green). Calcite crystals are represented in light blue (A), whilst dolomite is represented in darker blue (A) and green (B).
Figure 188 – X-ray diffractograms of aggregate DL2. D – dolomite; C – calcite.
Figure 189 – Assessment of potential reactivity of DL2 aggregate using chemical
analysis of whole-rock composition based on CSA A23.2-26A (1994).
Figure 190 – X-ray diffractogram of the insoluble residue of aggregate CL3. C – calcite.
Figure 191 – X-ray diffractogram of aggregate DL2. D – dolomite; C – calcite; Q –
quartz; Fa – feldspar (possibly albite).
Figure 192 – Distribution of the investigated carbonate aggregates in ASTM C 289
plot.
Figure 193 – Expansion results of the accelerated mortar-bar method test at 80ºC
(ASTM C 1260) concerning the investigated carbonate aggregates.
Figure 194 – Expansion results of the rapid preliminary screening test for carbonate
aggregates (RILEM AAR-5) concerning the investigated carbonate aggregates.
Figure 195 – Expansion results of the accelerated concrete prism test at 60ºC (RILEM
AAR-4.1) concerning the investigated carbonate aggregates.
Figure 196 – Expansion results of the concrete prism test at 38ºC (RILEM AAR-3) concerning the investigated carbonate aggregates.
Figure 197 – Correlation between the expansion values of all the investigated
aggregates in ASTM C 1260 at fourteen days (RILEM AAR-0, 2013) and in RILEM AAR-4.1 at twelve weeks (LNEC E 461, 2007).
Figure 198 – Correlation between the expansion values of all the investigated
aggregates in ASTM C 1260 at fourteen days (RILEM AAR-0, 2013) and in RILEM AAR-4.1 at fifteen weeks (RILEM AAR-0, 2013).
325 326 326 327 329 330 331 331 332 332 333 334 335 336 337 338 338 348 348
Characterization of the potential reactivity to alkalis of Portuguese aggregates for concrete
Figure 199 – Correlation between the expansion values of all the investigated
aggregates in ASTM C 1260 at fourteen days (RILEM AAR-0, 2013) and in RILEM AAR-4.1 at twenty weeks (Lindgård et al., 2010).
Figure 200 – Correlation between the expansion values of all the investigated aggregates in ASTM C 1260 at twenty-eight days (Santos Silva and Braga Reis, 2000) and in RILEM AAR-4.1 at twelve weeks (LNEC E 461, 2007).
Figure 201 – Correlation between the expansion values of all the investigated
aggregates in ASTM C 1260 at twenty-eight days (Santos Silva and Braga Reis, 2000) and in RILEM AAR-4.1 at fifteen weeks (RILEM AAR-0, 2013).
Figure 202 – Correlation between the expansion values of all the investigated
aggregates in RILEM AAR-4.1 at twenty weeks and in ASTM C 1260 at twenty-eight days.
Figure 203 – Correlation between the expansion values of all the investigated
aggregates in ASTM C 1260 at fourteen days (RILEM AAR-0, 2013) and in RILEM AAR-3 (RILEM AAR-0, 2013).
Figure 204 – Correlation between the expansion values of all the investigated aggregates in ASTM C 1260 at twenty-eight days (Santos Silva and Braga Reis, 2000) and RILEM AAR-3 (RILEM AAR-0).
Figure 205 – Correlation between the expansion values of all the investigated
aggregates in RILEM AAR-4.1 at twelve weeks (LNEC E 461, 2007) and in RILEM AAR-3 (RILEM AAR-0, 2013).
Figure 206 – Correlation between the expansion values of all the investigated
aggregates in RILEM AAR-4.1 at fifteen weeks (RILEM AAR-0, 2013) and in RILEM AAR-3 (RILEM AAR-0, 2013).
Figure 207 – Correlation between the expansion values of all the investigated
aggregates in RILEM AAR-4.1 at twenty weeks (Lindgård et al. (2010) and in RILEM AAR-3 (RILEM AAR-0, 2013).
349 350 351 351 352 353 355 355 356
Characterization of the potential reactivity to alkalis of Portuguese aggregates for concrete
List of tables
Table 1 – Potentially alkali-reactive siliceous components (adapted from RILEM AAR-1,
2003; Mindess et al., 2003; Blight and Alexander, 2011; RILEM AAR-1.1, 2013).
Table 2 – Rock types, definitions and potentially alkali-reactive mineral constituents (adapted from RILEM AAR-1, 2003; RILEM AAR-1.1, 2013).
Table 3 – “Pessimum” proportions of alkali-reactive minerals in mortar-bars (Katayama,
2012a).
Table 4 – Environmental classes according to RILEM AAR-7.1 (2013) and RILEM-7.2
(2013).
Table 5 – Classification system for site or field observations (RILEM AAR-6.1, 2013). Table 6 – Features to look for in petrographic examination according to different methods (Fournier et al., 2004, 2010).
Table 7 – Classification system for petrographic examination (modified from CSA A
864-00 in Fournier et al., 2010).
Table 8 – Petrographic features and their corresponding weighting factors for DRI
(Grattan-Bellew, 2012).
Table 9 – Climatic contrast in the Portuguese Mainland and Madeira and Azores
Archipelagos (year 2012) (source: Instituto Português do Mar e do Ar).
Table 10 – Classes of undulatory extinction according to LNEC E 415 (1993). Table 11 – Potentially reactive rocks and minerals to alkalis (LNEC E 461, 2007).
Table 12 – Minerals considered as potential sources of alkalis and its bearing rocks
(LNEC E 461, 2007).
Table 13 – Limit content of soluble alkalis in concrete (I – innocuous behaviour; II and III – potentially deleterious behaviour (LNEC E 461, 2007).
Table 14 – ASR affected dams in Portugal (adapted from Lopes Batista and Piteira
Gomes, 2012).
Table 15 – Reference publications of ASR affected dams in Portugal. Table 16 – Other ASR affected structures in Portugal.
Table 17 – Tasks included in Project IMPROVE.
Table 18 – Main materials applied as aggregates in Portugal between the years 2000 and 2011 (source: Direcção Geral de Energia e Geologia, 2013).
Table 19 – IMPROVE nomenclature for aggregates under investigation (# - identification
number).
Table 20 – Aggregate assessment for AAR (excluding carbonate rock assessment)
(adapted from Blight and Alexander, 2011).
Table 21 – Aggregate’s sizes used in expansion laboratory tests.
Table 22 – Main advantages and disadvantages of the applied methodology (adapted
from Santos Silva, 2005; Lindgård et al., 2010; Blight and Alexander, 2011; Alaejos and Lanza, 2012; RILEM AAR-0, 2013).
Table 23 – Methods applied to each aggregate type.
Table 24 – Codification, lithology and age of the studied granitic rocks according to Dias
et al. (1998, 2010).
Table 25 – Characteristics of the mixes used for mortar-bar and concrete prism tests. Table 26 – Geochemistry of the investigated granitic aggregates.
Table 27 – Aggregate GR1. Point-counting method results (all values in vol%, with
exception of relative error (%)).
Table 28 – Aggregate GR2. Point-counting method results (all values in vol% with
exception of relative error (%)).
Table 29 – Aggregate GR3. Point-counting method results (all values in vol% with
exception of relative error (%)).
14 16 19 33 55 58 59 65 71 73 74 74 75 78 79 80 82 85 91 93 105 119 121 128 133 135 138 144 150