Contents lists available atScienceDirect
Food Research International
journal homepage:www.elsevier.com/locate/foodresSpontaneous variation regarding grape berry skin color: A comprehensive
study of berry development by means of biochemical and molecular markers
Vanessa Ferreira
a,b,⁎, Fátima Fernandes
c, David Carrasco
b, Marivel Gonzalez Hernandez
d,
Olinda Pinto-Carnide
a, Rosa Arroyo-García
b, Paula Andrade
c, Patrícia Valentão
c, Virgílio Falco
e,
Isaura Castro
aaCentro de Investigação e de Tecnologias Agro-Ambientais e Biológicas (CITAB), Universidade de Trás-os-Montes e Alto Douro, 5000-801 Vila Real, Portugal bCentro de Biotecnología y Genómica de Plantas (CBGP), Campus de Montegancedo, Autovía M40, km38, 28223, Pozuelo de Alarcón, Madrid, Spain
cREQUIMTE/LAQV, Laboratório de Farmacognosia, Departamento de Química, Faculdade de Farmácia, Universidade do Porto, R. Jorge Viterbo Ferreira, no 228, 4050-313 Porto, Portugal
dCiencias Química y Sensorial Enológica, Instituto de Ciencias de la Vid y el Vino, Universidad de La Rioja, Complejo Científico Tecnológico - Madre de Dios 51, 26006 Logroño, Spain
eCentro de Química de Vila Real (CQ-VR), Universidade de Trás-os-Montes e Alto Douro, 5000-801 Vila Real, Portugal
A R T I C L E I N F O
Keywords: Vitis vinifera L. Somatic variants Skin color CIElab Phenolic profiles VvMybA1–2A B S T R A C T
Understanding grape berry development and the metabolism of different classes of compounds responsible for traits like berry's color is imperative to control and improve quality aspects of grapes. A colorimetric, biochemical and molecular characterization allowed the comprehensive description of the pigment-related characteristics of nine berry skin color somatic variants, belonging to four different varieties. Although the observed berry skin color variability was not fully explained by MybA locus, the phenolic profiles allowed inferring about specific interferences among the biosynthetic pathways. Data were consistent concerning that grapes showing cyanidin-3-O-glucoside as the major anthocyanin andflavonols with two substituent groups in the lateral B-ring are generally originated by a white ancestor. After retro-mutation, these grapes seem to keep the dysfunction onflavonoid hydroxylases enzymes, which negatively affect the synthesis of both flavonols and anthocyanins with three substituent groups in the lateral B-ring. Overall, the obtained results indicate that the color differences observed between somatic variants are not solely the result of the total amount of compounds synthesized, but rather reflect a different dynamics of the phenolic pathway among the different color variants of the same variety.
Chemical compounds: Gallic acid (PubChem CID: 370); Caftaric acid (PubChem CID: 6,440,397); Catechin (PubChem CID: 73,160); Epigallocatechin gallate (PubChem CID: 65,064); Quercetin-3-O-galactoside (PubChem CID: 5,281,643); Quercetin-3-O-glucoside (PubChem CID: 25,203,368); Malvidin-3-O-glucoside (PubChem CID: 443,652); Peonidin-3-O-p-coumaroylglucoside (PubChem CID: 44,256,849); Malvidin-3-O-p-coumaroylglucoside (PubChem CID: 44,256,988); Resveratrol-3-O-glucoside (PubChem CID: 25,579,167).
1. Introduction
Grapevine berries are complex organs formed by diverse tissues that follow a development pattern typical of non-climacteric species. As a non-climacteric fruit, grape berry displays a double sigmoidal growth curve with two rapid growth periods separated by a lag phase (Castellarin et al., 2015). The onset of ripening is a short period known as véraison that marks the boundary between the lag phase and the second growth period after which growth declines. Véraison is generally characterized by several processes, such as berry softening, acids
decrease, sugar accumulation, loss of photosynthetic capacity and initiation of color development (Robinson & Davies, 2000).
Since the beginning of grapevine domestication, berry skin color has been used for cultivar characterization and became greatly diversified. Variants with different skin color, including black, red, pink, grey and white (yellow–green) have arisen as a result of natural hybridization and human selection over millennia (Alcalde-Eon, García-Estévez, Martín-Baz, Rivas-Gonzalo, & Escribano-Bailón, 2014; Azuma et al., 2008; Rustioni, De Lorenzis, Hârţa, & Failla, 2016). This morpho-physiological diversity regarding grape berry skin color could be
http://dx.doi.org/10.1016/j.foodres.2017.03.050
Received 21 December 2016; Received in revised form 27 March 2017; Accepted 30 March 2017
⁎Corresponding author at: Centro de Investigação e de Tecnologias Agro-Ambientais e Biológicas (CITAB), Universidade de Trás-os-Montes e Alto Douro, 5000-801 Vila Real, Portugal. E-mail address:vanessa.cm.ferreira29@gmail.com(V. Ferreira).
Available online 01 April 2017
0963-9969/ © 2017 Elsevier Ltd. All rights reserved.
spontaneously generated by genetic alterations, namely somatic poly-morphisms during plant growth, which can include duplications, insertions or minor changes, such as SNPs (Torregrosa et al., 2011), mainly caused by the activity of transposable elements (Carrier et al., 2012). In fact, there are many examples of other spontaneous variations including flavor, early or late ripening, size and compactness of bunches, canopy growth or yield that have been identified in multiple varieties (Torregrosa et al., 2011). Ultimately, grapevine somatic variants could be useful to investigate gene biological function, because they result from the effect of single mutation events in a given genetic background. This kind of knowledge could also avoid undesirable changes, such as morphological mutations that can occur. Therefore, somatic variants are an unique resource for both functional genomics and breeding and should be considered a possible solution to ethical problems surrounding genetically modified organisms or interspecific grapevine crosses (Torregrosa et al., 2011). In several countries, some grapevine somatic mutants are more widespread than the correspond-ing wild type variety, namely Pinot Gris, Pinot Meunier or the berry color somatic variants of Cabernet Sauvignon, which give the opportu-nity to produce some unique wines (Migliaro et al., 2014; Torregrosa et al., 2011).
At the molecular level, the most well-documented polymorphisms leading to various phenotypes within varieties are those that affect berry color. These color differences are determined by the composition and quantity of phenolic compounds, particularly anthocyanins, which are one of the most important plant pigments (Azuma et al., 2008). Anthocyanins start to be synthesized during the onset of ripening and are gradually accumulated in the berry skin throughout grape ripening, although their concentration may decrease slightly just before harvest and/or during over-maturing (Robinson & Davies, 2000). These pig-ments' profile and concentration largely vary, depending on the grape-vine cultivar (Mattivi, Guzzon, Vrhovsek, Stefanini, & Velasco, 2006), and are not even synthesized by white-berried ones (Boss, Davies, & Robinson, 1996). The main anthocyanins found in grapes are derived from cyanidin, peonidin, delphinidin, petunidin and mal-vidin. They generally occur as glycosides and acylglycosides, being malvidin-3-O-glucoside the most abundant in almost all colored grape cultivars (Fraige, Pereira-Filho, & Carrilho, 2014). Anthocyanins synth-esis follow the same multi-branched of phenylpropanoid biosynthetic pathway and UDP glucose-flavonoid 3-O– glucosyltransferase (UFGT) represents the key enzyme of this pathway, which is regulated by two Myb-related genes (Boss et al., 1996; S. K. Kobayashi, Ishimaru, Hiraoka, & Honda, 2002). It was shown that the insertion of Gret1 retrotransposon in VvMybA1 promotor gene and single nucleotide polymorphisms (SNP) in VvMybA2 gene are associated with the loss of pigmentation in white-skinned cultivars of Vitis vinifera (S. Kobayashi, Goto-Yamamoto, & Hirochika, 2004; Walker et al., 2007).
The aim of this work was to characterize, through the analysis of grape development, a set of several grape berry skin color somatic variants (previously confirmed by microsatellites), comprising different groups of colored and non-colored related cultivars, that show clear differences in the phenolic biosynthesis. To highlight the changes that occur during berry development, particularly regarding berry color, between the skin color somatic variants analyzed, a surface color analysis by CIELab colorimetric measurement was applied. A detailed HPLC-DAD analysis was also performed to study the phenolic profile, as well as, a molecular characterization of the genetic structure of berry color locus (VvMybA1 and VvMybA2 genes).
2. Material and methods 2.1. Grape cultivars and sampling
Vines of Vitis vinifera L. belonging to four different varieties (Malvasia Fina, Moscatel Galego, Pinot and Pique-poul), each one comprising related white [Malvasia Fina (MF), Moscatel Galego
Branco (MGB), Pinot Blanc (PB)] and colored-skin berried cultivars [Malvasia Fina Roxo (MFR), Moscatel Galego Roxo (MGR), Pinot Gris (PG), Pinot Noir (PN), Pique-poul Gris (PPG) and Pique-poul Noir (PPN)], were grown in the same plot, in the experimental vineyard of the University of Trás-os-Montes and Alto Douro, Vila Real (41°19′ N, 7°44′ W, 500 m above mean sea level), Baixo Corgo sub-region of the Demarcated Douro Region, northern Portugal. This vineyard was installed in 1995 and the distance between the plants and rows was 1.8 m and 1.2 m, respectively. Each cultivar was represented by six plants. All vines were grown under the same cultivation practices (spraying of crop protectants, weed control, shoot guiding). The identity of these cultivars as true berry skin color somatic variants was previously confirmed through the analysis of nuclear microsatellite markers (SSRs) (Ferreira et al., 2016).
Considering the limited number of vines for each cultivar and to assure bunches in perfect conditions until the end of maturation, one bunch was collected by cultivar in each sampling date of 2013 season, comprising four developmental stages: green (G), véraison (V), ripe (R) and harvest (H). Subsequent samplings were performed on a different vine. Small portions of each bunch were uniformly separated for the analysis of the several parameters (contents of sugars, organic acids, metals and phenolic compounds). The samples were properly separated and labeled in plastic bags onto ice and kept frozen at−20 °C until use. For molecular analyses, young leaves were collected from each skin color somatic variant, properly labeled and conserved at−80 °C until use.
2.2. Chemical analyses
Oenological properties, such as berry weight and pH were evaluated on 30 berries simultaneously. Individual berry weight was then measured as the average of the total weight obtained for the 30 berries. Contents of sugars, organic acids, metals and phenolic compounds were also determined for the four developmental stages analyzed.
2.2.1. Sugars and organic acids
D-glucose and D-fructose concentration was determined by an enzymatic procedure (D-glucose and D-fructose test kit AK00041; NZYTech, Lisbon, Portugal).
Tartaric acid was determined by the metavanadate colorimetric procedure. Tartaric acid reacted with ammonium metavanadate in a 30% v/v acetic acid solution to yield an orange-yellow color. Absorbance measurements were performed at 500 nm on a Hitachi U-2000 Double Beam Spectrophotometer. The calibration curve was established by reading the absorbance of standard solutions of tartaric acid (1–5 g/L) in the same spectrophotometer. Moreover, L-Malic acid was determined by an enzymatic procedure (L-malic acid test kit AK00011; NZYTech, Lisbon, Portugal).
2.2.2. Calcium, magnesium and potassium
Calcium (Ca), magnesium (Mg) and potassium (K) were determined by atomic absorption spectrophotometry in a Thermo iCE 3300 apparatus (Thermo Fisher Scientific, Cambridge, UK). Potassium and magnesium were measured at 766.5 nm and 285.2 nm, respectively, in a dilution of 1:200, and calcium was measured at 422.7 nm in a dilution of 1:40. Cesium chloride (0.1%) was used as ionization suppressor to potassium determination, and strontium chloride (1.0%) was used to minimize interference by phosphates in calcium determination. Calibration curves were established by reading the absorbance of standard solutions of each element (K: 2–20 mg/L Mg: 0.1–1 mg/L Ca: 1–10 mg/L).
2.2.3. Phenolic compounds
Healthy berries from each sample were lyophilized (Virtis SP Scientific Sentry 2.0 Apparatus, Gardiner, NY, USA) and then powdered in an appliance mill (model A327R1, Moulinex, Spain). The powdered
material was kept in a desiccator, in the dark, until analysis.
For phenolic compounds extraction, ca. 5 g of each dry sample was extracted with 100 mL of 80% MeOH (v/v), as previously reported (Dopico-García et al., 2008; Ferreira et al., 2016). Non-colored phe-nolics and anthocyanins fractions were after separated using SPE cartridge and each fraction was redissolved in appropriate volume of methanol (non-colored phenolics) and acidified water (pH 3.0) (antho-cyanins), membrane-filtered (0.45 μm). An aliquot of 20 μL of each fraction was posteriorly injected into an HPLC-DAD system equipped with a Spherisorb ODS2 column (25.0 cm × 0.46 cm, 5μm particle size; Waters, Milford, MA, USA).
The chromatographic analysis of the non-colored compounds was performed using the same analytical conditions that were previously reported (Dopico-García et al., 2008; Ferreira et al., 2016). Compounds were identified by comparing their retention times and UV spectra with those of authentic standards and with literature data (Dopico-García et al., 2008; Ferreira et al., 2016). Chromatograms were registered at 280 (forflavan-3-ols, syringic and gallic acids), 320 (for hydroxycin-namic acids and resveratrol-3-O-glucoside) and 350 nm (forflavonols). Quantification was performed by external standard method. Coutaric acid was determined as p-coumaric acid and the other compounds as themselves. Triplicate analyses were performed.
Anthocyanins analysis was performed as before (Dopico-García et al., 2008; Ferreira et al., 2016). Chromatograms were registered at 500 nm. Compounds were identified by comparing their chromato-graphic behavior and UV spectra with those of authentic standards and with literature data (Dopico-García et al., 2008; Ferreira et al., 2016). Quantification was performed by external standard method. Petunidin-3-O-p-coumaroylglucoside and petunidin-3-O-glucoside were quantified as petunidin; peonidin-3-O-p-coumaroylglucoside and malvidin-3-O-p-coumaroylglucoside were determined as peonidin-3-O-glucoside and malvidin-3-O-glucoside, respectively; the other compounds were deter-mined as themselves. Triplicate analyses were performed.
2.3. Colorimetric measurements
The berry skin color was measured with a Minolta CR-300 tristimulus colorimeter (Minolta Co. Ltd., Osaka, Japan) having an 8-mm-diameter viewing area. For each cultivar and sampling stage, ten berries were randomly chosen for measuring CIELab coordinates; every berry was measured four times in opposite positions. Values of L*, a*, and b* were determined to describe a three-dimensional color space. The vertical axis L* is a measure of lightness, the values ranging from darkest black (0) to brightest white (100); a* is a measure of redness (or 7a* of greenness) and b* of yellowness (or 7b* of blueness) on the hue-circle (Gonçalves et al., 2007; Voss, 1992). The average of measure-ments of 10 berries per replication was used. The hue angle (hab) or tonality, expressing the color nuance and chroma, a measure of chromaticity (C*ab), indicating the purity or saturation of the color, were calculated using the following equations: hab= tan− 1(b⁎/a⁎) and C⁎ab = (a⁎2+ b⁎2)1/2, respectively (Voss, 1992).
2.4. Statistical analyses
Principal component analysis (PCA) was carried out using SPSS® 21.0 software (IBM, NY, USA). PCA was applied for reducing the number of variables (23 variables corresponding to each identified phenolic compound to a smaller number of the new derived variables (principal components, PCs) that adequately summarize the original information, i.e., the phenolic composition of the grape berry skin color somatic variants at four different developmental stages.
Pearson correlation analysis was performed to corroborate relation-ships among color parameters and also between color parameters and phenolic profiles (significant correlations were set at P < 0.05), with Prism 6.02 (GraphPad Software, La Jolla, California, USA).
2.5. Molecular analyses
Genomic DNA was extracted from young leaves collected from each skin color somatic variant using DNeasy® Plant Mini Kit (QIAGEN, Düren, Germany) purification kit, according to the manufacturer's instructions. Extracted genomic DNA was quantified using a UV spectrometer (Nanodrop® ND-1000, Fisher Scientific, Delaware, USA), followed by quality check in a 1.0% agarose gel electrophoresis with ethidium bromide staining and photographed under UV light. Necessary dilutions were done (approximately 10 ng/μL) and kept at 4 °C for further use.
VvMybA1 and VvMybA2 gene polymorphisms (detection of func-tional and non-funcfunc-tional alleles) were investigated to understand the evolutionary events that gave origin to the color mutation of each cultivar studied.
The presence of Gret1 retroelement in the VvMybA1 promoter region (VvMybA1a allele) was performed using the primers a and d3 and PCR amplifications were performed as reported inLijavetzky et al. (2006). In order to detect the functional alleles, F2 and R1 primers were used, as recommended byAzuma et al. (2008). PCR fragments were separated by electrophoresis in 1.5% agarose gel in TBE buffer, stained with ethidium bromide and photographed under UV light.
For VMybA2 gene, two point mutations (SNP) related to berry color, VvMybA2R44 (Walker et al., 2007) and VvMybA2C22 (Carrasco et al., 2015), were investigated by a SNaPshot approach, according to the protocol provided in the ABI PRISM SNaPshot Multiplex kit (Life Technology Corporation, California, USA). PCR fragments were sepa-rated by electrophoresis in 0.8% agarose gel in TBE buffer, stained with ethidium bromide, and purified by QIAquick Gel Extraction Kit (QIA-GEN, Düren, Germany) according to the manufacturer's instructions. The SNaPshot PCR products were enzymatically treated with 1 U each of alkaline phosphatase, calf intestinal (CIP; New England Biolabs, Massachusetts, USA) to degrade excess PCR primers and dNTPs and incubated at 37 °C for 1 h, followed by 15 min at 75 °C to inactivate the enzyme. The purified SNaPshot PCR products were detected on capillary electrophoresis instrument ABI PRISM 310 Genetic Analyzer (PE Applied Biosystems, California, USA) and data analysis was performed by Peak ScannerTMSoftware v1.0.
3. Results
3.1. Evaluation of grape berry skin color somatic variants development In order to monitor the evolution of berry development, physical and biochemical parameters were analyzed at four different develop-mental stages (green, véraison, ripe and harvest) of grape berry skin somatic variants.
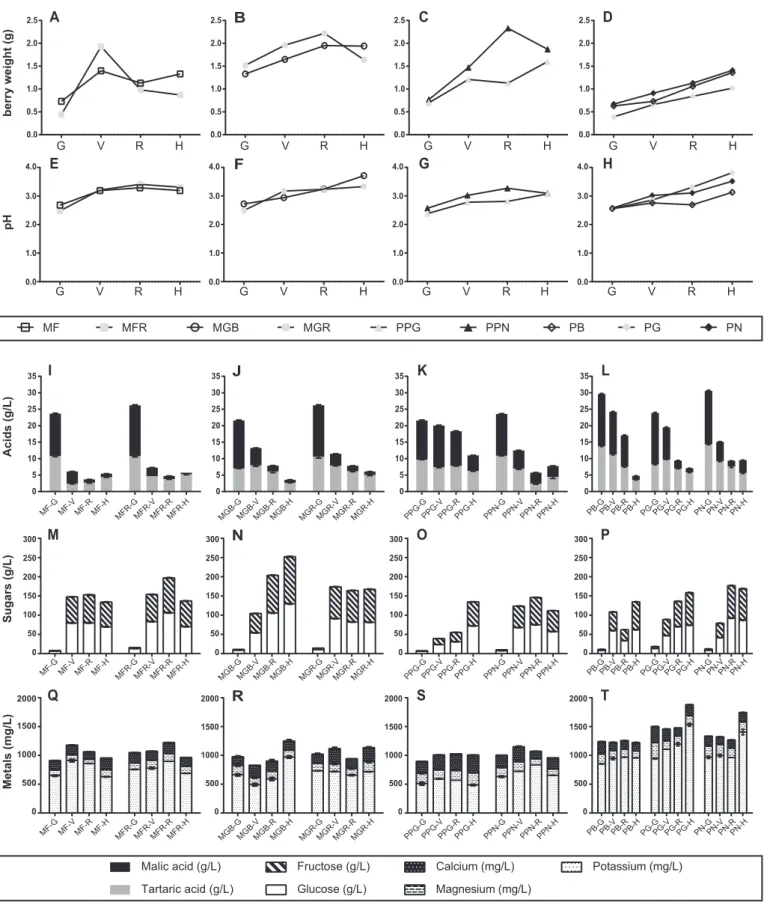
Berry weight generally followed the common pattern of increasing up to harvest (Fig. 1, A–D). Two red-skinned cultivars, Moscatel Galego Roxo and Malvasia Fina Roxo, and one black-skinned, Pique-poul Noir, were the exceptions: Malvasia Fina Roxo decreased in weight after véraison and Moscatel Galego Roxo and Pique-poul Noir decreased after ripe stage.
A similar trend was observed for pH, increasing up to harvest, with a more marked increase observed between the green and véraison stages (Fig. 1, E–H).
Sugars (glucose and fructose) and organic acids (malic and tartaric acids) showed opposite behaviors. Malic and tartaric acids concentra-tion decreased throughout maturaconcentra-tion, equally showing a more pro-nounced decrease between green and véraision stages (Fig. 1I-L). On the other hand, glucose and fructose concentration increased along the four stages, especially between green and véraison stages (Fig. 1, M–P). Nevertheless, in two black-skinned cultivars (Pinot Noir and Pique-poul Noir) and in the red-skinned cultivar Malvasia Fina Roxo, the glucose concentration slightly decreased between ripe and harvest stages.
trend along the four developmental stages. Nevertheless, higher potassium concentration was observed for all somatic variants in the four developmental stages analyzed, comparing with the remaining metals (Fig. 1, Q–T).
3.2. Phenolic compounds
As the major secondary metabolites contributing to grape berry color, phenolic compounds can be used as an effective fingerprinting
berry weight (g) MF MFR MGB MGR PPG PPN PB PG PN pH 0.0 0.5 1.0 1.5 2.0 2.5 G V R H 0.0 0.5 1.0 1.5 2.0 2.5 G V R H 0.0 0.5 1.0 1.5 2.0 2.5 G V R H 0.0 0.5 1.0 1.5 2.0 2.5 G V R H 0.0 1.0 2.0 3.0 4.0 G V R H 0.0 1.0 2.0 3.0 4.0 G V R H 0.0 1.0 2.0 3.0 4.0 G V R H 0.0 1.0 2.0 3.0 4.0 G V R H Acids (g/L) Tartaric acid (g/L) Malic acid (g/L) 0 5 10 15 20 25 30 35 MF -G MF -V MF-R MF-H MFR-GMFR-VMFR-RMFR-H 0 5 10 15 20 25 30 35 MGB-GMGB-VMGB-RMGB-H MGR-GMGR-VMGR-RMGR -H 0 5 10 15 20 25 30 35 PPG-GPPG-V PPG-R PPG -H PPN-GPPN-V PPN-R PPN-H 0 5 10 15 20 25 30 35 PG -G PG-V PG-RPG-H PN-G PN-VPN-RPN-H PB-GPB-V PB-R PB-H Sugars (g/L) Glucose (g/L) MF -G MF -V MF-R MF-H MFR -G MFR-VMFR-RMFR-H 0 50 100 150 200 250 300 MGB-GMGB-VMGB-RMGB-H MGR -G MGR-VMGR-RMGR-H 0 50 100 150 200 250 300 PPG-G PPG-V PPG-RPPG -H PPN-GPPN-V PPN-R PPN-H 0 50 100 150 200 250 300 PG -G PG-V PG-RPG-H PN-G PN-VPN-RPN-H PB-GPB-V PB-RPB-H MF-G MF-V MF -R MF-H MFR -G MF R-V MFR-RMFR-H 0 500 1000 1500 2000 Potassium (mg/L) Fructose (g/L) Calcium (mg/L) Magnesium (mg/L) MGB-GMGB-VMGB-RMGB-H MGR-GMGR-VMGR-RMGR-H 0 500 1000 1500 2000 Metals (mg/L) PPG-G PPG-VPPG-R PPG-H PPN-GPPN-V PPN-RPPN-H 0 500 1000 1500 2000 PG -G PG-VPG-RPG-H PN-G PN-VPN-R PN-H PB-GPB-VPB-R PB-H 0 500 1000 1500 2000
A
B
C
D
I
J
K
L
E
F
G
H
M
N
O
P
Q
R
S
T
0 50 100 150 200 250 300Fig. 1. Evolution of weight and biochemical parameters during berry development (MF– Malvasia Fina; MFR – Malvasia Fina Roxo; MGB – Moscatel Galego Branco; MGR – Moscatel Galego Roxo; PPG– Pique-poul Gris; PPN –Pique-poul Noir; PB – Pinot Blanc; PG – Pinot Gris; PN – Pinot Noir; G – Green; V – Véraison; R – Ripe and H – Harvest). A – D Berry weight; E – H pH; I– L Organic acids; M – P Sugars; Q – T Metals. (For interpretation of the references to color in this figure legend, the reader is referred to the web version of this article.)
Table 1 Phenolic compounds in grape skin color somatic variants during berry development (mg/kg berry, dry basis). Within parenthesis are shown the standar d deviations of three determinations. MF MFR MGB MGR G V R H G V R H GV R H GV R H TR (min.) Phenolic acids Hydroxybenzoic acids 5.2 Gal ac 25.9 (0.2) 8.1 (1.0) 8.3 (0.1) 12.9 (1.0) – 24.8 (0.6) 9.3 (0.8) 11.5 (1.1) – 11.2 (0.5) 36.4 (0.9) 13.6 (0.6) – 31.7 (1.0) 12.6 (0.2) 20.3 (1.6) 21.7 Syr ac – – – – ––– –– – –– – – – – ∑ 25.9 (0.2) 8.1 (1.0) 8.3 (0.1) 12.9 (1.0) – 24.8 (0.6) 9.3 (0.8) 11.5 (1.1) – 11.2 (0.5) 36.4 (0.9) 13.6 (0.6) – 31.7 (1.0) 12.6 (0.2) 20.3 (1.6) Hydroxycinnamic acids 8.2 Caft ac 602.6 (10.1) 127.6 (0.8) 53.5 (0.7) 192.2 (2.3) 514.8 (16.3) 106.9 (2.1) 46.4 (2.7) 164.2 (2.3) 4679.0 (114.7) 450.2 (14.5) 480.7 (8.2) 136.3 (11.9) 5028.7 (88.7) 144.5 (4.6) 163.0 (1.9) 257.4 (4.3) 11.9 Cout ac 818.5 (3.0) 136.1 (1.3) 31.1 (0.7) 123.1 (4.9) 327.6 (13.2) 105.6 (2.4) 22.3 (1.6) 106.1 (3.6) 4507.0 (107.4) 351.8 (1.7) 252.1 (5.3) 25.2 (2.1) 5228.7 (304.9) – 96.1 (1.5) 179.4 (1.5) ∑ 1421.1 (13.1) 263.7 (2.1) 84.6 (1.4) 315.3 (7.2) 842.4 (29.5) 212.5 (4.5) 68.7 (4.3) 270.3 (5.9) 9186.0 (222.1) 802.0 (16.2) 732.8 (13.5) 161.5 (14.0) 10,257.4 (393.6) 144.5 (4.6) 259.1 (3.4) 436.8 (5.8) Flavonoids Flavan-3-ols 14.7 Cat 120.4 (5.3) –– 175.2 (12.5) 892.9 (26.4) 468.1 (11.1) – 247.4 (0.2) 434.4 (15.9) – 93.2 (7.5) 8.0 (0.2) –– – – 22.2 Epicat –– – 201.9 (25.7) – 509.1 (0.7) – 186.5 (4.3) 553.6 (34.1) – 136.3 (7.3) –– – – – 24.6 Epigallocat gall –– – –– 52.7 (0.1) –– 2803.8 (157.9) –– –– – – – 37.3 Epicat gall –– – 168.1 (1.8) – 476.5 (2.9) – 140.3 (2.3) –– – – –– – – ∑ 120.4 (5.3) –– 545.2 (40.0) 892.9 (26.4) 1453.7 (14.8) – 574.2 (6.8) 3791.8 (207.9) – 229.5 (14.8) 8.0 (0.2) –– – – Flavonols 37.7 Myr-3-O -glu – nq – – ––– –– – –– – – – – 46.4 Quer-3-O -galac – 128.3 (0.7) 43.1 (0.9) 283.9 (0.4) – 216.2 (0.1) 126.6 (0.3) 344.2 (4.8) 2143.3 (48.7) 101.4 (1.2) 502.9 (12.0) 188.6 (10.8) 184.3 (3.0) a 252.7 (29.9) a 75.4 (1.1) 56.6 (0.9) a 47.3 Quer-3-O -rut – 7.8 (0.1) 2.4 (0.2) 6.9 (0.0) – 8.8 (0.2) 9.5 (0.1) 22.9 (0.3) 17.3 (0.8) 1.2 (0.1) 8.6 (0.4) 7.1 (0.5) 1.5 (0.0) 48.5 Quer-3-O -glu – 185.8 (1.5) 54.6 (2.4) 151.9 (0.3) – 207.4 (4.4) 226.3 (1.7) 463.0 (1.2) 166.5 (3.2) 18.5 (0.5) 155.3 (2.7) 140.9 (7.8) 88.2 (1.4) 58.1 (6.2) 32.0 (0.6) 37.1 (1.3) 54.4 Kaemp-3-O -glu – 40.9 (0.5) 8.2 (0.2) 19.9 (0.7) – 31.7 (0.3) 54.1 (1.3) 53.7 (1.4) 25.5 (1.3) 2.2 (0.1) 30.0 (0.7) 28.3 (0.1) – 30.4 (3.2) 6.2 (0.0) 7.0 (0.5) 55.9 Isor-3-O -glu 78.4 (4.3) 7.2 (0.0) 2.6 (0.2) 3.9 (0.3) 73.1 (3.4) nq 13.0 (1.5) 6.4 (0.4) 17.5 (0.7) – 8.0 (0.5) 5.3 (0.1) 308.1 (2.5) 45.8 (2.4) 2.0 (0.1) 3.1 (0.2) 56.5 Syr-3-O -glu – – – – ––– –– nq –– – – – – ∑ 78.4 (4.3) 329.1 (2.8) 102.7 (3.9) 446.6 (1.7) 73.1 (3.4) 432.4 (5.0) 375.4 (4.9) 836.5 (8.1) 2370.1 (54.7) 123.3 (1.9) 704.8 (16.3) 370.2 (19.3) 580.6 (6.9) 387.0 (41.7) 117.1 (1.8) 103.8 (2.9) Anthocyanins 12.3 Del-3-O -gl – – – – ––– –– – –– – – – – 14.6 Cya-3-O -glu –– – –– 38.4 (0.6) – 76.0 (2.1) –– – – –– – – 16.5 Pet-3-O -glu – – – – ––– –– – –– – – – – 19.1 Peo-3-O -glu – – – – ––– –– – –– – – – – 20.7 Mal-3-O -glu – – – – ––– –– – –– – – – – 32.1 Peon-3-O -p cmglu – – – – ––– –– – –– – – – – 32.5 Mal-3-O -p cmglu – – – – ––– –– – –– – – – – ∑ –– – –– 38.4 (0.6) – 76.0 (2.1) –– – – –– – – (continued on next page)
Table 1 (continued) MF MFR MGB MGR G V R H G V R H GV R H GV R H Stilbenes 38.9 Res-3-O -glu – 10.8 (0.1) 3.6 (0.2) 14.8 (0.1) – 10.5 (0.9) 8.2 (0.3) 16.0 (0.4) –– 2.9 (0.3) 3.4 (0.1) –– – – Total 1645.8 (22.9) 611.7 (28.9) 199.2 (5.6) 1334.8 (50.0) 1808.4 (59.3) 2172.3 (26.4) 461.6 (10.3) 1784.5 (24.4) 13,347.9 (484.7) 936.5 (18.6) 1706.4 (45.8) 556.7 (34.2) 10,837.4 (400.5) 563.2 (47.3) 388.8 (5.4) 560.9 (15.7) PPG PPN PB PG PN GV R H G V R H G V R H G V R H G V R H TR (min.) Phenolic acids Hydroxybenzoic acids 5.2 Gal ac 18.9 (1.0) 43.5 (1.5) 30.5 (0.8) 49.5 (3.5) –– 29.8 (0.4) 29.7 (0.5) ––– 6.6 (0.4) nq 8.9 (0.7) 5.5 (0.1) 8.8 (0.3) – 67.9 (1.0) 29.7 (0.1) 33.8 (2.6) 21.7 Syr ac – – – – – – –– – – – –– – – 3.5 (0.1) –– – – ∑ 18.9 (1.0) 43.5 (1.5) 30.5 (0.8) 49.5 (3.5) –– 29.8 (0.4) 29.7 (0.5) ––– 6.6 (0.4) – 8.9 (0.7) 5.5 (0.1) 12.3 (0.4) – 67.9 (1.0) 29.7 (0.1) 33.8 (2.6) Hydroxycinnamic acids 8.2 Caft ac 328.1 (13.2) 793.1 (8.0) 322.9 (6.4) 395.8 (2.0) 1371.7 (45.8) – 107.9 (0.4) 96.2 (3.9) 677.2 (65.9) 1042.3 (46.1) 466.4 (41.0) 143.0 50.4 (2.6) 580.6 (19.9) 138.5 (13.8) 86.8 (1.1) 4549.7 (114.4) 742.6 (1.6) 379.8 (7.9) 178.5 (15.7) 11.9 Cout ac 143.5 (4.9) 315.2 (3.4) 113.6 (2.6) 171.4 (2.4) 516.0 (0.3) – 43.4 (1.5) 45.0 (1.9) 470.2 (26.7) 413.8 (34.0) 132.9 (9.3) 33.9 (0.9) 42.4 (4.0) 207.4 (16.3) 46.1 (3.1) 22.5 (1.1) 2259.2 (39.3) 324.5 (4.8) 215.3 (3.6) 102.8 (8.3) ∑ 471.6 (18.1) 1108.3 (11.4) 436.5 (9.0) 567.2 (4.4) 1887.7 (46.1) – 151.3 (1.9) 141.2 (5.8) 1147.4 (92.6) 1456.1 (80.1) 599.3 (50.3) 176.9 92.8 (6.6) 788.0 (36.2) 184.6 (16.9) 109.3 (2.2) 6808.9 (153.7) 1067.1 (6.4) 595.1 (11.5) 281.3 (24.0) Flavonoids Flavan-3-ols 14.7 Cat – 138.2 (2.5) 159.8 (11.5) – 167.7 (2.0) nq – – ––– – 98.7 (0.7) 90.2 (4.2) 62.0 (1.0) – 500.3 (3.9) 969.4 (15.1) 159.7 (2.0) 111.9 (6.7) 22.2 Epicate – 86.2 (7.1) 65.9 (2.2) –– – – – – – 76.8 (4.6) –– – 34.3 (0.6) – 851.8 (19.6) 1340.5 (101.9) 87.8 (4.2) 56.4 (2.7) 24.6 Epigallocat gall – – – – – – –– – – – –– – – –– – – – 37.3 Epicat gall – 639.7 (13.3) 575.4 (10.8) – – – – – ––– – – – – – 1521.5 (97.6) 835.6 (26.2) –– ∑ – 864.1 (22.9) 801.1 (24.5) – 167.7 (2.0) –– – – – 76.8 (4.6) – 98.7 (0.7) 90.2 (4.2) 96.3 (1.6) – 2873.6 (121.1) 3145.5 (143.2) 247.5 (6.2) 168.3 (9.4) Flavonols 37.7 Myr-3-O -glu – – – – – – –– – – – –– – 2.9 (0.0) 7.6 (0.2) – 16.2 (0.4) 22.5 (0.9) 19.0 (1.7) 46.4 Quer-3-O -galac – 354.7 (4.4) 185.2 (4.4) 178.4 (1.1) 787.6 (2.9) – 127.2 (0.4) 164.5 (5.0) 65.3 (0.4) 622.1 (21.9) 131.5 (12.5) 30.6 (0.0) 109.7 (5.8) 1290.7 (7.7) 465.7 (16.3) 159.7 (0.5) 938.8 (46.3) 176.2 (1.1) 147.6 (0.6) 90.6 (7.7) 47.3 Quer-3-O -rut –– 7.2 (0.3) 7.2 (0.4) –– – 4.3 (0.1) – 4.1 (0.2) 1.5 (0.1) 1.5 (0.1) –– – 7.7 (0.1) 9.5 (0.5) 2.7 (0.1) 3.6 (0.0) 4.2 (0.4) 48.5 Quer-3-O -glu 96.0 (2.1) 145.0 (1.8) 187.9 (1.2) 180.6 (4.3) 543.8 (2.2) – 138.5 (0.2) 105.5 (3.1) 23.0 (0.7) 89.7 (1.4) 28.2 (0.7) 49.8 (0.3) 286.9 (7.8) 234.0 (7.6) 138.8 (3.2) 204.3 (1.1) 102.6 (6.1) 100.3 (1.6) 99.5 (0.9) 106.8 (7.6) 54.4 Kaemp-3-O -glu – 20.3 (0.2) 26.5 (0.4) 23.7 (0.6) 37.8 (0.1) – 19.6 (0.9) 12.9 (0.3) – 4.5 (0.5) 0.3 (0.0) 6.3 (0.2) – 21.4 (2.2) 15.7 (1.0) 25.2 (1.4) – 7.2 (0.7) 7.7 (0.3) 8.9 (0.8) 55.9 Isor-3-O -glu 400.5 (8.1) 3.1 (0.3) 179.3 (0.8) 48.8 (2.2) 1042.8 (12.5) 4.8 (0.3) 25.3 (1.0) – 170.8 (2.4) 2.7 (0.1) 1.0 (0.1) Nq 1752.9 (24.7) 13.1 (0.1) 39.1 (1.1) 17.7 (1.0) – nq 5.8 (0.2) 29.7 (2.9) 56.5 Syr-3-O -glu – 11.5 – – – – –– – – – –– – – –– – – – (continued on next page)
Table 1 (continued) PPG PPN PB PG PN GV R H G V R H G V R H G V R H G V R H (0.1) ∑ 496.5 (10.2) 534.6 (6.8) 578.9 (7.1) 431.5 (8.6) 2412.0 (17.7) 4.8 (0.3) 310.6 (2.5) 282.9 (8.5) 259.1 (24.1) 719.0 (24.1) 168.5 (13.4) 88.2 (0.6) 2149.5 (38.3) 1559.2 (17.6) 662.2 (21.6) 414.5 (4.3) 1041.4 (52.9) 302.6 (3.9) 295.4 (2.9) 269.9 (21.1) Anthocyanins 12.3 Del-3-O -glu –– – – – 0.4 (0.0) –– – – – –– – 2.2 (0.2) nq – 21.1 (0.1) 43.3 (0.8) 4.77 (0.07) 14.6 Cya-3-O -glu – 5.0 (0.0) nq nq – 1.5 (0.1) nq nq ––– – – – – nq – 20.2 (0.1) 11.4 (0.0) 2.48 (0.05) 16.5 Pet-3-O -glu –– – nq – 1.5 (0.1) nq nq ––– – – – 3.1 (0.0) nq – 74.3 (0.5) 144.9 (0.4) 23.37 (0.04) 19.1 Peo-3-O -glu – 7.8 (0.1) nq 1.97 (0.04) – 5.7 (0.1) nq nq ––– – – nq 6.5 (0.5) –– 253.2 (8.6) 114.5 (0.6) 26.96 (0.03) 20.7 Mal-3-O -glu – 0.2 (0.0) –– – 4.2 (0.0) nq nq ––– – – nq 30.4 (0.6) –– 410.4 (7.6) 689.5 (2.0) 121.48 (0.42) 32.1 Peon-3-O -p cmglu – – – – – – –– – – – –– – – –– – 9.9 (1.1) – 32.5 Mal-3-O -p cmglu – – – – – – –– – – – –– – – –– – 3.4 (0.7) – ∑ – 13.0 (0.1) – 1.97 (0.04) – 13.3 (0.2) –– – – – –– – 42.2 (1.3) –– 779.2 (16.9) 1016.9 (5.6) 179.1 (0.6) Stilbenes 38.9 Res-3-O -glu – 33.1 (0.3) 23.2 (0.6) – – – – – ––– – – – – 1.1 (0.0) – 18.8 (1.4) 5.1 (0.1) 4.7 (0.5) Total 987.0 (29.3) 2596.6 (43.0) 1870.2 (42.0) 1050.2 (16.5) 4467.4 (65.8) 18.1 (0.5) 491.7 (4.8) 453.8 (14.8) 1406.5 (116.7) 2175.1 (104.2) 844.6 (68.3) 271.7 (1.0) 2341.0 (45.6) 2446.3 (58.7) 990.8 (41.5) 537.2 (6.9) 10,723.9 (327.7) 5381.1 (172.8) 2189.7 (26.4) 937.1 (58.2) MF – Malvasia Fina; MFR – Malvasia Fina Roxo; MGB – Moscatel Galego Branco; MGR – Moscatel Galego Roxo; PPG – Pique-poul Gris; PPN –Pique-poul Noir; PB – Pinot Blanc; PG – Pinot Gris; PN – Pinot Noir G – Green; V – Véraison ;R – Ripe and H – Harvest; TR – retention time; Gallic acid (Gal ac); caftaric acid (Caft ac); coutaric acid (Cout ac); catechin (Cat); syringic acid (Syr ac); epicatechin (Epicat) ; epigallocatechin gallate (Epigallcat gall); epicatechin gallate (Epicat gall); resveratrol-3-O -glucoside (Res-3-O -glu); myricetin-3-O -glucoside (Myr-3-O -glu); quercetin-3-O -galactoside (Quer-3-O -galac); quercetin-3-O -rutinoside (Quer-3-O -rut); quercetin-3-O -glucoside (Quer-3-O -glu); kaempferol-3-O -glucoside (Kaemp-3-O -glu); isorhamnetin-3-O -glucoside (Isor-3-O -glu); syringetin-3-O -glucoside (Syr-3-O -glu); delphinidin-3-O -glucoside (Del-3-O -glu); cyanidin-3-O -glucoside (Cya-3-O -glu); petunidin-3-O -glucoside (Pet-3-O -glu); peonidin-3-O -glucoside (Peo-3-O -glu); malvidin-3-O -glucoside (Mal-3-O -glu), peonidin-3-O -p -coumaroylglucoside (Peon-3-O -p cmglu), malvidin-3-O -p -coumaroylglucoside (Mal-3-O -p cmglu). ∑ : sum of the identi fi ed polyphenolic compounds; “–“ : not detected; a Quercetin-3-O -galactoside and quercetin-3-O -rutinoside were quanti fi ed together.
tool in differentiating similar cultivars (Mattivi et al., 2006). As so, the qualitative and quantitative composition of the skin color somatic variants, regarding these secondary metabolites, was determined.
Twenty-three different compounds were identified, including two hydroxybenzoic acids, two hydroxycinnamic acids, four flavan-3-ols, sevenflavonols, seven anthocyanins and one stilbene (Table 1). The two hydroxybenzoic acids identified in this study were gallic and siringic acids, the last being exclusive of the red-skinned Pinot Gris cultivar in harvest stage. The two hydroxycinnamic acids were caftaric and coutaric acids, thefirst being the major compound in this group. Although hydroxycinnamic acids were more abundant than hydroxy-benzoic acids, both followed the same pattern, consisting in increasing levels until véraison and then a decline in the later stages. However, all skin color somatic variants analyzed revealed high levels of phenolic
acids, which were an appreciable component in non-colored cultivars. Flavan-3-ols are another important group of phenols, although they were underrepresented in the red and black-skinned cultivars Moscatel Galego Roxo and Pique-poul Noir, respectively (Table 1). Moreover, Pinot Noir revealed the highest content offlavan-3-ols (2873.6 mg/kg dried berry). Among the fourflavan-3-ols identified catechin was the main one in Malvasia Fina Roxo (892.9 mg/kg dried berry), Pique-poul Noir (167.7 mg/kg dried berry) and Pinot Gris (98.7 mg/kg dried berry), with a higher concentration in the green stage. Epicatechin revealed to be the major flavan-3-ol in Malvasia Fina (201.9 mg/kg dried berry) and Pinot Blanc (76.8 mg/kg dried berry) on harvest and ripe stages, respectively (Table 1). Epigallocatechin gallate and epica-techin gallate were the most abundant in Moscatel Galego Branco (2803.8 mg/kg dried berry) and Pinot Noir (1521.5 mg/kg dried berry),
PC2 (27.8%) PC2 (23.4%) PC2 (30.5%) PC2 (31.6%) PC1 (48.7%) PC1 (49.5%) PC1 (41.5%) PC1 (41.8%)
A
B
C
D
A1 A3 A2 B1 B2 B3 C1 D2 D1 PC1 and PC2 (76.5%) PC1 and PC2 (81.1%) PC1 and PC2 (72.0%) PC1 and PC2 (65.2%)Fig. 2. Plot of the different grape berry skin color somatic variants in the space defined by the Principal Components 1 and 2 (PC1 and PC2) obtained by Principal Component Analysis applied to their characteristic phenolic profiles at four developmental stages. Abbreviations as inTable 1.
respectively, on green stage (Table 1).
Theflavonols detected in the present study included derivatives of myricetin, quercetin, kaempferol, isorhametin and syringetin (Table 1). Quercetin-3-O-galactoside revealed to be the majorflavonol in five of the nine skin color somatic variants analyzed. Malvasia Fina Roxo exhibited quercetin-3-O-glucoside as major compound in harvest stage (463 mg/kg dried berry) and Moscatel Galego Roxo, Pique-poul Noir and Pinot Gris showed isorhametin-3-O-glucoside as the majorflavonol at the green stage (308.1 mg/kg, 1042.8 mg/kg and 1752.9 mg/kg dried berry, respectively) (Table 1). Syringetin-3-O-glucoside was exclusive of Pique-poul Gris, Pinot Blanc and Pinot Noir. On the other hand, myricetin-3-O-glucoside was only detected in Pinot Gris and Pinot Noir. Overall, total concentration offlavonols decreased during berry maturation, except for Malvasia Fina, Malvasia Fina Roxo and Pinot Gris cultivars (Table 1).
Five anthocyanins glucosides were determined (Table 1). Concern-ing to acylated compounds, only esters with p-coumaric acid were found, which revealed to be exclusive of the black-skinned Pinot Noir cultivar, at ripe stage (Table 1). As expected, anthocyanins were only found in colored cultivars. Among the black-skinned cultivars, Pinot Noir had the highest concentration at ripe stage (1016.9 mg/kg dried berry). On the other hand, Malvasia Fina Roxo contained the highest amount among the red-skinned cultivars, with 76.0 mg/kg dried berry at harvest stage. Each group of skin color somatic variants has a specific anthocyanin as major compound; malvidin-3-O-glucoside was the main anthocyanin in Pinot family (30.4 mg/kg in Pinot Gris and 689.5 mg/kg dried in Pinot Noir, both at ripe stage); peonidin-3-O-glucoside was the major compound for Pique-poul (7.8 mg/kg in Pique-poul Noir and 5.7 mg/kg dried berry in Pique-poul Gris, both at véraison) and cyanidin-3-O-glucoside in Malvasia Fina (76.0 mg/kg dried berry in Malvasia Fina Roxo at harvest stage) families (Table 1).
Resveratrol-3-O-glucoside, the only stilbene found, was noticed mainly in the last stages of the berry development. Three of the nine skin color somatic variants analyzed did not presented this compound, namely the white-skinned cultivar Pinot Blanc, the red-skinned cultivar Moscatel Galego Roxo and the black-skinned cultivar Pique-poul Noir (Table 1).
Once phenols are the main category of compounds involved in shaping of berry skin color, the HPLC-DAD data were subjected to PCA analysis to highlight the differences or similarities among the grape berry skin color somatic variants studied.
A PCA was performed for each grape berry skin color somatic variant group, representing the four varieties analyzed. The skin color somatic variants of each variety were grouped according to the grape cultivar and also on the basis of developmental stage. PCA analysis for all datasets explained between 65.2% and 81.1% of the total variations (Fig. 2).
As shown inFig. 2A, white and red-skinned Malvasia Fina cultivars were grouped close to each other by developmental stages, except for véraison. At the green stage, both cultivars grouped together, showing negative PC1 scores (group A1). Ripe stage of both white and red-skinned Malvasia Fina cultivars also formed an independent group (group A2), as well as, the harvest stage, which corresponds to the third group formed (group A3).
The green stage of both white and red-skinned Moscatel Galego cultivars has shown positive PC1 scores (group B1) (Fig. 2B). Ripe and harvest stages of the white-skinned Moscatel Galego Branco cultivars clustered together (group B2), as well as véraison, ripe and harvest stages of the red-skinned Moscatel Galego Roxo cultivar (group B3).
The PCA analysis on the Pique-poul set of cultivars revealed that the véraison stage was the only one showing a positive PC2 score (Fig. 2C), being both the red and black-skinned cultivars clearly distinguished at this stage once black-skinned Pique-poul Noir showed a negative PC1 score and the red-skinned Pique-poul Gris a positive PC1 score. The remaining stages presented negative PC2 scores, being the harvest stages of both cultivars, the green stage of Pique-poul Gris and the ripe stage of Pique-poul Noir clustered together (group C1).
All the developmental stages of the white and red-skinned cultivars, Pinot Blanc and Pinot Gris, grouped close to each other (Fig. 2D, group D1). The results also showed that ripe and harvest stages of this cultivar grouped together, with a positive PC1 score (group D2).
3.3. Colorimetric measurements
During grape maturation, skin berry color changes from an initial green, typical of the unripe grapes, to a yellow/brownish and red/blue at harvest, respectively in white and color-skinned grapes. This evolu-tion on color parameters was evaluated and results are shown in Table 2.
During maturity, a decrease in b* parameter and an increase in a* could be generally observed, i.e. a decline of green color and a rise of yellow, red or blue, giving thus a brownish and red/blue coloring to the
Table 2
Colorimetric parameters analyzed for all grape skin color variants picked at different stages of ripeness.
MF MFR MGB MGR PPG PPN PB PG PN Green L* 46.82 46.09 50.28 47.87 52.31 51.96 46.37 47.52 43.82 a* −5.28 −5.18 −7.54 −5.20 −6.89 −6.46 −6.03 −5.96 −5.29 b* 30.17 29.89 33.35 32.05 28.62 29.22 28.50 25.67 26.07 C*ab 30.63 30.34 34.19 32.47 29.44 29.93 29.13 26.35 26.60 hab 99.92 99.84 102.74 99.22 103.53 102.47 101.95 103.06 101.48 Véraison L* 54.15 55.12 57.23 49.78 55.71 51.73 47.57 48.15 40.58 a* −8.44 −2.72 −9.15 −0.38 −9.77 6.74 −6.24 −1.25 1.14 b* 29.41 25.29 31.06 30.19 27.58 17.42 22.95 25.67 14.72 C*ab 30.67 25.44 32.38 30.20 29.26 18.68 23.78 25.70 14.77 hab 106.01 96.13 106.42 90.70 109.50 68.85 105.21 92.78 85.58 Ripe L* 57.91 55.48 55.47 41.19 56.48 48.64 49.74 40.79 30.66 a* −5.71 2.88 −5.67 11.31 −8.56 3.00 −9.00 10.30 5.30 b* 27.60 25.40 30.02 21.10 26.70 14.64 27.15 12.49 2.05 C*ab 28.18 25.56 30.55 23.94 28.04 14.94 28.60 16.19 5.68 hab 101.70 83.53 100.7 61.80 107.78 78.42 108.33 50.49 21.11 Harvest L* 59.14 52.87 57.54 39.26 55.92 48.07 50.02 35.26 31.24 a* −7.36 0.45 −3.89 12.04 −4.77 5.12 −5.17 11.25 3.25 b* 27.00 27.11 33.48 21.21 23.78 16.09 25.50 5.56 −0.01 C*ab 28.02 27.71 33.70 24.39 24.25 16.88 26.02 12.55 3.25 hab 105.06 87.99 96.93 60.41 101.34 72.36 101.45 25.29 359.85
MF– Malvasia Fina; MFR – Malvasia Fina Roxo; MGB – Moscatel Galego Branco; MGR – Moscatel Galego Roxo; PPG – Pique-poul Gris; PPN – Pique-poul Noir; PB – Pinot Blanc; PG – Pinot Gris; PN– Pinot Noir; L* – lightness; a* – redness; b* – yellowness; C*ab– chroma; hab– hue angle.
skin of the white and colored cultivars, respectively. This behavior is more evident regarding the colored cultivars. In what respects to redness (a* values), values were only recorded in the red-skinned cultivars Moscatel Galego Roxo and Pinot Gris, and in the black-skinned cultivars Pique-poul Noir and Pinot Noir. Especially in the red-skinned cultivars this parameter clearly increases between véraison and ripe stages, showing an inverse trend compared to the lightness (L*), despite without significance in Moscatel Galego Roxo and Pinot Gris (Pearson's correlation =−0.920, P = 0.080 and −0.911, P = 0.089, respec-tively). Although, yellowness (b* values) showed similar values among white and color-skinned cultivars in the green stage, the highest values were obtained in white and red-skinned cultivars during all four developmental stages analyzed. The lower values were observed in the black-skinned cultivars, showing a clear decrease between véraison and ripe stages.
Chroma values (C*ab) decreased until harvest, being more evident for red and black-skinned cultivars, particularly in the black-skinned Pinot Noir cultivar from véraison until harvest, in agreement with the fall of anthocyanins. This was accompanied by changes in the values of the hue (hab), which clearly decreased not only in Pinot Noir (Pearson's correlation = 0.986, P < 0.05) from green to harvest stages but also in all colored cultivars and in Moscatel Galego Branco.
At the late developmental stage analyzed, relevant differences existed in hue, being higher in white-skinned cultivars than in red-skinned (more orange-red) and black-red-skinned cultivars (more blue-red), showing the black-skinned Pinot Noir cultivar the highest value (359.85). Moreover, chroma (C*ab) is positively correlated with b* in all cultivars, independently from skin color, showing correlation coefficients of 0.971 and 1.00 (all correlations were significant at P < 0.05). On the other hand, b* was positively correlated with hue (hab), but only in the black-skinned cultivars, correlation coefficients of 1.00 for Pinot Noir and 0.959 for Pique-poul Noir (all correlations were significant at P < 0.05) being observed. Usually, hue (hab) showed an inverse correlation with a*. However, this correlation was only observed and statistically significant for the red-skinned cultivars, with correlation coefficients of −0.972 and −0.999 for Pinot Gris and Moscatel Galego Roxo, respectively (all correlations were significant at P < 0.05).
Color differences were also calculated (ΔE*ab = [(ΔL*)2+ (Δa*)2+ (Δb*)2
]1/2) between the different developmental stages analyzed. They werefirstly calculated between green and harvest stages and, as expected, it was possible to distinguish the color between them in all cultivars, with values ofΔE*ab ≥ 4. Color differences were also calculated between green and véraison and between ripe and harvest, the last two stages. It was observed that color differences were more pronounced between green and véraison (17≥ ΔE*ab ≥ 4) then between the last two stages (8≥ ΔE*ab ≥ 2).
3.4. VvMybA1 and VvMybA2 allelic variation
The results obtained in the two different assays performed to characterize the VvMybA1 locus are found inTable 3. Thefirst assay, that allows the detection of the Gret1 retrotransposon insertion, showed the same banding pattern for black, red and white-skinned grape somatic variants, all of them amplifying a fragment corresponding to the non-functional allele VvMybA1a. The second PCR reaction, per-formed to detect the wild-type allele and other putative functional ones, highlighted different amplification profiles. For the white-skinned cultivars and for the red-skinned cultivars Malvasia Fina Roxo and Moscatel Galego Roxo, no amplification fragments were detected. Concerning the black-skinned cultivars and the red-skinned cultivars Pinot Gris and Pique-poul Gris, the wild-type allele, VvMybA1c, was amplified.
The detection of VvMybA2 polymorphisms was performed by SNaPshot assay. The allelic profiles are listed in Table 3. The SNP VvMybA2R44 or K980 showed both homozygous and heterozygous
profiles for the non-functional allele (TT and TG, 44.44 and 55.56%, respectively). As expected, all the white-skinned cultivars showed the non-functional allele (T), while the red and black-skinned cultivars showed the functional allele (G), except for the red-skinned cultivar Moscatel Galego Roxo, which revealed to be homozygous for the non-functional allele (TT). Moreover, VvMybA2C22 SNP was detected in the two black-skinned cultivars, Pinot Noir and Pique-poul Noir.
4. Discussion
4.1. Evaluation of grape berry skin color somatic variants development A complex series of physical and biochemical changes, such as modifications in size, chemical composition, color, texture, flavor and pathogen resistance occurs during grape berry development (Ali et al., 2011). However, the knowledge about the grape metabolites of skin color somatic variants is still incomplete, since this kind of cultivars has received less attention than common cultivars with different skin colors. In this context, the present work contributes for bridging this gap in knowledge by analyzing different groups of skin color somatic variants during berry development using an integrative approach.
The common pattern of berry weight development is a considerable increase up to harvest (Ali et al., 2011; Degu et al., 2014; Fortes et al., 2011). Our data confirm this pattern, as shown inFig. 1, A–D, once almost all somatic variants doubled their berry weight from green stage until harvest.
During the last berry developmental phase, pH should increase. Along with this increase, in almost all skin color somatic variants analyzed, pH also increased between green and vérasion stages, which may be related with the decline of tartaric and malic acid, resulting in an increase of overall pH (Fig. 1, E–H).
While sucrose is described as the major sugar in the green phase, glucose and fructose accumulate in the later ripe and harvest stages (Ali et al., 2011; Fortes et al., 2011), as can be observed inFig. 1, M–P, with an exponential increase from green stage.
Zhao, Zhao, Zhao, and Han (2015)observed that the bud sport of Benitaka cultivar revealed a different sugar accumulation pattern when compared with its ancestor. In our data, the red-skinned Moscatel Galego Roxo also seems to exhibit a marked difference in sugar accumulation when compared with the white-skinned variant Moscatel Galego Branco. These results should be further investigated in order to define the event that triggers and controls sugar accumulation in the berries of these skin color somatic variants.
Furthermore, the highest levels of organic acids, malic and tartaric, were detected in the green and véraison stages and decreased in ripe and harvest stages (Fig. 1, I–L). These findings are in accordance with previous reports for both acids, since their synthesis occurs until
Table 3
Allelic profiles of genotypes analyzed at VvMybA1 and VvMybA2 genes.
Cultivar Berry color VvMybA1 VvMybA2
VvMybA1a Gret1 VvMybA1c No Gret1 VvMybA2R44 VvMybA2C22 MF W + – TT TT MFR R + – TG TT MGB W + – TT TT MGR R + – TT TT PPG R + + TG TT PPN B + + TG TG PB W + – TT TT PG R + + TG TT PN B + + TG TG
MF– Malvasia Fina; MFR – Malvasia Fina Roxo; MGB – Moscatel Galego Branco; MGR – Moscatel Galego Roxo; PG– Pique-poul Gris; PPN –Pique-poul Noir PB – Pinot Blanc; PG – Pinot Gris; PN– Pinot Noir; W – white; R – red; B – black; “+” presence of allele, “–” absence of allele.
véraison and declines in the later stages (Degu et al., 2014; Fortes et al., 2011). Our data showed higher oscillations in malic acid concentration than in tartaric acid, even though both acids have revealed similar concentrations. Likewise, Conde, Silva, Fontes, and Dias (2007) ob-served a great variation on malic acid levels during berries development and maturation, in contrast to tartaric acid. The results also showed that sugar/acid ratio was inversely proportional in all skin color somatic variants analyzed.
Mineral soil composition has an important influence on grape quality and on the organoleptic properties of wine. Among the several minerals present in grape berries, potassium usually represents the most abundant cation (Conde et al., 2007). Our data is in accordance with this finding as shown inFig. 1, Q–T, once in all skin color somatic variants, potassium was the most prevalent cation, with higher amounts than calcium and magnesium.
4.2. Phenolic compounds
Taking into account the ancestor variety of the studied cultivars, previously confirmed as skin color somatic mutants of the varieties Malvasia Fina, Moscatel Galego, Pique-poul and Pinot (Ferreira et al., 2016) and the phenotypic characterization based on the colorimetric measurements, the berry color represents the main difference between the skin color somatic variants belonging to these different groups of varieties.
As color is one of the main attributes related to food acceptability in general and grapes/wines in particular, the relationships between colorimetric parameters and the phenolic profiles were explored by means of the multiple correlations applied to all the skin color somatic variants. During color development, a decrease in b* parameter and an increase in a* were generally observed, which is more evident regard-ing the colored cultivars (Table 2). Independently of the variety, the colorimetric parameters were particularly correlated with anthocyanin biosynthesis/accumulation at colored cultivars. A positive correlation was generally observed among a* parameter and anthocyanin accumu-lation, i.e., the anthocyanin biosynthesis/accumulation give rise to an increase of a* values (File S1). This indicates that cultivars became more red and less green during berry development. On the other hand, a negative correlation was observed among b* parameter and antho-cyanin accumulation, once this parameter represents the yellowness measurement (File S1). Thus, the anthocyanin biosynthesis/accumula-tion leads to the decrease of b* parameter, i.e., the development of blue color.
This inverse behavior between a* and b* parameters was particu-larly correlated with anthocyanins in Pinot Gris and Pinot Noir. In Pinot Gris, correlation was stronger with a* parameter, which is in agreement with a redder phenotype, regarding delphinidin-3-O-glucoside, peoni-din-3-O-glucoside and malvipeoni-din-3-O-glucoside biosynthesis/accumula-tion (File S1). On the other hand, in Pinot Noir a* parameter was closely correlated with two anthocyanins (petunidin-3-O-glucoside and mal-vidin-3-O-glucoside). Moreover, in Pinot Noir, a stronger correlation was observed between b* parameter and anthocyanins biosynthesis/ accumulation than in Pinot Gris, which is in accordance with its darker phenotype (File S1).
In grapes, color differences are not only due to a low/high pigment accumulation, phenolic biosynthetic dysfunctions should be also con-sidered as the result of these differences. Usually, malvidin-3-O-gluco-side (with one hydroxyl group and two methoxyl groups on the B-ring) is the main pigment in the majority of the V. vinifera fruits, as observed for the black and red-skinned Pinot Noir and Pinot Gris cultivars, reaching its maximum value at ripe stage, although notably higher in Pinot Noir (689.5 mg/kg) than in Pinot Gris (30.4 mg/kg) (Table 1). These results indicate that bothflavonoid- 3′, 5′- hydroxylase and O-methyltransferases should be particularly active in these skin color somatic variants belonging to the same variety. Moreover, at the ripe stage, Pinot Noir also revealed two acylated derivatives
(peonidin-3-O-p-coumaroylglucoside and malvidin-3-O-(peonidin-3-O-p-coumaroylglucoside), as pre-viously reported for thefirst time byFerreira et al. (2016), which were not detected at the harvest stage, a fact that allowed the clear distinction of these two stages in these black-skinned somatic variant at the PCA analysis (Fig. 2D). On the other hand, the black-skinned Pique-poul Noir cultivar seems to have a reduced functionality of flavonoid-3′,5′- hydroxylase, despite preserving the O-methyltransfer-ase activity, which results in the prevalent accumulation of peonidin-3-O-glucoside (5.7 mg/kg at véraison) (with one hydroxyl and one methoxyl group on the B-ring), as it was also observed for the red-skinned Pique-poul Gris (7.8 mg/kg) (Table 1). Besides peonidin-3-O-glucoside, the red-skinned Pique-poul Gris also synthesized cyanidin-3-O-glucoside (with two hydroxyl groups on the B-ring) at véraison stage, in a higher proportion than Pique-poul Noir, which has led to the clear distinction of these two skin color somatic variants at this stage on PCA analysis (Fig. 2C).
The red-skinned Malvasia Fina Roxo cultivar shows a clear pre-valence of cyanidin-3-O-glucoside (76.0 mg/kg at harvest stage), indicating a reduced activity of bothflavonoid-3′, 5′- hydroxylase and O-methyltransferase (Table 1). This fact showed that Malvasia Fina and Malvasia Fina Roxo are metabolically quite different, particularly from véraison stage, as observed at PCA analysis (Fig. 2A).
Moscatel Galego Roxo, with a slight red berry pigmentation (Table 2), did not present detectable amounts of anthocyanins. Never-theless, low levels of anthocyanins (with a predominance of cyanidin-3-O-glucoside– 5.1 mg/kg) have been detected in Moscatel Galego Roxo grapes sampled on a previous year (Ferreira et al., 2016). In fact, in our study, an overall decrease in the anthocyanins content has been observed for all the cultivars analyzed comparing with the data of Ferreira et al. (2016). Nevertheless, the composition and concentration of anthocyanins in grapes is a consequence of many factors, such as climate (like sunlight exposure, UV irradiation, temperature), that changes according to the year, affecting both the expression of the structural and regulatory genes (Downey, Dokoozlian, & Krstic, 2006; He et al., 2010).
It was also observed that delphinidin and petunidin derivatives were never predominant, suggesting that, when the flavonoid-3′-5′-hydro-xylase is normally functional, O-methyltransferases are generally strongly activated, which is in accordance with previously reports regarding the analysis of other pink berry grapes (Mattivi et al., 2006; Rustioni et al., 2016).
Other cultivars already described as showing a predominance of cyanidin-3-O-glucoside in its anthocyanin profile were Zibbibo nero (59.8 mg/kg) (De Lorenzis, Squadrito, Brancadoro, & Scienza, 2015) and Okuyama (82,97 mg/kg) (Azuma et al., 2009), considered rever-tant bud sports of the white-skinned Muscat of Alexandria and Italia cultivars, respectively.Rustioni et al. (2016) also described Aragatsi (52.21 mg/kg), Chardonnay Rouge (67.85 mg/kg), Faberrebe (95.73 mg/kg) and Fernand Rose (97.59 mg/kg) as berry color mutants of white varieties based on their high levels of cyanidin-3-O-glucoside. Therefore, and considering the pedigree of other cultivars showing cyanidin-3-O-glucoside as the major anthocyanin, based on the present and previous results (Ferreira et al., 2016), Malvasia Fina Roxo and Moscatel Galego Roxo, with a slightly salmon pink hue due to the prevalence of this anthocyanin, should be considered berry skin color mutant revertants of the respective white-skinned cultivars, Malvasia Fina and Moscatel Galego Branco.
Previous works also demonstrated thatflavonols, such as myricetin derivatives, were missing in white cultivars, indicating a dysfunction of theflavonoid 3′, 5′-hydroxylase associated to white berried phenotypes (Mattivi et al., 2006). Our data is in agreement with these results once none of the white-skinned variants analyzed revealed myricetin deri-vatives in their phenolic profiles.
4.3. VvMybA1 and VvMybA2 loci characterization
It has been described that white varieties lack the expression of the gene encoding UFGT (UDP-glucose:flavonol 3-O-D-glucosyltransferase), due to polymorphisms in the grape transcription factor genes (Myb-type), called VvMybA1 and VvMybA2. In the case of VvMybA1, the silencing is due to the insertion of Gret1 retrotransposon in its promotor region, while two single nucleotide mutations in the coding region of VvMybA2 lead to an amino acid substitution and a truncated protein (Carrasco et al., 2015; Alexandre Fournier-Level et al., 2009; S. Kobayashi et al., 2004; Walker et al., 2007).
As expected, the VvMybA1 locus of white-skinned berry variants analyzed in this study revealed to be homozygous, determined by the Gret1 retrotransposon insertion in the promotor region of VvMybA1 gene, while the genetic profile of colored cultivars was heterozygous at VvMybA1 locus, showing both the non-functional and the functional allele (Table 3).
The VvMybA1 genetic profiles were consistent with the berry color phenotype of each skin color somatic variants analyzed, unless for Malvasia Fina Roxo and Moscatel Galego Roxo. Despite being collected as red-skinned cultivars and the colorimetric measurements reflect their pigmentation, the genetic profiles of both red-skinned cultivars were similar to that of white-skinned cultivars. Similar results were reported by Migliaro et al. (2014), where the authors were not able to discriminate among the genetic profiles of Sauvignon Rouge and Sauvignon Blanc and Chasselas Violet and Chasselas Blanc. These cultivars were described as red/pink-skinned variants derived from a white-skinned ancestor, where the main mechanism found for color gain is the excision of Gret1, leaving the solo-3′LTR. However, unlike what has been referred for Sauvignon Rouge and Chasselas Violet by Migliaro et al. (2014), the Gret1 partial region was not detected in Malvasia Fina Roxo and Moscatel Galego Roxo, suggesting that the gain in color may be due to the occurrence of different mutational events affecting the anthocyanin biosynthetic pathway.
Among the remaining somatic variants, where the ancestor corre-sponds to a colored variety, the genetic profile of Pinot Noir and Pinot Gris resulted similar to the profile obtained byVezzulli et al. (2012)for this variety, as well as for Pique-poul Noir and Pique-poul Gris, all of them contain one copy of the functional VvMybA1c allele, thus being heterozygous at VvMybA1 locus.
Taking into account the haplogroups defined by Fournier-Level, Lacombe, Le Cunff, Boursiquot, and This (2010), considering both VvMybA1 and VvMybA2 loci, all white-skinned cultivars and the red-skinned Moscatel Galego Roxo were consistent with haplogroup ‘B’, holding the Gret1 insertion and a mutated T allele at VvMybA2R44 position, corresponding to a white haplogroup profile. Among the colored cultivars (red and black colored-skinned) the typical hap-logroup‘N’, holding no Gret1 and a functional G allele at VvMybA2R44, described as the major colored haplogroup in black berry varieties was not detected. Malvasia Fina Roxo profile corresponds to a low frequency recombined “white” haplogroup ‘Rec’, holding the Gret1 insertion and a functional G allele at VvMybA2R44, which results in an altered color (red). The remaining colored cultivars present both Gret1 insertion and a putative functional allele at VvMybA1 and a functional G allele at VvMybA2R44, not corresponding to any of the haplogroups described so far.
Although the Gret1 insertion revealed to be the main factor determining grape color, as has been previously described, the VvMybA2R44 mutation of VvMybA2 appears to play an essential role in the diversification of VvMybA, mainly contributing to the phenotypic diversity of less colored cultivars, as observed for Malvasia Fina Roxo, showing the same allelic composition than the remaining colored cultivars at VvMybA2 locus. However, our results also suggest that the genetic polymorphisms of MybA locus are not able to fully explain the color variability mainly among less colored cultivars, such as Moscatel Galego Roxo, suggesting the influence of other genes.
Another explanation to the skin color variability observed in somatic variants could be also detected using a layer-specific approach, investigating the presence of somatic mutations occurred in the cell layers (L1 and L2) of the shoot apical meristem (Migliaro et al., 2014; Vezzulli et al., 2012). This kind of approach allowed the description of different models about the generation of somatic variants, based on cases such as Cabernet Sauvignon, Pinot and Muscat of Alexandria (De Lorenzis et al., 2015; Vezzulli et al., 2012; Walker, Lee, & Robinson, 2006).
5. Conclusions
This work represents thefirst attempt to perform an integrative approach combining colorimetric, metabolic and genotypic data to improve the knowledge regarding grape berry skin color diversity using skin color somatic variants. The results showed that the initial stages, green and véraison, are metabolically very different from ripe and harvest and that véraison represents a key stage from which grape berries undergo dramatic metabolic changes, namely anthocyanin biosynthesis in colored variants.
Although Gret1 retrotransposon insertion has been identified as the major determinant for the berry skin color in all unpigmented or less pigmented variants, the genetic polymorphisms of the considered MybA locus are not able to fully explain the color variability among some red-skinned variants. Moreover, the phenotypic diversity of the skin color somatic variants analyzed is not only related to the quantitative accumulation of anthocyanins. Dysfunctions at different levels of the biosynthetic pathway are behind the color variation observed among each group of skin color somatic variants analyzed. Thus, both quantitative and qualitative differences should be taken into account to explain skin color variation.
The spontaneous emergence of skin color variation observed during grapevine domestication has provided a valuable source of diversity, considering the key importance of the berry skin color in cultivar selection and use. The data here obtained represents an important source of information regarding the biochemical characteristics of these variants that could be used for the production of novel and improved wines.
Supplementary data to this article can be found online athttp://dx. doi.org/10.1016/j.foodres.2017.03.050.
Author contributions
Conceived and designed the experiments: VF, OPC, RAG, VF, IC. Performed the experiments: VF, FF, DC, MGH, VF. Analyzed data: VF, FF. Contributed reagents/material/analysis tools: OPC, RAG, PA, PV, VF, IC. Wrote/read/approved the paper: VF, FF, DC, MGH, OPC, RAG, PA, PV, VF, IC.
Acknowledgements
This work received financial support from the Fundação para a Ciência e Tecnologia (FCT) PTDC/AGRO-PRO/120264/2010. This work also receivedfinancial support from National Funds (FCT/MEC, Fundação para a Ciência e Tecnologia/Ministério da Educação e Ciência) through project UID/QUI/50006/2013, co-financed by European Union (FEDER under the Partnership Agreement PT2020). To allfinancing sources the authors are greatly indebted. F.F. (SFRH/ BPD/98732/2013) and V.F. (SFRH/BD/96400/2013) are indebted to FCT for their grants.
References
Alcalde-Eon, C., García-Estévez, I., Martín-Baz, A., Rivas-Gonzalo, J. C., & Escribano-Bailón, M. T. (2014). Anthocyanin andflavonol profiles of Vitis vinifera L. cv Rufete grapes. Biochemical Systematics and Ecology, 53, 76–80.http://dx.doi.org/10.1016/j.
bse.2013.12.031.
Ali, K., Maltese, F., Fortes, A. M., Pais, M. S., Choi, Y. H., & Verpoorte, R. (2011). Monitoring biochemical changes during grape berry development in Portuguese cultivars by NMR spectroscopy. Food Chemistry, 124(4), 1760–1769.http://dx.doi. org/10.1016/j.foodchem.2010.08.015.
Azuma, A., Kobayashi, S., Goto-Yamamoto, N., Shiraishi, M., Mitani, N., Yakushiji, H., & Koshita, Y. (2009). Color recovery in berries of grape (Vitis vinifera L.)“Benitaka”, a bud sport of“Italia”, is caused by a novel allele at the VvmybA1 locus. Plant Science, 176(4), 470–478.http://dx.doi.org/10.1016/j.plantsci.2008.12.015.
Azuma, A., Kobayashi, S., Mitani, N., Shiraishi, M., Yamada, M., Ueno, T., ... Koshita, Y. (2008). Genomic and genetic analysis of Myb -related genes that regulate anthocyanin biosynthesis in grape berry skin. Theoretical and Applied Genetics, 117(6), 1009–1019.http://dx.doi.org/10.1007/s00122-008-0840-1.
Boss, P. K., Davies, C., & Robinson, S. P. (1996). Analysis of the expression of anthocyanin pathway genes in developing Vitis vinifera L. cv Shiraz grape berries and the implications for pathway regulation. Plant Physiology, 111(4), 1059–1066. Carrasco, D., De Lorenzis, G., Maghradze, D., Revilla, E., Bellido, A., Failla, O., &
Arroyo-García, R. (2015). Allelic variation in the VvMYBA1 and VvMYBA2 domestication genes in natural grapevine populations (Vitis vinifera subsp. sylvestris). Plant Systematics and Evolution, 301(6), 1613–1624. http://dx.doi.org/10.1007/s00606-014-1181-y.
Carrier, G., Le Cunff, L., Dereeper, A., Legrand, D., Sabot, F., Bouchez, O., ... This, P. (2012). Transposable elements are a major cause of somatic polymorphism in Vitis vinifera L. PloS One, 7(3), e32973.http://dx.doi.org/10.1371/journal.pone.0032973. Castellarin, S. D., Gambetta, G. A., Wada, H., Krasnow, M. N., Cramer, G. R., Peterlunger,
E., ... Matthews, M. A. (2015). Characterization of major ripening events during softening in grape: Turgor, sugar accumulation, abscisic acid metabolism, colour development, and their relationship with growth. Journal of Experimental Botany. (erv483).http://dx.doi.org/10.1093/jxb/erv483.
Conde, C., Silva, P., Fontes, N., & Dias, A. (2007). Biochemical changes throughout grape berry development and fruit and wine quality. Food, 1(1), 1–22.
De Lorenzis, G., Squadrito, M., Brancadoro, L., & Scienza, A. (2015). Zibibbo nero characterization, a red-wine grape revertant of muscat of Alexandria. Molecular Biotechnology, 57(3), 265–274.http://dx.doi.org/10.1007/s12033-014-9820-7. Degu, A., Hochberg, U., Sikron, N., Venturini, L., Buson, G., Ghan, R., ... Fait, A. (2014).
Metabolite and transcript profiling of berry skin during fruit development elucidates differential regulation between Cabernet Sauvignon and Shiraz cultivars at branching points in the polyphenol pathway. BMC Plant Biology, 14(1), 1–20.http://dx.doi.org/ 10.1186/s12870-014-0188-4.
Dopico-García, M. S., Fique, A., Guerra, L., Afonso, J. M., Pereira, O., Valentão, P., ... Seabra, R. M. (2008). Principal components of phenolics to characterize red Vinho Verde grapes: Anthocyanins or non-coloured compounds? Talanta, 75(5), 1190–1202.http://dx.doi.org/10.1016/j.talanta.2008.01.012.
Downey, M. O., Dokoozlian, N. K., & Krstic, M. P. (2006). Cultural practice and environmental impacts on theflavonoid composition of grapes and wine: A review of recent research. American Journal of Enology and Viticulture, 57(3), 257–268. Ferreira, V., Fernandes, F., Pinto-Carnide, O., Valentão, P., Falco, V., Martín, J. P., ...
Castro, I. (2016). Identification of Vitis vinifera L. grape berry skin color mutants and polyphenolic profile. Food Chemistry, 194, 117–127.http://dx.doi.org/10.1016/j. foodchem.2015.07.142.
Fortes, A. M., Agudelo-Romero, P., Silva, M. S., Ali, K., Sousa, L., Maltese, F., ... Pais, M. S. (2011). Transcript and metabolite analysis in Trincadeira cultivar reveals novel information regarding the dynamics of grape ripening. BMC Plant Biology, 11(1), 149.
http://dx.doi.org/10.1186/1471-2229-11-149.
Fournier-Level, A., Lacombe, T., Le Cunff, L., Boursiquot, J.-M. M., & This, P. (2010). Evolution of the VvMybA gene family, the major determinant of berry colour in cultivated grapevine (Vitis vinifera L.). Heredity, 104(4), 351–362.http://dx.doi.org/ 10.1038/hdy.2009.148.
Fournier-Level, A., Le Cunff, L., Gomez, C., Doligez, A., Ageorges, A., Roux, C., ... This, P. (2009). Quantitative genetic bases of anthocyanin variation in grape (Vitis vinifera L.
ssp. sativa) berry: A quantitative trait locus to quantitative trait nucleotide integrated study. Genetics, 183(3), 1127–1139.http://dx.doi.org/10.1534/genetics.109. 103929.
Fraige, K., Pereira-Filho, E. R., & Carrilho, E. (2014). Fingerprinting of anthocyanins from grapes produced in Brazil using HPLC-DAD-MS and exploratory analysis by principal component analysis. Food Chemistry, 145, 395–403.http://dx.doi.org/10.1016/j. foodchem.2013.08.066.
Gonçalves, B., Silva, A. P., Moutinho-Pereira, J., Bacelar, E., Rosa, E., & Meyer, A. S. (2007). Effect of ripeness and postharvest storage on the evolution of colour and anthocyanins in cherries (Prunus avium L.). Food Chemistry, 103(3), 976–984.http:// dx.doi.org/10.1016/j.foodchem.2006.08.039.
He, F., Mu, L., Yan, G.-L., Liang, N.-N., Pan, Q.-H., Wang, J., ... Duan, C.-Q. (2010). Biosynthesis of anthocyanins and their regulation in colored grapes. Molecules, 15(12), 9057–9091.http://dx.doi.org/10.3390/molecules15129057.
Kobayashi, S., Goto-Yamamoto, N., & Hirochika, H. (2004). Retrotransposon-induced mutations in grape skin color. Science, 304(5673), 982.http://dx.doi.org/10.1126/ science.1095011.
Kobayashi, S. K., Ishimaru, M. I., Hiraoka, K. H., & Honda, C. H. (2002). Myb-related genes of the Kyoho grape (Vitis labruscana) regulate anthocyanin biosynthesis. Planta, 215(6), 924–933.http://dx.doi.org/10.1007/s00425-002-0830-5.
Lijavetzky, D., Ruiz-García, L., Cabezas, J. A., De Andrés, M. T., Bravo, G., Ibáñez, A., ... Martínez-Zapater, J. M. (2006). Molecular genetics of berry colour variation in table grape. Molecular and General Genetics MGG, 276(5), 427–435.http://dx.doi.org/10. 1007/s00438-006-0149-1.
Mattivi, F., Guzzon, R., Vrhovsek, U., Stefanini, M., & Velasco, R. (2006). Metabolite profiling of grape: Flavonols and anthocyanins. Journal of Agricultural and Food Chemistry, 54(20), 7692–7702.http://dx.doi.org/10.1021/jf061538c. Migliaro, D., Crespan, M., Muñoz-Organero, G., Velasco, R., Moser, C., & Vezzulli, S.
(2014). Structural dynamics at the berry colour locus in V itis vinifera L. somatic variants. Australian Journal of Grape and Wine Research, 20(3), 485–495.http://dx. doi.org/10.1111/ajgw.12103.
Robinson, S. P., & Davies, C. (2000). Molecular biology of grape berry ripening. Australian Journal of Grape and Wine Research, 6, 175–188. http://dx.doi.org/10.1111/j.1755-0238.2000.tb00177.x.
Rustioni, L., De Lorenzis, G., Hârţa, M., & Failla, O. (2016). Pink berry grape (Vitis vinifera L.) characterization: Reflectance spectroscopy, HPLC and molecular markers. Plant Physiology and Biochemistry, 98, 138–145.http://dx.doi.org/10.1016/j.plaphy.2015. 11.018.
Torregrosa, L., Fernandez, L., Bouquet, A., Boursiquot, J. M., Pelsy, F., & Martinez-Zapater, J. M. (2011). Origins and consequences of somatic variation in grapevine. Genetics, Genomics, and Breeding of Grapes, 68–92.http://dx.doi.org/10.1201/ b10948-4.
Vezzulli, S., Leonardelli, L., Malossini, U., Stefanini, M., Velasco, R., & Moser, C. (2012). Pinot blanc and Pinot gris arose as independent somatic mutations of Pinot noir. Journal of Experimental Botany, 63(18), 6359–6369.http://dx.doi.org/10.1093/jxb/ ers290.
Voss, D. H. (1992). Relating colorimeter measurement of plant color to the Royal Horticultural Society Colour Chart. Horticultural Science, 27(12), 1256–1260. Walker, A. R., Lee, E., Bogs, J., McDavid, D. A. J., Thomas, M. R., & Robinson, S. P.
(2007). White grapes arose through the mutation of two similar and adjacent regulatory genes. Plant Journal, 49(5), 772–785. http://dx.doi.org/10.1111/j.1365-313X.2006.02997.x.
Walker, A. R., Lee, E., & Robinson, S. P. (2006). Two new grape cultivars, bud sports of Cabernet Sauvignon bearing pale-coloured berries, are the result of deletion of two regulatory genes of the berry colour locus. Plant Molecular Biology, 62(4–5), 623–635.
http://dx.doi.org/10.1007/s11103-006-9043-9.
Zhao, Y., Zhao, X., Zhao, S., & Han, N. (2015). A novel bud sport from the“Benitaka” table grape cultivar (Vitis vinifera L.) improves sugar and anthocyanin accumulation at the berry ripening stage. South African Journal of Botany, 97, 111–116.http://dx. doi.org/10.1016/j.sajb.2014.12.011.