CERN-PH-EP/2013-037 2015/04/23
CMS-HIG-13-007
Search for a standard model-like Higgs boson in the µ
+
µ
−
and e
+
e
−
decay channels at the LHC
The CMS Collaboration
∗Abstract
A search is presented for a standard model-like Higgs boson decaying to the µ+µ−
or e+e− final states based on proton-proton collisions recorded by the CMS experi-ment at the CERN LHC. The data correspond to integrated luminosities of 5.0 fb−1 at a centre-of-mass energy of 7 TeV and 19.7 fb−1 at 8 TeV for the µ+µ− search, and
of 19.7 fb−1 at 8 TeV for the e+e− search. Upper limits on the production cross sec-tion times branching fracsec-tion at the 95% confidence level are reported for Higgs bo-son masses in the range from 120 to 150 GeV. For a Higgs bobo-son with a mass of 125 GeV decaying to µ+µ−, the observed (expected) upper limit on the production
rate is found to be 7.4 (6.5+−2.81.9) times the standard model value. This corresponds to an upper limit on the branching fraction of 0.0016. Similarly, for e+e−, an upper limit of 0.0019 is placed on the branching fraction, which is≈3.7×10⁵times the
stan-dard model value. These results, together with recent evidence of the 125 GeV boson coupling to τ-leptons with a larger branching fraction consistent with the standard model, confirm that the leptonic couplings of the new boson are not flavour-universal.
Published in Physics Letters B as doi:10.1106/j.physletb.2015.03.048.
c
2015 CERN for the benefit of the CMS Collaboration. CC-BY-3.0 license ∗See Appendix A for the list of collaboration members
1
Introduction
After the discovery of a particle with a mass near 125 GeV [1–3] and properties in agreement, within current experimental uncertainties, with those expected of the standard model (SM) Higgs boson, the next critical question is to understand in greater detail the nature of the newly discovered particle. Answering this question with a reasonable confidence requires measurements of its properties and production rates into final states both allowed and dis-allowed by the SM. Beyond the standard model (BSM) scenarios may contain additional Higgs bosons, so searches for these additional states constitute another test of the SM [4]. For a Higgs boson mass, mH, of 125 GeV, the SM prediction for the Higgs to µ+µ− branching fraction, B(H → µ+µ−), is among the smallest accessible at the CERN LHC, 2.2×10⁻⁴ [5], while the
SM prediction forB(H →e+e−) of approximately 5×10⁻⁹is inaccessible at the LHC. Exper-imentally, however, H → µ+µ− and H → e+e−are the cleanest of the fermionic decays. The
clean final states allow a better sensitivity, in terms of cross section, σ, times branching frac-tion,B, than H→ τ+τ−. This means that searches for H→ µ+µ−and H → e+e−, combined
with recent strong evidence for decays of the new boson to τ+τ− [6, 7], may be used to test
if the coupling of the new boson to leptons is flavour-universal or proportional to the lepton mass, as predicted by the SM [8]. In addition, a measurement of the H→ µ+µ−decay probes
the Yukawa coupling of the Higgs boson to second-generation fermions, an important input in understanding the mechanism of electroweak symmetry breaking in the SM [9, 10]. Devia-tions from the SM expectation could also be a sign of BSM physics [11, 12]. A previous LHC search for SM H →µ+µ−has been performed by the ATLAS Collaboration and placed a 95%
confidence level (CL) upper limit of 7.0 times the rate expected from the SM at 125.5 GeV [13]. The ATLAS Collaboration has also performed a search for BSM H→ µ+µ−decays within the
context of the minimal supersymmetric standard model [14].
This paper reports on a search for a SM-like Higgs boson decaying to either a pair of muons or electrons (H → `+`−) in proton-proton collisions recorded by the CMS experiment at the
LHC. The H→ µ+µ−search is performed on data corresponding to integrated luminosities of
5.0±0.1 fb−1 at a centre-of-mass energy of 7 TeV and 19.7±0.5 fb−1 at 8 TeV, while the H →
e+e−search is only performed on the 8 TeV data. Results are presented for Higgs boson masses between 120 and 150 GeV. For mH = 125 GeV, the SM predicts 19 (95) H → µ+µ− events at
7 TeV (8 TeV), and≈2×10⁻³H→e+e−events at 8 TeV [15–18].
The H → `+`− resonance is sought as a peak in the dilepton mass spectrum, m
``, on top
of a smoothly falling background dominated by contributions from Drell–Yan production, tt production, and vector boson pair-production processes. Signal acceptance and selection effi-ciency are estimated using Monte Carlo (MC) simulations, while the background is estimated by fitting the observed m``spectrum in data, assuming a smooth functional form.
Near mH = 125 GeV, the SM predicts a Higgs boson decay width much narrower than the
dilepton invariant mass resolution of the CMS experiment. For mH =125 GeV, the SM predicts
the Higgs boson decay width to be 4.2 MeV [16], and experimental results indirectly constrain the width to be <22 MeV at the 95% CL, subject to various assumptions [19, 20]. The experi-mental resolution depends on the angle of each reconstructed lepton relative to the beam axis. For dimuons, the full width at half maximum (FWHM) of the signal peak ranges from 3.9 to 6.2 GeV (for muons with|η| < 2.1), while for electrons it ranges from 4.0 to 7.2 GeV (for
elec-trons with|η| <1.44 or 1.57< |η| <2.5).
The sensitivity of this analysis is increased through an extensive categorization of the events, using kinematic variables to isolate regions with a large signal over background (S/B) ratio from regions with smaller S/B ratios. Separate categories are optimized for the dominant Higgs
2 2 CMS detector and event reconstruction
boson production mode, gluon-fusion (GF), and the sub-dominant production mode, vector boson fusion (VBF). Higgs boson production in association with a vector boson (VH), while not optimized for, is taken into account in the H → µ+µ− analysis. The SM predicts Higgs
boson production to be 87.2% GF, 7.1% VBF, and 5.1% VH for mH = 125 GeV at 8 TeV [18].
In addition to m``, the most powerful variables for discriminating between the Higgs boson
signal and the Drell–Yan and tt backgrounds are the jet multiplicity, the dilepton transverse-momentum (p``T), and the invariant mass of the two largest transverse-momentum jets (mjj).
The gluon-gluon initial state of GF production tends to lead to more jet radiation than the quark-antiquark initial state of Drell–Yan production, leading to larger p``T and jet multiplicity. Similarly, VBF production involves a pair of forward-backward jets with a large mjjcompared
to Drell–Yan plus two-jet or tt production. Events are further categorized by their m``resolution
and the kinematics of the jets and leptons.
This paper is organized as follows. Section 2 introduces the CMS detector and event recon-struction, Section 3 describes the H→µ+µ−event selection, Section 4 the H→µ+µ−selection
efficiency, Section 5 details the systematic uncertainties included in the H → µ+µ− analysis,
Section 6 presents the results of the H → µ+µ− search, Section 7 describes the H → e+e−
search, and Section 8 provides a summary.
2
CMS detector and event reconstruction
The central feature of the CMS apparatus is a superconducting solenoid of 6 m internal diam-eter, providing a magnetic field of 3.8 T. Within the superconducting solenoid volume are a silicon pixel and strip tracker, a lead tungstate crystal electromagnetic calorimeter (ECAL), and a brass/scintillator hadron calorimeter (HCAL), each composed of a barrel and two endcap sections. Muons are measured in gas-ionization detectors embedded in the steel flux-return yoke outside the solenoid. Extensive forward calorimetry complements the coverage provided by the barrel and endcap detectors.
The first level of the CMS trigger system, composed of custom hardware processors, uses infor-mation from the calorimeters and muon detectors to select the most interesting events in a fixed time interval of less than 4 µs. The high level trigger processor farm further decreases the event rate from at most 100 kHz to less than 1 kHz, before data storage. A more detailed descrip-tion of the detector as well as the definidescrip-tion of the coordinate system and relevant kinematic variables can be found in Ref. [21].
The CMS offline event reconstruction creates a global event description by combining informa-tion from all subdetectors. This combined informainforma-tion then leads to a list of particle-flow (PF) objects [22, 23]: candidate muons, electrons, photons, and hadrons. By combining information from all subdetectors, particle identification and energy estimation performance are improved. In addition, double counting subdetector energy deposits when reconstructing different parti-cle types is eliminated.
Due to the high instantaneous luminosity of the LHC, many proton-proton interactions occur in each bunch crossing. An average of 9 and 21 interactions occur in each bunch crossing for the 7 and 8 TeV data samples, respectively. Most interactions produce particles with relatively low transverse-momentum (pT), compared to the particles produced in an H → `+`− signal
event. These interactions are termed “pileup”, and can interfere with the reconstruction of the high-pT interaction, whose vertex is identified as the vertex with the largest scalar sum of the
squared transverse momenta of the tracks associated with it. All charged PF objects with tracks coming from another vertex are then removed.
Hadronic jets are clustered from reconstructed PF objects with the infrared- and collinear-safe anti-kT algorithm [24, 25], operated with a size parameter of 0.5. The jet momentum is
de-termined as the vectorial sum of the momenta of all PF objects in the jet, and is found in the simulation to be within 5% to 10% of the true momentum over the whole pT spectrum of
in-terest and detector acceptance. An offset correction is applied to take into account the extra neutral energy clustered in jets due to pileup. Jet energy corrections are derived from the sim-ulation, and are confirmed by in-situ measurements of the energy balance in dijet, photon plus jet, and Z plus jet (where the Z-boson decays to µ+µ− or e+e−) events [26]. The jet energy
resolution is 15% at 10 GeV, 8% at 100 GeV, and 4% at 1 TeV [27]. Additional selection criteria are applied to each event to remove spurious jet-like objects originating from isolated noise patterns in certain HCAL regions.
Matching muons to tracks measured in the silicon tracker results in a relative pTresolution for
muons with 20 < pT < 100 GeV of 1.3–2.0% in the barrel and better than 6% in the endcaps.
The pTresolution in the barrel is better than 10% for muons with pTup to 1 TeV [28]. The mass
resolution for Z → µµdecays is between 1.1% and 1.9% depending on the pseudorapidity of
each muon, for|η| < 2.1. The mass resolution for Z → ee decays when both electrons are in
the ECAL barrel (endcaps) is 1.6% (2.6%) [29].
3
H
→
µ
+µ
−event selection
Online collection of events is performed with a trigger that requires at least one isolated muon candidate with pT above 24 GeV in the pseudorapidity range|η| ≤2.1. In the offline selection,
muon candidates are required to pass the “Tight muon selection” [28] and each muon trajectory is required to have an impact parameter with respect to the primary vertex smaller than 5 mm and 2 mm in the longitudinal and transverse directions, respectively. They must also have pT >15 GeV and|η| ≤2.1.
For each muon candidate, an isolation variable is constructed using the scalar sum of the transverse-momentum of particles, reconstructed as PF objects, within a cone centered on the muon. The boundary of the cone is∆R =
√
(∆η)2+ (∆φ)2 = 0.4 away from the muon, and the pT of the muon is not included in the sum. While only charged particles associated with
the primary vertex are taken into account, a correction must be applied for contamination from neutral particles coming from pileup interactions. On average, in inelastic proton-proton col-lisions, neutral pileup particles deposit half as much energy as charged pileup particles. The amount of energy coming from charged pileup particles is estimated as the sum of the trans-verse momenta of charged tracks originating from vertices other than the primary vertex, but still entering the isolation cone. The neutral pileup energy in the isolation cone is then es-timated to be 50% of this value and subtracted from the muon isolation variable. A muon candidate is accepted if the corrected isolation variable is less than 12% of the muon pT.
To pass the offline selection, events must contain a pair of opposite-sign muon candidates pass-ing the above selection, and the muon which triggered the event is required to have pT >
25 GeV. All combinations of opposite-sign pairs, where one of the muons triggers the event, are considered as dimuon candidates in the dimuon invariant mass distribution analysis. Each pair is effectively treated as a separate event, and referred to as such for the remainder of this paper. Less than 0.1% of the SM Higgs boson events and 0.005% of the background events in each category contain more than one pair of muons.
After selecting events with a pair of isolated opposite-sign muons, events are categorized ac-cording to the properties of jets. Jets reconstructed from PF objects are only considered if their
4 4 H→µ+µ−event selection efficiency
pTis greater than 30 GeV and|η| <4.7. A multivariate analysis (MVA) technique is used to
dis-criminate between jets originating from hard interactions and jets originating from pileup [30]. Dimuon events are classified into two general categories: a 2-jet category and a 0,1-jet category. The 2-jet category requires at least two jets, with pT > 40 GeV for the leading jet and pT >
30 GeV for the subleading jet. A 2-jet event must also have pmissT < 40 GeV, where pmissT is the magnitude of the vector sum of the transverse momenta of the dimuon and dijet systems. The pmissT requirement reduces the tt contamination in the 2-jet category, since tt decays also include missing transverse momentum due to neutrinos. All dimuon events not selected for the 2-jet category are placed into the 0,1-jet category where the signal is produced dominantly by GF. The 2-jet category is further divided into VBF Tight, GF Tight, and Loose subcategories. The VBF Tight category has a large S/B ratio for VBF produced events. It requires mjj > 650 GeV
and|∆η(jj)| > 3.5, where|∆η(jj)|is the absolute value of the difference in pseudorapidity be-tween the two leading jets. For a SM Higgs boson with mH=125 GeV, 79% of the signal events
in this category are from VBF production. Signal events in the 2-jet category that do not pass the VBF Tight criteria mainly arise from GF events, which contain two jets from initial-state radiation. The GF Tight category captures these events by requiring the dimuon transverse momentum (pµµT ) to be greater than 50 GeV and mjj>250 GeV. To further increase the
sensitiv-ity of this search, 2-jet events that fail the VBF Tight and GF Tight criteria are still retained in a third subcategory called 2-jet Loose.
In the 0,1-jet category, events are split into two subcategories based on the value of pµµT . The most sensitive subcategory is 0,1-jet Tight which requires pTµµ greater than 10 GeV, while the events with pTµµ less than 10 GeV are placed in the 0,1-jet Loose subcategory. The S/B ratio is further improved by categorizing events based on the dimuon invariant mass resolution as follows. Given the narrow Higgs boson decay width, the mass resolution fully determines the shape of the signal peak. The dimuon mass resolution is dominated by the muon pTresolution,
which worsens with increasing |η| [28]. Hence, events are further sorted into subcategories
based on the|η|of each muon and are labeled as “barrel” muons (B) for |η| < 0.8, “overlap”
muons (O) for 0.8≤ |η| <1.6, and “endcap” muons (E) for 1.6≤ |η| <2.1. The 0,1-jet dimuon
events are then assigned, within the corresponding Tight and Loose categories, to all possible dimuon|η|combinations. The dimuon mass resolution for each category is shown in Table 1.
Due to the limited size of the data samples, the 2-jet subcategories are not split into further subcategories according to the muon pTresolution. This leads to a total of fifteen subcategories:
three 2-jet subcategories, six 0,1-jet Tight subcategories, and six 0,1-jet Loose subcategories.
4
H
→
µ
+µ
−event selection efficiency
While the background shape and normalization are obtained from data, the selection efficiency for signal events has to be determined using MC simulation. For the GF and VBF produc-tion modes, signal samples are produced using thePOWHEG–BOXnext-to-leading-order (NLO)
generator [31–33] interfaced withPYTHIA6.4.26 [34] for parton showering. VH samples are
pro-duced usingHERWIG++ [35] and its integrated implementation of the NLO POWHEG method.
These samples are then passed through a simulation of the CMS detector, based on GEANT4 [36], that has been extensively validated on both 7 and 8 TeV data. This validation includes a com-parison of data with MC simulations of the Drell–Yan plus jets and tt plus jets backgrounds produced using MADGRAPH [37] interfaced with PYTHIA6.4.26 for parton showering. In all categories, the simulated mµµ spectra agree well with the data, for 110 < mµµ < 160 GeV.
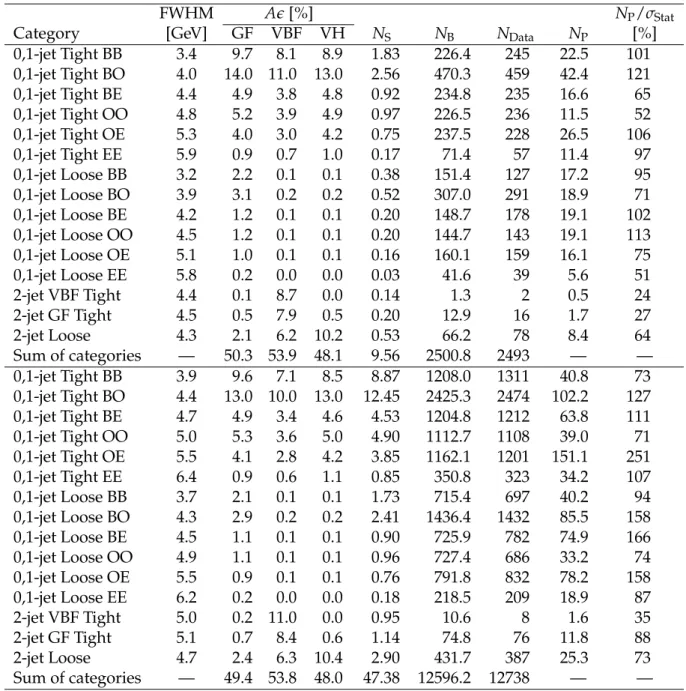
Table 1: Details regarding each of the H → µ+µ−categories. The top half of the table refers
to the 5.0±0.1 fb−1at 7 TeV, while the bottom half refers to the 19.7±0.5 fb−1at 8 TeV. Each row lists the category name, FWHM of the signal peak, acceptance times selection efficiency (Ae) for GF, Ae for VBF, Ae for VH, expected number of SM signal events in the category for mH =125 GeV (NS), number of background events within a FWHM-wide window centered on
125 GeV estimated by a signal plus background fit to the data (NB), number of observed events
within a FWHM-wide window centered on 125 GeV (NData), systematic uncertainty to account
for the parameterization of the background (NP), and NPdivided by the statistical uncertainty
on the fitted number of signal events (NP/σStat). The expected number of SM signal events is
NS = L × (σBAe)GF+ L × (σBAe)VBF+ L × (σBAe)VH, whereLis the integrated luminosity
and σBis the SM cross section times branching fraction.
FWHM Ae [%] NP/σStat
Category [GeV] GF VBF VH NS NB NData NP [%]
0,1-jet Tight BB 3.4 9.7 8.1 8.9 1.83 226.4 245 22.5 101 0,1-jet Tight BO 4.0 14.0 11.0 13.0 2.56 470.3 459 42.4 121 0,1-jet Tight BE 4.4 4.9 3.8 4.8 0.92 234.8 235 16.6 65 0,1-jet Tight OO 4.8 5.2 3.9 4.9 0.97 226.5 236 11.5 52 0,1-jet Tight OE 5.3 4.0 3.0 4.2 0.75 237.5 228 26.5 106 0,1-jet Tight EE 5.9 0.9 0.7 1.0 0.17 71.4 57 11.4 97 0,1-jet Loose BB 3.2 2.2 0.1 0.1 0.38 151.4 127 17.2 95 0,1-jet Loose BO 3.9 3.1 0.2 0.2 0.52 307.0 291 18.9 71 0,1-jet Loose BE 4.2 1.2 0.1 0.1 0.20 148.7 178 19.1 102 0,1-jet Loose OO 4.5 1.2 0.1 0.1 0.20 144.7 143 19.1 113 0,1-jet Loose OE 5.1 1.0 0.1 0.1 0.16 160.1 159 16.1 75 0,1-jet Loose EE 5.8 0.2 0.0 0.0 0.03 41.6 39 5.6 51 2-jet VBF Tight 4.4 0.1 8.7 0.0 0.14 1.3 2 0.5 24 2-jet GF Tight 4.5 0.5 7.9 0.5 0.20 12.9 16 1.7 27 2-jet Loose 4.3 2.1 6.2 10.2 0.53 66.2 78 8.4 64 Sum of categories — 50.3 53.9 48.1 9.56 2500.8 2493 — — 0,1-jet Tight BB 3.9 9.6 7.1 8.5 8.87 1208.0 1311 40.8 73 0,1-jet Tight BO 4.4 13.0 10.0 13.0 12.45 2425.3 2474 102.2 127 0,1-jet Tight BE 4.7 4.9 3.4 4.6 4.53 1204.8 1212 63.8 111 0,1-jet Tight OO 5.0 5.3 3.6 5.0 4.90 1112.7 1108 39.0 71 0,1-jet Tight OE 5.5 4.1 2.8 4.2 3.85 1162.1 1201 151.1 251 0,1-jet Tight EE 6.4 0.9 0.6 1.1 0.85 350.8 323 34.2 107 0,1-jet Loose BB 3.7 2.1 0.1 0.1 1.73 715.4 697 40.2 94 0,1-jet Loose BO 4.3 2.9 0.2 0.2 2.41 1436.4 1432 85.5 158 0,1-jet Loose BE 4.5 1.1 0.1 0.1 0.90 725.9 782 74.9 166 0,1-jet Loose OO 4.9 1.1 0.1 0.1 0.96 727.4 686 33.2 74 0,1-jet Loose OE 5.5 0.9 0.1 0.1 0.76 791.8 832 78.2 158 0,1-jet Loose EE 6.2 0.2 0.0 0.0 0.18 218.5 209 18.9 87 2-jet VBF Tight 5.0 0.2 11.0 0.0 0.95 10.6 8 1.6 35 2-jet GF Tight 5.1 0.7 8.4 0.6 1.14 74.8 76 11.8 88 2-jet Loose 4.7 2.4 6.3 10.4 2.90 431.7 387 25.3 73 Sum of categories — 49.4 53.8 48.0 47.38 12596.2 12738 — —
6 5 H→µ+µ−systematic uncertainties
simulated signal sample to correct for discrepancies between the detector simulation and data. These scale factors are estimated using the “tag-and-probe” technique [28]. The detector simu-lation and data typically agree to within 1% on the muon identification efficiency, to within 2% on the muon isolation efficiency, and to within 5% on the muon trigger efficiency.
The overall acceptance times selection efficiency for the H → µ+µ− signal depends on the
mass of the Higgs boson. For a Higgs boson mass of 125 GeV, the acceptance times selection efficiencies are shown in Table 1.
5
H
→
µ
+µ
−systematic uncertainties
Since the statistical analysis is performed on the dimuon invariant mass spectrum, it is neces-sary to categorize the sources of systematic uncertainties into “shape” uncertainties that change the shape of the dimuon invariant mass distribution, and “rate” uncertainties that affect the overall signal yield in each category.
The only relevant shape uncertainties for the signal are related to the knowledge of the muon momentum scale and resolution and they affect the width of the signal peak by 3%. The signal shape is parameterized by a double-Gaussian (see Section 6) and this uncertainty is applied by constraining the width of the narrower Gaussian. The probability density function used to constrain this nuisance parameter in the limit setting procedure is itself a Gaussian with its mean set to the nominal value and its width set to 3% of the nominal value.
Rate uncertainties in the signal yield are evaluated separately for each Higgs boson produc-tion process and each centre-of-mass energy. These uncertainties are applied using log-normal probability density functions as described in Ref. [38]. Table 2 shows the relative systematic uncertainties in the signal yield for mH=125 GeV, with more detail given below.
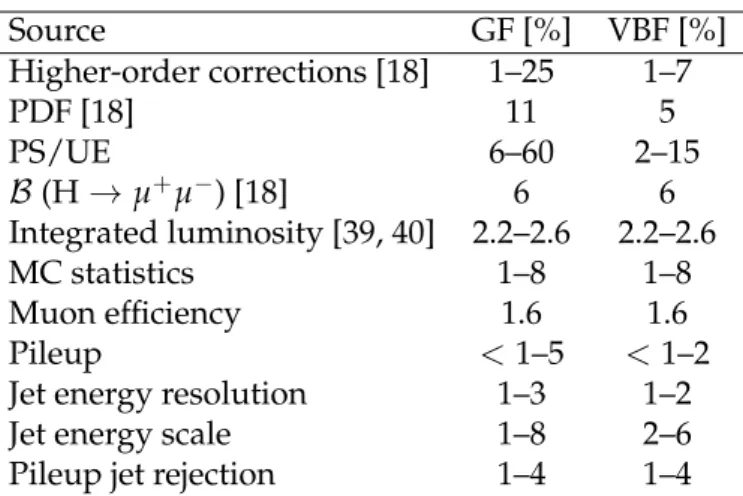
Table 2: The relative systematic uncertainty in the H→µ+µ−signal yield is listed for each
un-certainty source. Uncertainties are shown for the GF and VBF Higgs boson production modes. The systematic uncertainties vary depending on the category and centre-of-mass energy.
Source GF [%] VBF [%] Higher-order corrections [18] 1–25 1–7 PDF [18] 11 5 PS/UE 6–60 2–15 B(H→µ+µ−) [18] 6 6 Integrated luminosity [39, 40] 2.2–2.6 2.2–2.6 MC statistics 1–8 1–8 Muon efficiency 1.6 1.6 Pileup <1–5 <1–2 Jet energy resolution 1–3 1–2 Jet energy scale 1–8 2–6 Pileup jet rejection 1–4 1–4
To estimate the theoretical uncertainty in the signal production processes due to neglected higher-order quantum corrections, the renormalization and factorization scales are varied si-multaneously by a factor of two up and down from their nominal values. This leads to an uncertainty in the cross section and acceptance times efficiency which depends on the mass of the Higgs boson. The uncertainty is largest in the 2-jet VBF Tight and GF Tight categories, and smallest in the 0,1-jet Tight categories.
Uncertainty in the knowledge of the parton distribution functions (PDFs) also leads to un-certainty in the signal production process. This unun-certainty is estimated using the PDF4LHC prescription [41, 42] and the CT10 [43], MSTW2008 [44], and NNPDF 2.3 [45] PDF sets provided by theLHAPDF package version 5.8.9 [46]. The value of the uncertainty depends on the mass
of the Higgs boson, while the dependence on the category is small.
Uncertainty in the modeling of the parton showers and underlying event activity (PS/UE) may affect the kinematics of selected jets. This uncertainty is estimated by comparing various tunes of the relevantPYTHIAparameters. The D6T [47], P0 [48], ProPT0, and ProQ20 [49] tunes are compared with the Z2* [47] tune, which is the nominal choice. The uncertainty is larger in the 2-jet categories than in the 0,1-jet categories. Large uncertainties in the 2-jet categories are expected for the GF production mode, since two-jet events are simulated solely by parton showering in thePOWHEG–PYTHIANLO samples.
Misidentification of “hard jets” (jets originating from the hard interaction) as “pileup jets” (jets originating from pileup interactions) can lead to migration of signal events from the 2-jet cate-gory to the 0,1-jet catecate-gory. Events containing a Z-boson, tagged by its dilepton decay, recoiling against a jet provide a pure source of hard jets similar to the Higgs boson signal. Data events may then be used to estimate the misidentification rate of the MVA technique used to discrim-inate between hard jets and pileup jets using data [30]. A pure source of hard jets is found by selecting events with pZT > 30 GeV and jets where|∆φ(Z, j)| >2.5 and 0.5< pjT/pZT <1.5. The misidentification rate of these jets as pileup jets is compared in data and simulation, and the difference taken as a systematic uncertainty.
There are several additional uncertainties. The theoretical uncertainty in the branching fraction to µ+µ−is taken from Ref. [18], and depends on the Higgs boson mass. The uncertainty in the
luminosity is directly applied to the signal yield in all categories. The signal yield uncertainty due to the limited size of the simulated event samples depends on the category, and is listed as “MC statistics” in Table 2. There is a small uncertainty associated with the “tag-and-probe” technique used to determine the data to simulation muon efficiency scale factors [28]. This uncertainty is labeled “Muon efficiency” in Table 2. A systematic uncertainty in the knowledge of the pileup multiplicity is evaluated by varying the total cross section for inelastic proton-proton collisions. The acceptance and selection efficiency of the jet-based selections are affected by uncertainty in the jet energy resolution and absolute jet energy scale calibration [26]. For VH production, only rate uncertainties in the production cross section due to quantum corrections and PDFs are considered. They are 3% or less [18].
When estimating each of the signal yield uncertainties, attention is paid to the sign of the yield variation in each category. Categories that vary in the same direction are considered fully correlated while categories that vary in opposite directions are considered anticorrelated. These correlations are considered between all categories at both beam energies for all of the signal yield uncertainties except for the luminosity uncertainty and the uncertainty caused by the limited size of the simulated event samples. The luminosity uncertainty is considered fully correlated between all categories, but uncorrelated between the two centre-of-mass energies. The MC simulation statistical uncertainty is considered uncorrelated between all categories and both centre-of-mass energies.
To account for the possibility that the nominal background parameterization may imperfectly describe the true background shape, an additional systematic uncertainty is included. This uncertainty is implemented as a floating additive contribution to the number of signal events, constrained by a Gaussian probability density function with mean set to zero and width set
8 6 H→µ+µ−results
to the systematic uncertainty. This systematic uncertainty is estimated by checking the bias in terms of the number of signal events that are found when fitting the signal plus nominal back-ground model (see Section 6) to pseudo-data generated from various alternative backback-ground models, including polynomials, that were fit to data. Bias estimates are performed for Higgs boson mass points from 120 to 150 GeV. The uncertainty estimate is then taken as the maxi-mum absolute value of the bias of all of the mass points and all of the alternative background models. It is then applied uniformly to all Higgs boson masses. The estimates of the uncer-tainty in the parameterization of the background (NP) are shown in Table 1 for each category.
The effect of this systematic uncertainty is larger than all of the others. The expected limit (see Section 6) would be 20% lower at mH = 125 GeV without the systematic uncertainty in the
parameterization of the background.
6
H
→
µ
+µ
−results
To estimate the signal rate, the dimuon invariant mass (mµµ) spectrum is fit with the sum of
parameterized signal and background shapes. This fit is performed simultaneously in all of the categories. Since in the mass range of interest the natural width of the Higgs boson is narrower than the detector resolution, the mµµshape is only dependent on the detector
resolu-tion and QED final state radiaresolu-tion. A double-Gaussian funcresolu-tion is chosen to parameterize the shape of the signal. The parameters that specify the signal shape are estimated by fitting the double-Gaussian function to simulated signal samples. A separate set of signal shape parame-ters are used for each category. The background shape, dominated by the Drell–Yan process, is modeled by a function, f(mµµ), that is the sum of a Breit–Wigner function and a 1/m2µµ term,
to model the Z-boson and photon contributions, both multiplied by an exponential function to approximate the effect of the PDF on the mµµ distribution. This function is shown in the
following equation, and involves the parameters λ, β, mZ, andΓ:
f(mµµ) =βC1e−λmµµ 1 (mµµ−mZ)2+ Γ 2 4 + (1−β)C2e−λmµµ 1 m2 µµ . (1)
The coefficients C1and C2are set to ensure the integral of each of the two terms is normalized
to unity in the mµµ fit range, 110 to 160 GeV. Each category uses a different set of background
parameters. Before results are extracted, the mass and width of the Z-boson peak, mZ andΓ,
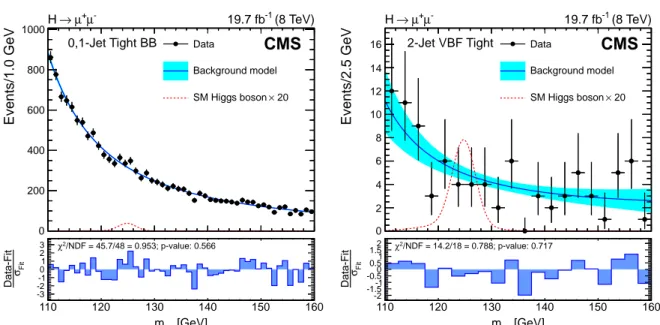
are estimated by fitting a Breit–Wigner function to the Z-boson mass peak region (88–94 GeV) in each category. The other parameters, λ and β, are fit simultaneously with the amount of signal in the signal plus background fit. Besides the Drell–Yan process, most of the remain-ing background events come from tt production. The background parameterization has been shown to fit the dimuon mass spectrum well, even when it includes a large tt fraction. Fits of the background model to data (assuming no signal contribution) are presented in Fig. 1 for the most sensitive categories: the 0,1-jet Tight category with both muons reconstructed in the barrel region and the 2-jet VBF Tight category.
Results are presented in terms of the signal strength, which is the ratio of the observed (or ex-pected) σB, to that predicted in the SM for the H→µ+µ−process. Results are also presented,
for mH = 125 GeV, in terms of σB, andB. No significant excess is observed. Upper limits at
the 95% CL are presented using the CLscriterion [50, 51]. They are calculated using an
asymp-totic profile likelihood ratio method [38, 52, 53] involving dimuon mass shapes for each signal process and for background. Systematic uncertainties are incorporated as nuisance parameters and treated according to the frequentist paradigm [38].
[GeV] µ µ m Events/1.0 GeV 0 200 400 600 800 1000 Data Background model 20 × SM Higgs boson CMS -µ + µ → H 19.7 fb-1 (8 TeV) 0,1-Jet Tight BB [GeV] µ µ m 110 120 130 140 150 160 Fit σ Data-Fit -3 -2-1 01 2 3 χ2/NDF = 45.7/48 = 0.953; p-value: 0.566 [GeV] µ µ m Events/2.5 GeV 0 2 4 6 8 10 12 14 16 Data Background model 20 × SM Higgs boson CMS -µ + µ → H 19.7 fb-1 (8 TeV) 2-Jet VBF Tight [GeV] µ µ m 110 120 130 140 150 160 Fit σ Data-Fit -2 -1.5-1 -0.50 0.51 1.52 χ2/NDF = 14.2/18 = 0.788; p-value: 0.717
Figure 1: The dimuon invariant mass at 8 TeV and the background model are shown for the 0,1-jet Tight category when both muons are reconstructed in the barrel (left) and the 2-jet VBF Tight category (right). A best fit of the background model (see text) is shown by a solid line, while its fit uncertainty is represented by a lighter band. The dotted line illustrates the expected SM Higgs boson signal enhanced by a factor of 20, for mH = 125 GeV. The lower histograms
show the residual for each bin (Data-Fit) normalized by the Poisson statistical uncertainty of the background model (σFit). Also given are the sum of squares of the normalized residuals (χ2)
divided by the number of degrees of freedom (NDF) and the corresponding p-value assuming the sum follows the χ2distribution.
10 6 H→µ+µ−results
95% CL upper limits on the signal strength at 125 GeV are 22.4 using the 7 TeV data and 7.0 using the 8 TeV data. The corresponding background-only expected limits are 16.6+−7.34.9 using the 7 TeV data and 7.2+−3.22.1using the 8 TeV data. Accordingly, the combined observed limit for 7 and 8 TeV is 7.4, while the background-only expected limit is 6.5+−2.81.9. This corresponds to an observed upper limit onB(H→ µ+µ−)of 0.0016, assuming the SM cross section. The best fit
value of the signal strength for a Higgs boson mass of 125 GeV is 0.8+−3.53.4. We did not restrict the fit to positive values, to preserve the generality of the result.
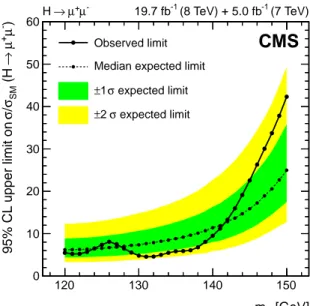
Exclusion limits in terms of σ(8 TeV)B using only 8 TeV data are shown in Fig. 3 (left). The relative contributions of GF, VBF, and VH are assumed to be as predicted in the SM, and the-oretical uncertainties on the cross sections and branching fractions are omitted. At 125 GeV, the observed 95% CL upper limit on σ(7 TeV)B using only 7 TeV data is 0.084 pb, while the background-only expected limit is 0.062+−0.0260.018pb. Using only 8 TeV data, the observed limit on
σ(8 TeV)Bis 0.033 pb, while the background-only expected limit is 0.034+−0.0140.010pb.
[GeV] H m 120 130 140 150 ) -µ + µ → (H SM σ / σ 9 5 % C L u p p e r lim it o n 0 10 20 30 40 50 60 Observed limit Median expected limit
expected limit σ 1 ± expected limit σ 2 ±
CMS
-µ + µ → H 19.7 fb-1 (8 TeV) + 5.0 fb-1 (7 TeV)Figure 2: Mass scan for the background-only expected and observed combined exclusion limits. Exclusion limits on individual production modes may also be useful to constrain BSM models that predict H → µ+µ− production dominated by a single mode. Limits are presented on
the signal strength using a combination of 7 and 8 TeV data and on σ(8 TeV)B using only the 8 TeV data. The observed 95% CL upper limit on the GF signal strength, assuming the VBF and VH rates are zero, is 13.2, while the background-only expected limit is 9.8+−4.42.9. Similarly, the observed upper limit on the VBF signal strength, assuming the GF and VH rates are zero, is 11.2, while the background-only expected limit is 13.4+−6.64.2. The observed upper limit on
σGF(8 TeV)B is 0.056 pb and expected limit is 0.045+−0.0190.013pb, using only 8 TeV data. Similarly,
the observed upper limit on σVBF(8 TeV)Bis 0.0036 pb and the expected limit is 0.0050+−0.00240.0015pb,
using only 8 TeV data.
For mH = 125 GeV, an alternative H → µ+µ− analysis was performed to check the results
of the main analysis. It uses an alternative muon isolation variable based only on tracker in-formation, an alternative jet reconstruction algorithm (the jet-plus-track algorithm [54]), and an alternative event categorization. The event categorization contains similar 2-jet categories to the main analysis, while separate categories are utilized for 0-jet and 1-jet events. Dimuon mass resolution-based categories are not used, but the 0-jet category does contain two
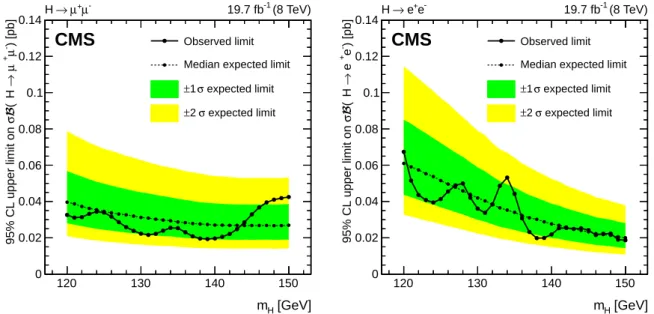
[GeV] H m 120 130 140 150 ) [pb] -µ + 95% CL upper limit on σ B ( H → µ 0 0.02 0.04 0.06 0.08 0.1 0.12 0.14 Observed limit Median expected limit
expected limit σ 1 ± expected limit σ 2 ±
CMS
-µ + µ → H 19.7 fb-1 (8 TeV) [GeV] H m 120 130 140 150 ) [pb] -e + 95% CL upper limit on σ B ( H → e 0 0.02 0.04 0.06 0.08 0.1 0.12 0.14 Observed limit Median expected limitexpected limit σ 1 ± expected limit σ 2 ±
CMS
-e + e → H 19.7 fb-1 (8 TeV)Figure 3: Exclusion limits on σB are shown for H → µ+µ− (left), and for H → e+e−(right),
both for 8 TeV. Theoretical uncertainties on the cross sections and branching fraction are omit-ted, and the relative contributions of GF, VBF, and VH are as predicted in the SM.
categories separated by pTµµ. As in the main analysis, results are extracted by fitting signal and background shapes to the mµµ spectra in each category, but unlike the main analysis,
f(mµµ) = exp(p1mµµ)/(mµµ−p2)2 is used as the background shape. The systematic
uncer-tainty on the parameterization of the background is estimated and applied in the same way as in the main analysis. For the alternative analysis, the observed (expected) 95% CL upper limit on the signal strength is 7.8 (6.5+−2.81.9) for the combination of 7 TeV and 8 TeV data and mH = 125 GeV. The observed limits of both the main and alternative analyses are within one
standard deviation of their respective background-only expected limits, for mH=125 GeV.
7
Search for Higgs boson decays to e
+e
−In the SM, the branching fraction of the Higgs boson into e+e− is tiny, because the fermionic decay width is proportional to the mass of the fermion squared. This leads to poor sensitivity to SM production for this search when compared to the search for H → µ+µ−. On the other
hand, the sensitivity in terms of σBis similar to H→ µ+µ−, because dielectrons and dimuons
share similar invariant mass resolutions, selection efficiencies, and backgrounds. Since the sensitivity to the SM rate of H → e+e− is so poor, an observation of the newly discovered particle decaying to e+e−with the current integrated luminosity would be evidence of physics beyond the standard model.
In a similar way to the H → µ+µ−analysis, a search in the mee spectrum is performed for a
narrow peak over a smoothly falling background. The irreducible background is dominated by Drell–Yan production, with smaller contributions from tt and diboson production. Misidenti-fied electrons make up a reducible background that is highly suppressed by the electron iden-tification criteria. The reducible H → γγ background is estimated from simulation to be
neg-ligible compared to other backgrounds, although large compared to the SM H→ e+e−signal. The overall background shape and normalization are estimated by fitting the observed mee
spectrum in data, assuming a smooth functional form, while the signal acceptance times selec-tion efficiency is estimated from simulaselec-tion. The analysis is performed only on proton-proton
12 7 Search for Higgs boson decays to e+e−
collision data collected at 8 TeV, corresponding to an integrated luminosity of 19.7±0.5 fb−1. The trigger selection requires two electrons, one with transverse energy, ET, greater than 17 GeV
and the other with ET greater than 8 GeV. These electrons are required to be isolated with
re-spect to additional energy deposits in the ECAL, and to pass selections on the ECAL cluster shape. In the offline selection, electrons are required to be inside the ECAL fiducial region:
|η| <1.44 (barrel) or 1.57< |η| <2.5 (endcaps). Their energy is estimated by the same
multi-variate regression technique used in the CMS H→ZZ analysis [55], and their ETis required to
be greater than 25 GeV. Electrons are also required to satisfy standard CMS identification and isolation requirements, which correspond to a single electron efficiency of around 90% in the barrel and 80% in the endcaps [56].
To improve the sensitivity of the search we separate the sample into four distinct categories: two 0,1-jet categories and two for which a pair of jets is required. The two 2-jet categories are designed to select events produced via the VBF process. The two jets are required to have an invariant mass greater than 500 (250) GeV for the 2-jet Tight (Loose) category, pT >30(20)GeV, |∆η(jj)| >3.0,|∆φ(jj, e+e−)| >2.6, and|z| = |η(e+e−) − [η(j1) +η(j2)]/2| < 2.5 [57]. The cut
on z ensures that the dielectron is produced centrally in the dijet reference frame, which helps to enhance the VBF signal over the Drell–Yan background. More details on the selection can be found in Ref. [58]. The rest of the events are classified into two 0,1-jet categories. To exploit the better energy resolution of electrons in the barrel region, these categories are defined as: both electrons in the ECAL barrel (0,1-jet BB) or at least one of them in the endcap (0,1-jet Not BB). For each category, the FWHM of the expected signal peak, expected number of SM signal events for mH = 125 GeV, acceptance times selection efficiency, number of background events
near 125 GeV, and number of data events near 125 GeV are shown in Table 4.
Data have been compared to the simulated Drell–Yan and tt background samples described in Section 4. In all categories, the dielectron invariant mass spectra from 110 to 160 GeV agree well, and the normalizations agree within 4.5%. Using simulation, the reducible background of H → γγ events has also been estimated. For mH = 125 GeV, 0.23 SM H → γγevents are
expected to pass the dielectron selection compared to about 10−3events for the SM H→e+e− signal. While this background is much larger than the SM H → e+e− signal, it is negligible compared to the Drell–Yan and tt backgrounds in each category.
Results are extracted from the data for mHvalues between 120 and 150 GeV by fitting the mass
spectra of the four categories in the range 110 < mee < 160 GeV. The parameterizations used
for the signal and background are the same as used in the µ+µ− search, a double-Gaussian
function and Eq. (1), respectively. Background-only meefits to data are shown in Fig. 4 for the
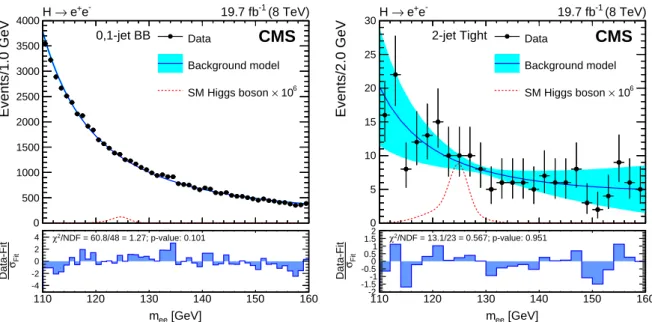
0,1-jet BB and 2-jet Tight categories.
Systematic uncertainties are estimated and incorporated into the results using the same meth-ods as in the µ+µ−search (see Section 5). Table 3 lists the systematic uncertainties in the signal
yield. The pileup modeling, pileup jet rejection, and MC statistics systematic uncertainties are small and neglected for the e+e−search. The systematic uncertainties due to the jet energy
res-olution and absolute jet energy scale are combined and listed as “Jet energy scale” in Table 3. The uncertainty related to the choice of background parameterization in terms of the number of signal events (NP) is shown in Table 4. This systematic uncertainty is larger than all of the
others, and removing it would lower the expected limit by 28%, for mH =125 GeV.
No significant excess of events is observed. Upper limits on σ(8 TeV)BandBare reported. The observed 95% CL upper limit on σ(8 TeV)B at 125 GeV is 0.041 pb while the background-only expected limit is 0.052+−0.0220.015pb. Assuming the SM production cross section, this corresponds to
[GeV] ee m Events/1.0 GeV 0 500 1000 1500 2000 2500 3000 3500 4000 Data Background model 6 10 × SM Higgs boson CMS -e + e → H 19.7 fb-1 (8 TeV) 0,1-jet BB [GeV] ee m 110 120 130 140 150 160 Fit σ Data-Fit -4 -2 0 2 4 χ2/NDF = 60.8/48 = 1.27; p-value: 0.101 [GeV] ee m Events/2.0 GeV 0 5 10 15 20 25 30 Data Background model 6 10 × SM Higgs boson CMS -e + e → H 19.7 fb-1 (8 TeV) 2-jet Tight [GeV] ee m 110 120 130 140 150 160 Fit σ Data-Fit -2 -1.5-1 -0.50 0.51 1.52 χ2/NDF = 13.1/23 = 0.567; p-value: 0.951
Figure 4: The dielectron invariant mass at 8 TeV and the background model are shown for the 0,1-jet BB (left) and 2-jet Tight (right) categories. A best fit of the background model (see Section 6) is shown by a solid line, while its fit uncertainty is represented by a lighter band. The dotted line illustrates the expected SM Higgs boson signal enhanced by a factor of 106, for mH =125 GeV. The lower histograms show the residual for each bin (Data-Fit) normalized by
the Poisson statistical uncertainty of the background model (σFit). Also given are the sum of
squares of the normalized residuals (χ2) divided by the number of degrees of freedom (NDF) and the corresponding p-value assuming the sum follows the χ2distribution.
Table 3: The relative systematic uncertainty in the H→e+e−signal yield is listed for each un-certainty source. Uncertainties are shown for the GF and VBF Higgs boson production modes. The systematic uncertainties vary depending on the category and centre-of-mass energy.
Source GF [%] VBF [%] Higher-order corrections [18] 8–18 1–7 PDF [18] 11 5 PS/UE 6–42 3–10 Integrated luminosity [40] 2.6 2.6 Electron efficiency 2 2 Jet energy scale <1–11 2–3
14 8 Summary
an observed upper limit on B(H → e+e−)of 0.0019, which is approximately 3.7×10⁵ times the SM prediction. Upper limits on σ(8 TeV)B are shown for Higgs boson masses from 120 to 150 GeV at the 95% CL in Fig. 3 ( right).
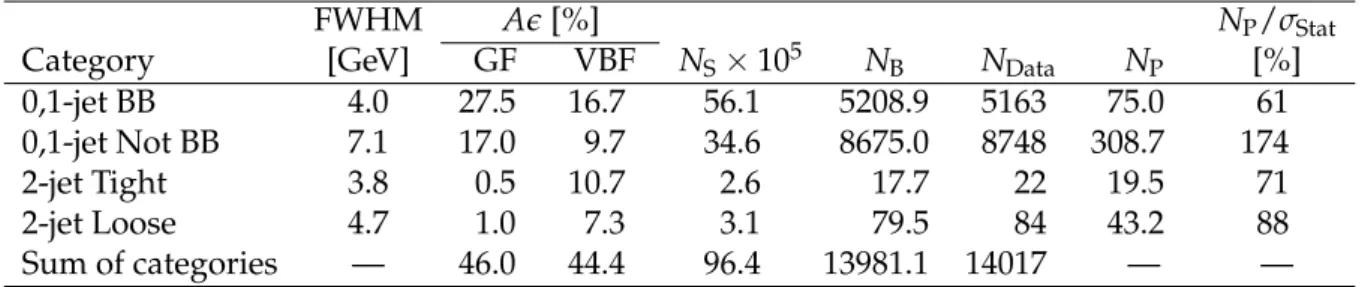
Table 4: Details regarding each category of the H→e+e−analysis, for 19.7±0.5 fb−1at 8 TeV.
Each row lists the category name, FWHM of the signal peak, acceptance times selection effi-ciency (Ae) for GF, Ae for VBF, expected number of SM signal events in the category times 105 for mH=125 GeV (NS), number of background events within a FWHM-wide window centered
on 125 GeV estimated by a signal plus background fit to the data (NB), number of observed
events within a FWHM-wide window centered on 125 GeV (NData), systematic uncertainty to
account for the parameterization of the background (NP), and NPdivided by the statistical
un-certainty on the fitted number of signal events (NP/σStat). The expected number of SM signal
events is NS = L × (σBAe)GF+ L × (σBAe)VBF, whereLis the integrated luminosity and σB
is the SM cross section times branching fraction.
FWHM Ae [%] NP/σStat
Category [GeV] GF VBF NS×105 NB NData NP [%]
0,1-jet BB 4.0 27.5 16.7 56.1 5208.9 5163 75.0 61 0,1-jet Not BB 7.1 17.0 9.7 34.6 8675.0 8748 308.7 174 2-jet Tight 3.8 0.5 10.7 2.6 17.7 22 19.5 71 2-jet Loose 4.7 1.0 7.3 3.1 79.5 84 43.2 88 Sum of categories — 46.0 44.4 96.4 13981.1 14017 — —
8
Summary
Results are presented from a search for a SM-like Higgs boson decaying to µ+
µ− and for the
first time to e+e−. For the search in µ+µ−, the analyzed CMS data correspond to integrated
luminosities of 5.0±0.1 fb−1collected at 7 TeV and 19.7±0.5 fb−1collected at 8 TeV, while only the 8 TeV data are used for the search in the e+e−channel. The Higgs boson signal is sought as a
narrow peak in the dilepton invariant mass spectrum on top of a smoothly falling background dominated by the Drell–Yan, tt, and vector boson pair-production processes. Events are split into categories corresponding to different production topologies and dilepton invariant mass resolutions. The signal strength is then extracted using a simultaneous fit to the dilepton in-variant mass spectra in all of the categories.
No significant H→µ+µ−signal is observed. Upper limits are set on the signal strength at the
95% CL. Results are presented for Higgs boson masses between 120 and 150 GeV. The com-bined observed limit on the signal strength, for a Higgs boson with a mass of 125 GeV, is 7.4, while the expected limit is 6.5+−2.81.9. Assuming the SM production cross section, this corresponds to an upper limit of 0.0016 onB(H→ µ+µ−). For a Higgs boson mass of 125 GeV, the best fit
signal strength is 0.8+−3.53.4.
In the H → e+e− channel, SM Higgs boson decays are far too rare to detect, and no signal is observed. For a Higgs boson mass of 125 GeV, a 95% CL upper limit of 0.041 pb is set on
σB(H → e+e−)at 8 TeV. Assuming the SM production cross section, this corresponds to an
upper limit on B(H → e+e−)of 0.0019, which is approximately 3.7×10⁵ times the SM pre-diction. For comparison, the H → µ+µ−observed 95% CL upper limit on σB(H→ µ+µ−)is
0.033 pb (using only 8 TeV data), which is 7.0 times the expected SM Higgs boson cross section. These results, together with recent evidence for the 125 GeV boson’s coupling to τ-leptons [6] with a largerB consistent with the SM value of 0.0632±0.0036 [5], confirm the SM prediction
that the leptonic couplings of the new boson are not flavour-universal.
Acknowledgments
We congratulate our colleagues in the CERN accelerator departments for the excellent perfor-mance of the LHC and thank the technical and administrative staffs at CERN and at other CMS institutes for their contributions to the success of the CMS effort. In addition, we gratefully acknowledge the computing centres and personnel of the Worldwide LHC Computing Grid for delivering so effectively the computing infrastructure essential to our analyses. Finally, we acknowledge the enduring support for the construction and operation of the LHC and the CMS detector provided by the following funding agencies: BMWFW and FWF (Austria); FNRS and FWO (Belgium); CNPq, CAPES, FAPERJ, and FAPESP (Brazil); MES (Bulgaria); CERN; CAS, MoST, and NSFC (China); COLCIENCIAS (Colombia); MSES and CSF (Croatia); RPF (Cyprus); MoER, ERC IUT and ERDF (Estonia); Academy of Finland, MEC, and HIP (Finland); CEA and CNRS/IN2P3 (France); BMBF, DFG, and HGF (Germany); GSRT (Greece); OTKA and NIH (Hungary); DAE and DST (India); IPM (Iran); SFI (Ireland); INFN (Italy); NRF and WCU (Re-public of Korea); LAS (Lithuania); MOE and UM (Malaysia); CINVESTAV, CONACYT, SEP, and UASLP-FAI (Mexico); MBIE (New Zealand); PAEC (Pakistan); MSHE and NSC (Poland); FCT (Portugal); JINR (Dubna); MON, RosAtom, RAS and RFBR (Russia); MESTD (Serbia); SEIDI and CPAN (Spain); Swiss Funding Agencies (Switzerland); MST (Taipei); ThEPCenter, IPST, STAR and NSTDA (Thailand); TUBITAK and TAEK (Turkey); NASU and SFFR (Ukraine); STFC (United Kingdom); DOE and NSF (USA).
Individuals have received support from the Marie-Curie programme and the European Re-search Council and EPLANET (European Union); the Leventis Foundation; the A. P. Sloan Foundation; the Alexander von Humboldt Foundation; the Belgian Federal Science Policy Of-fice; the Fonds pour la Formation `a la Recherche dans l’Industrie et dans l’Agriculture (FRIA-Belgium); the Agentschap voor Innovatie door Wetenschap en Technologie (IWT-(FRIA-Belgium); the Ministry of Education, Youth and Sports (MEYS) of the Czech Republic; the Council of Sci-ence and Industrial Research, India; the HOMING PLUS programme of Foundation for Polish Science, cofinanced from European Union, Regional Development Fund; the Compagnia di San Paolo (Torino); the Consorzio per la Fisica (Trieste); MIUR project 20108T4XTM (Italy); the Thalis and Aristeia programmes cofinanced by EU-ESF and the Greek NSRF; and the National Priorities Research Program by Qatar National Research Fund; and the Russian Scientific Fund, grant N 14-12-00110.
References
[1] ATLAS Collaboration, “Observation of a new particle in the search for the Standard Model Higgs boson with the ATLAS detector at the LHC”, Phys. Lett. B 716 (2012) 1, doi:10.1016/j.physletb.2012.08.020, arXiv:1207.7214.
[2] CMS Collaboration, “Observation of a new boson at a mass of 125 GeV with the CMS experiment at the LHC”, Phys. Lett. B 716 (2012) 30,
doi:10.1016/j.physletb.2012.08.021, arXiv:1207.7235.
[3] CMS Collaboration, “Observation of a new boson with mass near 125 GeV in pp collisions at√s = 7 and 8 TeV”, JHEP 06 (2013) 081,
16 References
[4] G. C. Branco et al., “Theory and phenomenology of two-Higgs-doublet models”, Phys. Rept. 516 (2012) 1, doi:10.1016/j.physrep.2012.02.002, arXiv:1106.0034. [5] A. Denner, S. Heinemeyer, I. Puljak, D. Rebuzzi, and M. Spira, “Standard Model
Higgs-Boson Branching Ratios with Uncertainties”, Eur. Phys. J. C 71 (2011) 1753, doi:10.1140/epjc/s10052-011-1753-8, arXiv:1107.5909.
[6] CMS Collaboration, “Evidence for the 125 GeV Higgs boson decaying to a pair of τ leptons”, JHEP 05 (2014) 104, doi:10.1007/JHEP05(2014)104, arXiv:1401.5041. [7] ATLAS Collaboration, “Evidence for the Higgs-boson Yukawa coupling to tau leptons
with the ATLAS detector”, (2015). arXiv:1501.04943. Submitted to JHEP. [8] S. Weinberg, “A Model of Leptons”, Phys. Rev. Lett. 19 (1967) 1264,
doi:10.1103/PhysRevLett.19.1264.
[9] T. Plehn and D. L. Rainwater, “Higgs decays to muons in weak boson fusion”, Phys. Lett. B 520 (2001) 108, doi:10.1016/S0370-2693(01)01157-1,
arXiv:hep-ph/0107180.
[10] T. Han and B. McElrath, “h→µ+µ−via gluon fusion at the LHC”, Phys. Lett. B 528
(2002) 81, doi:10.1016/S0370-2693(02)01208-X, arXiv:hep-ph/0201023. [11] N. Vignaroli, “Searching for a dilaton decaying to muon pairs at the LHC”, Phys. Rev. D
80(2009) 095023, doi:10.1103/PhysRevD.80.095023, arXiv:0906.4078. [12] A. Dery, A. Efrati, Y. Hochberg, and Y. Nir, “What if BR(h→µµ) / BR(h→ττ)6=
m2µ/m2τ ?”, JHEP 05 (2013) 039, doi:10.1007/JHEP05(2013)039, arXiv:1302.3229.
[13] ATLAS Collaboration, “Search for the Standard Model Higgs boson decay to µ+
µ−with
the ATLAS detector”, Phys. Lett. B 738 (2014) 68,
doi:10.1016/j.physletb.2014.09.008, arXiv:1406.7663. [14] ATLAS Collaboration, “Search for the neutral Higgs bosons of the minimal
supersymmetric standard model in pp collisions at√s=7 TeV with the ATLAS detector”, JHEP 02 (2013) 095, doi:10.1007/JHEP02(2013)095,
arXiv:1211.6956.
[15] D. de Florian and M. Grazzini, “Higgs production at the LHC: updated cross sections at√ s =8 TeV”, Phys. Lett. B 718 (2012) 117, doi:10.1016/j.physletb.2012.10.019, arXiv:1206.4133.
[16] LHC Higgs Cross Section Working Group, “Handbook of LHC Higgs Cross Sections: 1. Inclusive Observables”, (2011). arXiv:1101.0593.
[17] LHC Higgs Cross Section Working Group, “Handbook of LHC Higgs Cross Sections: 2. Differential Distributions”, (2012). arXiv:1201.3084.
[18] LHC Higgs Cross Section Working Group, “Handbook of LHC Higgs Cross Sections: 3. Higgs Properties”, (2013). arXiv:1307.1347.
[19] CMS Collaboration, “Constraints on the Higgs boson width from off-shell production and decay to Z-boson pairs”, Phys. Lett. B 736 (2014) 64,
[20] F. Caola and K. Melnikov, “Constraining the Higgs boson width with ZZ production at the LHC”, Phys. Rev. D 88 (2013) 054024, doi:10.1103/PhysRevD.88.054024, arXiv:1307.4935.
[21] CMS Collaboration, “The CMS experiment at the CERN LHC”, JINST 3 (2008) S08004, doi:10.1088/1748-0221/3/08/S08004.
[22] CMS Collaboration, “Particle–Flow Event Reconstruction in CMS and Performance for Jets, Taus, and EmissT ”, CMS Physics Analysis Summary CMS-PAS-PFT-09-001, 2009. [23] CMS Collaboration, “Commissioning of the Particle-flow Event Reconstruction with the
first LHC collisions recorded in the CMS detector”, CMS Physics Analysis Summary CMS-PAS-PFT-10-001, 2010.
[24] M. Cacciari, G. P. Salam, and G. Soyez, “The anti-ktjet clustering algorithm”, JHEP 04
(2008) 063, doi:10.1088/1126-6708/2008/04/063, arXiv:0802.1189.
[25] M. Cacciari, G. P. Salam, and G. Soyez, “FastJet user manual”, Eur. Phys. J. C 72 (2012) 1896, doi:10.1140/epjc/s10052-012-1896-2, arXiv:1111.6097.
[26] CMS Collaboration, “Determination of Jet Energy Calibration and Transverse Momentum Resolution in CMS”, JINST 6 (2011) P11002,
doi:10.1088/1748-0221/6/11/P11002, arXiv:1107.4277.
[27] CMS Collaboration, “Jet Performance in pp Collisions at 7 TeV”, CMS Physics Analysis Summary CMS-PAS-JME-10-003, 2010.
[28] CMS Collaboration, “Performance of CMS muon reconstruction in pp collision events at√ s =7 TeV”, J. Instrum. 7 (2012) P10002, doi:10.1088/1748-0221/7/10/P10002. [29] CMS Collaboration, “Energy calibration and resolution of the CMS electromagnetic
calorimeter in pp collisions at√s = 7 TeV”, JINST 8 (2013) P09009, doi:10.1088/1748-0221/8/09/P09009, arXiv:1306.2016.
[30] CMS Collaboration, “Pileup Jet Identification”, CMS Physics Analysis Summary CMS-PAS-JME-13-005, 2013.
[31] S. Alioli, P. Nason, C. Oleari, and E. Re, “A general framework for implementing NLO calculations in shower Monte Carlo programs: the POWHEG BOX”, JHEP 06 (2010) 043, doi:10.1007/JHEP06(2010)043, arXiv:1002.2581.
[32] S. Alioli, P. Nason, C. Oleari, and E. Re, “NLO Higgs boson production via gluon fusion matched with shower in POWHEG”, JHEP 04 (2009) 002,
doi:10.1088/1126-6708/2009/04/002, arXiv:0812.0578.
[33] P. Nason and C. Oleari, “NLO Higgs boson production via vector-boson fusion matched with shower in POWHEG”, JHEP 02 (2010) 037, doi:10.1007/JHEP02(2010)037, arXiv:0911.5299.
[34] T. Sj ¨ostrand, S. Mrenna, and P. Z. Skands, “PYTHIA 6.4 physics and manual”, JHEP 05 (2006) 026, doi:10.1088/1126-6708/2006/05/026, arXiv:hep-ph/0603175. [35] M. B¨ahr et al., “Herwig++ physics and manual”, Eur. Phys. J. C 58 (2008) 639,
18 References
[36] GEANT4 Collaboration, “GEANT4—a simulation toolkit”, Nucl. Instrum. Meth. A 506 (2003) 250, doi:10.1016/S0168-9002(03)01368-8.
[37] J. Alwall et al., “The automated computation of tree-level and next-to-leading order differential cross sections, and their matching to parton shower simulations”, JHEP 07 (2014) 079, doi:10.1007/JHEP07(2014)079, arXiv:1405.0301.
[38] ATLAS and CMS Collaborations, and LHC Higgs Combination Group, “Procedure for the LHC Higgs boson search combination in summer 2011”, CMS Note
CMS-NOTE-2011/005 ATL-PHYS-PUB-2011-011, 2011.
[39] CMS Collaboration, “Absolute Calibration of the Luminosity Measurement at CMS: Winter 2012 Update”, CMS Physics Analysis Summary CMS-PAS-SMP-12-008, 2012. [40] CMS Collaboration, “CMS Luminosity Based on Pixel Cluster Counting - Summer 2013
Update”, CMS Physics Analysis Summary CMS-PAS-LUM-13-001, 2013. [41] S. Alekhin et al., “The PDF4LHC Working Group Interim Report”, (2011).
arXiv:1101.0536.
[42] M. Botje et al., “The PDF4LHC Working Group Interim Recommendations”, (2011). arXiv:1101.0538.
[43] H.-L. Lai et al., “New parton distributions for collider physics”, Phys. Rev. D 82 (2010) 074024, doi:10.1103/PhysRevD.82.074024, arXiv:1007.2241.
[44] A. D. Martin, W. J. Stirling, R. S. Thorne, and G. Watt, “Parton distributions for the LHC”, Eur. Phys. J. C 63 (2009) 189, doi:10.1140/epjc/s10052-009-1072-5,
arXiv:0901.0002.
[45] NNPDF Collaboration, “A first unbiased global NLO determination of parton distributions and their uncertainties”, Nucl. Phys. B 838 (2010) 136,
doi:10.1016/j.nuclphysb.2010.05.008, arXiv:1002.4407.
[46] M. R. Whalley, D. Bourilkov, and R. C. Group, “The Les Houches accord PDFs (LHAPDF) and LHAGLUE”, (2005). arXiv:hep-ph/0508110.
[47] R. Field, “The underlying event in hadronic collisions”, Ann. Rev. Nucl. Part. Sci. 62 (2012) 453, doi:10.1146/annurev-nucl-102711-095030.
[48] P. Z. Skands, “Tuning Monte Carlo generators: The Perugia tunes”, Phys. Rev. D 82 (2010) 074018, doi:10.1103/PhysRevD.82.074018, arXiv:1005.3457.
[49] A. Buckley et al., “Systematic event generator tuning for the LHC”, Eur. Phys. J. C 65 (2010) 331, doi:10.1140/epjc/s10052-009-1196-7, arXiv:0907.2973.
[50] A. L. Read, “Presentation of search results: the CLs technique”, J. Phys. G 28 (2002) 2693, doi:10.1088/0954-3899/28/10/313.
[51] T. Junk, “Confidence level computation for combining searches with small statistics”, Nucl. Instrum. Meth. A 434 (1999) 435, doi:10.1016/S0168-9002(99)00498-2, arXiv:hep-ex/9902006.
[52] CMS Collaboration, “Combined results of searches for the standard model Higgs boson”, Phys. Lett. B 710 (2012) 26, doi:10.1016/j.physletb.2012.02.064.
[53] G. Cowan, K. Cranmer, E. Gross, and O. Vitells, “Asymptotic formulae for likelihood-based tests of new physics”, Eur. Phys. J. C 71 (2011) 1554, doi:10.1140/epjc/s10052-011-1554-0.
[54] CMS Collaboration, “Jet Plus Tracks Algorithm for Calorimeter Jet Energy Corrections in CMS”, CMS Physics Analysis Summary CMS-PAS-JME-09-002, 2009.
[55] CMS Collaboration, “Measurement of the properties of a Higgs boson in the four-lepton final state”, Phys. Rev. D 89 (2013) 092007, doi:10.1103/PhysRevD.89.092007. [56] CMS Collaboration, “Electron performance with 19.6 fb−1of data collected at√s=8 TeV
with the CMS detector.”, CMS Detector Performance Summary CMS-DP-2013-003, 2013. [57] D. L. Rainwater, R. Szalapski, and D. Zeppenfeld, “Probing color singlet exchange in Z +
two jet events at the CERN LHC”, Phys. Rev. D 54 (1996) 6680, doi:10.1103/PhysRevD.54.6680, arXiv:hep-ph/9605444.
[58] CMS Collaboration, “Observation of the diphoton decay of the Higgs boson and measurement of its properties”, Eur. Phys. J. C 74 (2014) 3076,
A
The CMS Collaboration
Yerevan Physics Institute, Yerevan, Armenia
V. Khachatryan, A.M. Sirunyan, A. Tumasyan
Institut f ¨ur Hochenergiephysik der OeAW, Wien, Austria
W. Adam, T. Bergauer, M. Dragicevic, J. Er ¨o, C. Fabjan1, M. Friedl, R. Fr ¨uhwirth1, V.M. Ghete, C. Hartl, N. H ¨ormann, J. Hrubec, M. Jeitler1, W. Kiesenhofer, V. Kn ¨unz, M. Krammer1, I. Kr¨atschmer, D. Liko, I. Mikulec, D. Rabady2, B. Rahbaran, H. Rohringer, R. Sch ¨ofbeck,
J. Strauss, A. Taurok, W. Treberer-Treberspurg, W. Waltenberger, C.-E. Wulz1
National Centre for Particle and High Energy Physics, Minsk, Belarus
V. Mossolov, N. Shumeiko, J. Suarez Gonzalez
Universiteit Antwerpen, Antwerpen, Belgium
S. Alderweireldt, M. Bansal, S. Bansal, T. Cornelis, E.A. De Wolf, X. Janssen, A. Knutsson, S. Luyckx, S. Ochesanu, R. Rougny, M. Van De Klundert, H. Van Haevermaet, P. Van Mechelen, N. Van Remortel, A. Van Spilbeeck
Vrije Universiteit Brussel, Brussel, Belgium
F. Blekman, S. Blyweert, J. D’Hondt, N. Daci, N. Heracleous, J. Keaveney, S. Lowette, M. Maes, A. Olbrechts, Q. Python, D. Strom, S. Tavernier, W. Van Doninck, P. Van Mulders, G.P. Van Onsem, I. Villella
Universit´e Libre de Bruxelles, Bruxelles, Belgium
C. Caillol, B. Clerbaux, G. De Lentdecker, D. Dobur, L. Favart, A.P.R. Gay, A. Grebenyuk, A. L´eonard, A. Mohammadi, L. Perni`e2, T. Reis, T. Seva, L. Thomas, C. Vander Velde, P. Vanlaer, J. Wang, F. Zenoni
Ghent University, Ghent, Belgium
V. Adler, K. Beernaert, L. Benucci, A. Cimmino, S. Costantini, S. Crucy, S. Dildick, A. Fagot, G. Garcia, J. Mccartin, A.A. Ocampo Rios, D. Ryckbosch, S. Salva Diblen, M. Sigamani, N. Strobbe, F. Thyssen, M. Tytgat, E. Yazgan, N. Zaganidis
Universit´e Catholique de Louvain, Louvain-la-Neuve, Belgium
S. Basegmez, C. Beluffi3, G. Bruno, R. Castello, A. Caudron, L. Ceard, G.G. Da Silveira, C. Delaere, T. du Pree, D. Favart, L. Forthomme, A. Giammanco4, J. Hollar, A. Jafari, P. Jez, M. Komm, V. Lemaitre, C. Nuttens, D. Pagano, L. Perrini, A. Pin, K. Piotrzkowski, A. Popov5, L. Quertenmont, M. Selvaggi, M. Vidal Marono, J.M. Vizan Garcia
Universit´e de Mons, Mons, Belgium
N. Beliy, T. Caebergs, E. Daubie, G.H. Hammad
Centro Brasileiro de Pesquisas Fisicas, Rio de Janeiro, Brazil
W.L. Ald´a J ´unior, G.A. Alves, L. Brito, M. Correa Martins Junior, T. Dos Reis Martins, C. Mora Herrera, M.E. Pol
Universidade do Estado do Rio de Janeiro, Rio de Janeiro, Brazil
W. Carvalho, J. Chinellato6, A. Cust ´odio, E.M. Da Costa, D. De Jesus Damiao, C. De Oliveira Martins, S. Fonseca De Souza, H. Malbouisson, D. Matos Figueiredo, L. Mundim, H. Nogima, W.L. Prado Da Silva, J. Santaolalla, A. Santoro, A. Sznajder, E.J. Tonelli Manganote6, A. Vilela Pereira
22 A The CMS Collaboration
Universidade Estadual Paulistaa, Universidade Federal do ABCb, S˜ao Paulo, Brazil
C.A. Bernardesb, S. Dograa, T.R. Fernandez Perez Tomeia, E.M. Gregoresb, P.G. Mercadanteb, S.F. Novaesa, Sandra S. Padulaa
Institute for Nuclear Research and Nuclear Energy, Sofia, Bulgaria
A. Aleksandrov, V. Genchev2, P. Iaydjiev, A. Marinov, S. Piperov, M. Rodozov, S. Stoykova, G. Sultanov, V. Tcholakov, M. Vutova
University of Sofia, Sofia, Bulgaria
A. Dimitrov, I. Glushkov, R. Hadjiiska, V. Kozhuharov, L. Litov, B. Pavlov, P. Petkov
Institute of High Energy Physics, Beijing, China
J.G. Bian, G.M. Chen, H.S. Chen, M. Chen, R. Du, C.H. Jiang, R. Plestina7, F. Romeo, J. Tao, Z. Wang
State Key Laboratory of Nuclear Physics and Technology, Peking University, Beijing, China
C. Asawatangtrakuldee, Y. Ban, Q. Li, S. Liu, Y. Mao, S.J. Qian, D. Wang, W. Zou
Universidad de Los Andes, Bogota, Colombia
C. Avila, L.F. Chaparro Sierra, C. Florez, J.P. Gomez, B. Gomez Moreno, J.C. Sanabria
University of Split, Faculty of Electrical Engineering, Mechanical Engineering and Naval Architecture, Split, Croatia
N. Godinovic, D. Lelas, D. Polic, I. Puljak
University of Split, Faculty of Science, Split, Croatia
Z. Antunovic, M. Kovac
Institute Rudjer Boskovic, Zagreb, Croatia
V. Brigljevic, K. Kadija, J. Luetic, D. Mekterovic, L. Sudic
University of Cyprus, Nicosia, Cyprus
A. Attikis, G. Mavromanolakis, J. Mousa, C. Nicolaou, F. Ptochos, P.A. Razis
Charles University, Prague, Czech Republic
M. Bodlak, M. Finger, M. Finger Jr.8
Academy of Scientific Research and Technology of the Arab Republic of Egypt, Egyptian Network of High Energy Physics, Cairo, Egypt
Y. Assran9, A. Ellithi Kamel10, M.A. Mahmoud11, A. Radi12,13
National Institute of Chemical Physics and Biophysics, Tallinn, Estonia
M. Kadastik, M. Murumaa, M. Raidal, A. Tiko
Department of Physics, University of Helsinki, Helsinki, Finland
P. Eerola, G. Fedi, M. Voutilainen
Helsinki Institute of Physics, Helsinki, Finland
J. H¨ark ¨onen, V. Karim¨aki, R. Kinnunen, M.J. Kortelainen, T. Lamp´en, K. Lassila-Perini, S. Lehti, T. Lind´en, P. Luukka, T. M¨aenp¨a¨a, T. Peltola, E. Tuominen, J. Tuominiemi, E. Tuovinen, L. Wendland
Lappeenranta University of Technology, Lappeenranta, Finland
J. Talvitie, T. Tuuva
DSM/IRFU, CEA/Saclay, Gif-sur-Yvette, France
S. Ganjour, A. Givernaud, P. Gras, G. Hamel de Monchenault, P. Jarry, E. Locci, J. Malcles, J. Rander, A. Rosowsky, M. Titov
Laboratoire Leprince-Ringuet, Ecole Polytechnique, IN2P3-CNRS, Palaiseau, France
S. Baffioni, F. Beaudette, P. Busson, C. Charlot, T. Dahms, M. Dalchenko, L. Dobrzynski, N. Filipovic, A. Florent, R. Granier de Cassagnac, L. Mastrolorenzo, P. Min´e, C. Mironov, I.N. Naranjo, M. Nguyen, C. Ochando, P. Paganini, S. Regnard, R. Salerno, J.B. Sauvan, Y. Sirois, C. Veelken, Y. Yilmaz, A. Zabi
Institut Pluridisciplinaire Hubert Curien, Universit´e de Strasbourg, Universit´e de Haute Alsace Mulhouse, CNRS/IN2P3, Strasbourg, France
J.-L. Agram14, J. Andrea, A. Aubin, D. Bloch, J.-M. Brom, E.C. Chabert, C. Collard, E. Conte14,
J.-C. Fontaine14, D. Gel´e, U. Goerlach, C. Goetzmann, A.-C. Le Bihan, P. Van Hove
Centre de Calcul de l’Institut National de Physique Nucleaire et de Physique des Particules, CNRS/IN2P3, Villeurbanne, France
S. Gadrat
Universit´e de Lyon, Universit´e Claude Bernard Lyon 1, CNRS-IN2P3, Institut de Physique Nucl´eaire de Lyon, Villeurbanne, France
S. Beauceron, N. Beaupere, G. Boudoul2, E. Bouvier, S. Brochet, C.A. Carrillo Montoya, J. Chasserat, R. Chierici, D. Contardo2, P. Depasse, H. El Mamouni, J. Fan, J. Fay, S. Gascon, M. Gouzevitch, B. Ille, T. Kurca, M. Lethuillier, L. Mirabito, S. Perries, J.D. Ruiz Alvarez, D. Sabes, L. Sgandurra, V. Sordini, M. Vander Donckt, P. Verdier, S. Viret, H. Xiao
Institute of High Energy Physics and Informatization, Tbilisi State University, Tbilisi, Georgia
Z. Tsamalaidze8
RWTH Aachen University, I. Physikalisches Institut, Aachen, Germany
C. Autermann, S. Beranek, M. Bontenackels, M. Edelhoff, L. Feld, O. Hindrichs, K. Klein, A. Ostapchuk, A. Perieanu, F. Raupach, J. Sammet, S. Schael, H. Weber, B. Wittmer, V. Zhukov5
RWTH Aachen University, III. Physikalisches Institut A, Aachen, Germany
M. Ata, M. Brodski, E. Dietz-Laursonn, D. Duchardt, M. Erdmann, R. Fischer, A. G ¨uth, T. Hebbeker, C. Heidemann, K. Hoepfner, D. Klingebiel, S. Knutzen, P. Kreuzer, M. Merschmeyer, A. Meyer, P. Millet, M. Olschewski, K. Padeken, P. Papacz, H. Reithler, S.A. Schmitz, L. Sonnenschein, D. Teyssier, S. Th ¨uer, M. Weber
RWTH Aachen University, III. Physikalisches Institut B, Aachen, Germany
V. Cherepanov, Y. Erdogan, G. Fl ¨ugge, H. Geenen, M. Geisler, W. Haj Ahmad, A. Heister, F. Hoehle, B. Kargoll, T. Kress, Y. Kuessel, A. K ¨unsken, J. Lingemann2, A. Nowack, I.M. Nugent,
L. Perchalla, O. Pooth, A. Stahl
Deutsches Elektronen-Synchrotron, Hamburg, Germany
I. Asin, N. Bartosik, J. Behr, W. Behrenhoff, U. Behrens, A.J. Bell, M. Bergholz15, A. Bethani, K. Borras, A. Burgmeier, A. Cakir, L. Calligaris, A. Campbell, S. Choudhury, F. Costanza, C. Diez Pardos, S. Dooling, T. Dorland, G. Eckerlin, D. Eckstein, T. Eichhorn, G. Flucke, J. Garay Garcia, A. Geiser, P. Gunnellini, J. Hauk, M. Hempel15, D. Horton, H. Jung, A. Kalogeropoulos, M. Kasemann, P. Katsas, J. Kieseler, C. Kleinwort, D. Kr ¨ucker, W. Lange, J. Leonard, K. Lipka, A. Lobanov, W. Lohmann15, B. Lutz, R. Mankel, I. Marfin15,
I.-A. Melzer-Pellmann, I.-A.B. Meyer, G. Mittag, J. Mnich, I.-A. Mussgiller, S. Naumann-Emme, A. Nayak, O. Novgorodova, E. Ntomari, H. Perrey, D. Pitzl, R. Placakyte, A. Raspereza, P.M. Ribeiro Cipriano, B. Roland, E. Ron, M. ¨O. Sahin, J. Salfeld-Nebgen, P. Saxena, R. Schmidt15,