(
Petromyzon marinus
, L.) in Western Iberian Peninsula
Using Morphological Characters and Heart Fatty Acid
Signature Analyses
Maria Joa˜o Lanc¸a1,2, Maria Machado2, Catarina S. Mateus3,4, Marta Lourenc¸o3, Ana F. Ferreira3, Bernardo R. Quintella3,5*, Pedro R. Almeida4,6
1 Escola de Cieˆncias e Tecnologia, Departamento de Zootecnia, Universidade de E´vora, E´vora, Portugal, 2 Instituto de Cieˆncias Agra´rias e Ambientais Mediterraˆnicas, Universidade de E´vora, E´vora, Portugal,3 Centro de Oceanografia, Faculdade de Cieˆncias, Universidade de Lisboa, Lisboa, Portugal, 4 Museu Nacional de Histo´ria Natural e da Cieˆncia & Centro de Biologia Ambiental, Universidade de Lisboa, Lisboa, Portugal,5 Departamento de Biologia Animal, Faculdade de Cieˆncias, Universidade de Lisboa, Lisboa, Portugal,6 Escola de Cieˆncias e Tecnologia, Departamento de Biologia, Universidade de E´vora, E´vora, Portugal
Abstract
This study hypothesizes the existence of three groups of sea lamprey Petromyzon marinus L. in Portugal (North/Central group, Tagus group, and Guadiana group), possibly promoted by seabed topography isolation during the oceanic phase of the life cycle. Within this context, our purpose was to analyze the existence of a stock structure on sea lamprey populations sampled in the major Portuguese river basins using both morphological characters and heart tissue fatty acid signature. In both cases, the multiple discriminant analysis revealed statistically significant differences among groups, and the overall corrected classification rate estimated from cross-validation procedure was particularly high for the cardiac muscle fatty acid profiles (i.e. 83.8%). Morphometric characters were much more useful than meristic ones to discriminate stocks, and the most important variables for group differentiation were eye length, second dorsal fin length and branchial length. Fatty acid analysis showed that all lampreys from the southern Guadiana group were correctly classified and not mixing with individuals from any other group, reflecting a typical heart fatty acid signature. Our results revealed that 89.5% and 72.2% of the individuals from the Tagus and North/Central groups, respectively, were also correctly classified, despite some degree of overlap between individuals from these groups. The fatty acids that contributed to the observed segregation were C16:0; C17:0; C18:1v9; C20:3v6 and C22:2v6. Detected differences are probably related with environmental variables to which lampreys may have been exposed, which leaded to different patterns of gene expression. These results suggest the existence of three different sea lamprey stocks in Portugal, with implication in terms of management and conservation.
Citation: Lanc¸a MJ, Machado M, Mateus CS, Lourenc¸o M, Ferreira AF, et al. (2014) Investigating Population Structure of Sea Lamprey (Petromyzon marinus, L.) in Western Iberian Peninsula Using Morphological Characters and Heart Fatty Acid Signature Analyses. PLoS ONE 9(9): e108110. doi:10.1371/journal.pone.0108110 Editor: David William Pond, Scottish Association for Marine Science, United Kingdom
Received April 24, 2014; Accepted August 20, 2014; Published September 26, 2014
Copyright: ß 2014 Lanc¸a et al. This is an open-access article distributed under the terms of the Creative Commons Attribution License, which permits unrestricted use, distribution, and reproduction in any medium, provided the original author and source are credited.
Data Availability: The authors confirm that, for approved reasons, some access restrictions apply to the data underlying the findings. All relevant data are within the paper.
Funding: This work was financially supported by Foundation for Science and Technology (FCT) through project PTDC/BIA-BDE/71826/2006 and also by FEDER Funds through the Operational Programme for Competitiveness Factors - COMPETE and National Funds through FCT - Foundation for Science and Technology under the Strategic Project PEst-C/AGR/UI0115/2011. The funders had no role in study design, data collection and analysis, decision to publish, or preparation of the manuscript.
Competing Interests: The authors have declared that no competing interests exist. * Email: [email protected]
Introduction
European populations of sea lamprey (Petromyzon marinus L.) have declined over the last 30 years [1], [2], and several authors have pointed out a reduction in sea lamprey abundance in Portuguese rivers [3], [4]. Sea lampreys can be found in all major Portuguese river basins, being more abundant in the central and northern regions of the country [3]. Due to the reduction in population abundance and the anthropogenic pressures to which this species is subjected, in Portugal it is classified as ‘‘Vulnerable’’ in the Red List of Threatened Vertebrates [4].
Whereas the continental phase of lampreys’ life cycle is well known, the oceanic phase remains a mystery, with available data resuming to a few accidental captures of host species with scars or,
occasionally, lampreys still attached to the fish or cetaceans [5]. A limited record of 80 sea lampreys captured in the northwest Atlantic indicated that almost all individuals with less than 39 cm long where taken in bottom trawls on the continental shelf or in coastal trap nets, whereas most animals with more than 56 cm long were captured in mid-water trawls along the shelf edge or over the continental slope [6]. Evidence that sea lamprey might not show homing behaviour first emerged following a tagging study with a landlocked population of the Great Lakes [7], and was then corroborated using genetic analysis on anadromous populations captured along the east coast of North America [8], [9].
The anatomy and physiology of an individual is sensitive both to genetic and environmental factors, which are responsible for
phenotypic variation reflecting morphological characteristics [10]. In meristic terms, the effect of abiotic factors during ontogeny may result in significant differences between individuals of the same population, [11]. Morphometric characters are exposed to the same abiotic factors for an even longer period of time, which may increase the susceptibility of having more differences [12]. If those differences are ecologically significant and constant in time, they may allow the identification of individuals of different populations or stocks [13]. Morphometric variables measured in the cephalic region of sea lamprey larvae were found to be more suitable for a morphological analysis of geographic variation between Portu-guese river basins [14]. Meristic characters were also assessed but the discriminatory power between groups, i.e. river basins, was comparatively weaker.
The concept of stock is fundamental for both fisheries and endangered species management [15]. A stock can be defined as a population or portion of a population of which all members are characterized by similarities which are not heritable, but are induced by the environment, and which include members of several different subpopulations [16]. Unit stocks can also be defined as characteristic populations or sets of subpopulations within subareas of the geographic range of a species [17], or as ‘‘… an intraspecific group of randomly mating individuals with temporal and spatial integrity’’ [13].
Spawning areas are normally clearly distinguished among the different stocks, but since fish may undertake considerable migrations, catches may also consist of fish from several stocks. For this reason, much work has been carried out to find characters that can be used for stock identification [18]. Waldmanet al.[19] suggested that stock identification could be based upon catch data, tag recoveries, meristics, morphometrics, scale morphology, parasites, and cytogenetic: protein electrophoresis, monogenetic, mitochondrial DNA and nuclear DNA.
One of the limitations when using fatty acid profiles of a tissue as biomarkers and/or to characterize species, subspecies, popula-tions, or stocks, is that the fatty acid profile under analysis can be influenced by various environmental factors, including the diet [20]. However, when fatty acid profiles are used for identification, the assumption is that the composition of fatty acids in membrane phospholipids is genetically controlled and stable over time, and therefore the phospholipid fatty acids may be used as a natural marker over a longer timescale [21]. Several studies have indicated genetic control of the fatty acid composition in the heart lipids although the impact of environmental factors could not be excluded [18], [21]. The lipid composition of cardiac skeletal muscle has a high level of polar lipids incorporated in the membrane phospholipid pool, so its fatty acyl structure restricts the ability of the acyl chains to reflect diet [22], and because of the specialized functions of these lipids on membranes, this lipid class is relatively robust to dietary changes. For the reasons explained above, fatty acids of cardiac skeletal muscle may serve as natural markers for the identification of stocks [21], [23]. In the last decade, several reports have suggested that fatty acid composition of phospholipids in some body tissues (e.g. heart tissue, brain, eggs) have a stable genetics basis, making these tissues appropriate for stock identification [18], [20], [24], [25]. Many fish species such as herring (Clupea harengus L.), striped bass (Morone saxatilis Walbaum, 1792) and cod (Gadus morhua L.) had been studied with this approach looking for possible stock differences [18], [26], [27].
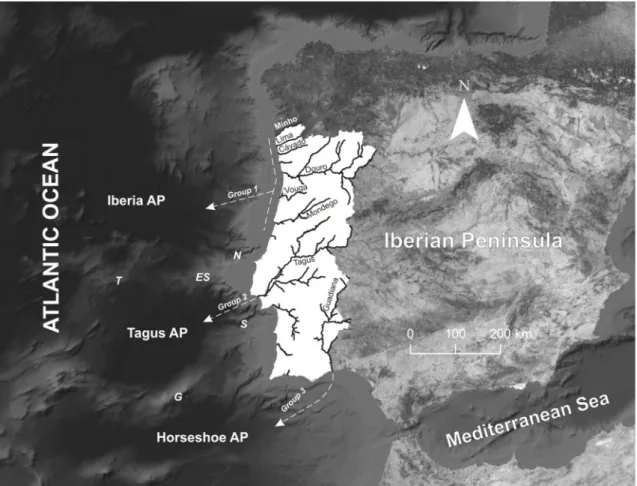
Within this context, we hypothesize the existence of three sea lamprey groups in Portugal, possibly promoted by the seabed topography isolation during the oceanic phase of the life cycle; three large abyssal plains, and adjacent continental slopes, occur
off western Iberian Peninsula: the Iberia Abyssal Plain in the north, the Tagus Abyssal Plain in the centre and the Horseshoe Abyssal Plain in the south. The Iberia Abyssal Plain is separated from the Tagus Abyssal Plain by the Estremadura Spur and the Tore Seamount, and by the Nazare´ Canyon (continental shelf). The Tagus Abyssal Plain is separated from the Horseshoe Abyssal Plain through the Gorringe Bank and the Setu´bal Canyon (Fig. 1).The hypothesis presented in this study is associated with the assumption that the bulk of the parasitic attacks are directed towards benthic hosts, which are believed to have restricted dispersal capability when compared with the more mobile pelagic species, and thus exchanges between lamprey feeding areas (i.e. groups) are strongly reduced. This hypotheses is supported by two evidences: (i) recent discoveries indicate a shorter hematophagous feeding stage (,1 year) [28], first reported to last from 23 to 28 months [29]; and (ii) there are no capturing records of adult lampreys or fish with wounds, compatible with potential lamprey attachments, in the data collected from annual surveys performed in the Portuguese continental shelf by IPMA I. P., the Portuguese fisheries laboratory (Yorgos Stratoudakis, pers. comm.). The short adult feeding stage attributed to the sea lamprey reduces considerably their dispersion capability in the marine environ-ment, and this fact, together with the absence of evidences of adult lampreys feeding in the continental shelf, support the present study hypotheses that postulates that the majority of the growth during the parasitic feeding stage are related with attachments to benthic hosts species that live in the continental slope and/or abyssal plains. To test this hypothesis we analysed (i) morphological differentiation, and (ii) heart tissue phospholipid fatty acid profile between sea lamprey adults from the main Portuguese river basins, divided in the three groups mentioned above. In parallel, we performed analysis of genetic differentiation among the exact same groups using 12 microsatellite loci (results not shown, unpublished data), but no differences were found among the three groups at this level. To end, we discuss on the possibility of the existence of three sea lamprey stocks off western Iberian Peninsula, distinct by segregation in the trophic phase of the life cycle, and make some considerations and recommendations for conservation.
Methods Ethics statement
Sampled sea lampreys were transported alive to the laboratory in a 0.4 m3capacity tank equipped with proper life support system including aeration, external filter and temperature control. In the laboratory, the individuals were first immersed in cold water to minimize handling stress and pain sensibility and sacrificed through decapitation method. This study was carried out in strict accordance with the recommendations present in the Guide for the Care and Use of Laboratory Animals of the European Union – in Portugal represented by the Decree-Law nu129/92, Portaria nu1005/92. Approval by a named review board institution or ethics committee was not necessary as the final model for ethical experimentation using fish as biological models was not imple-mented in Portuguese research units at the time of experimenta-tion. This work was conducted under an institutional license for animal experimentation and a personal license to first author Maria Joa˜o Lanc¸a and the co-authors Pedro R. Almeida and Bernardo R. Quintella, issued by the Direcc¸a˜o-Geral de Veter-ina´ria (DGV), Portuguese Ministry of Agriculture, Rural Devel-opment and Fisheries.
Sampling
Sea lamprey spawners were captured in March 2008 during the peak of their spawning migration in eight river basins: Minho (41u529N; 08u509W), Lima (41u419N; 08u499W), Ca´vado (41u329N; 08u479W), Douro (41u089N; 08u409W), Vouga (40u399N; 08u439W), Mondego (40u89N; 08u509W), Tagus (39u039N; 08u479W) and Guadiana (37u389N; 07u399W). No specific permissions were required for sampling in these locations because the adult lampreys were captured by local fishermen in designated professional fishing areas. This study was conducted with a species considered ‘‘Vulnerable’’ by the Portuguese Red List of Threatened Vertebrates but general permits for field sampling fish (including P. marinus) were accredited by the Autoridade Florestal Nacional (AFN).
A total of 224 sea lampreys were collected, including about 30 individuals from each river basin. Specimens from each river basin were groupeda priori to test the hypothesis of stock fragmentation promoted by the seabed physiographic features during the oceanic parasitic phase. We defined three groups based on the geograph-ical location of the river mouth, namely, the proximity to western Iberia oceanic areas (Fig. 1). Group 1 includes individuals captured in the Minho, Lima, Ca´vado, Douro, Vouga and Mondego river basins; Group 2 collects specimens captured in River Tagus; and Group 3 includes individuals from River Guadiana (Fig. 1).
Detailed temperature–salinity distribution in the Northeast Atlantic, the region encompassing the three large abyssal plains (i.e. Iberia, Tagus and Horseshoe), is available at the web-site of the Centre of Oceanography of the University of Lisbon (http:// co.fc.ul.pt/en/data) [30].
Morphological characters
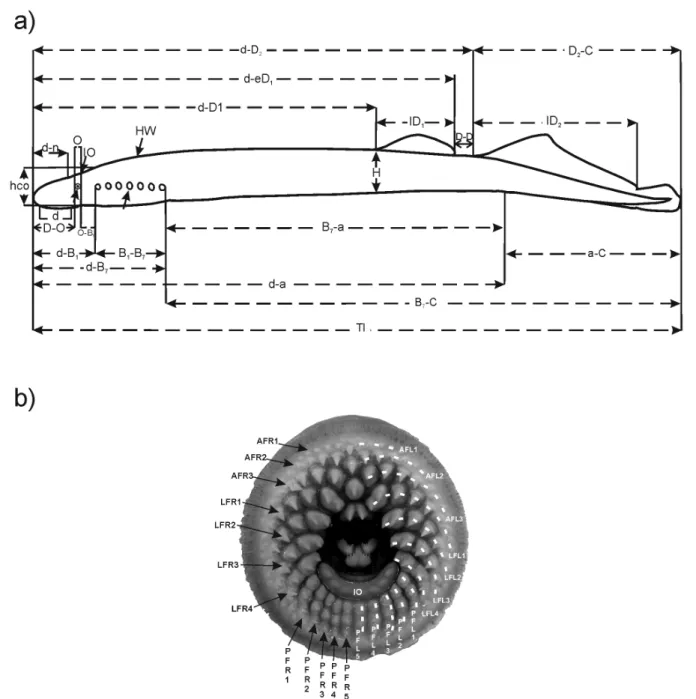
A total of 34 morphological characters were used: 24 morphometric and 10 meristic (Fig. 2), following [31]–[33].
All the 224 captured lampreys were used for the morphometric analysis. The morphometric characters were measured using graduated scales (60.5 mm) and callipers (60.5 mm; Fig. 2a). A sub sample of 201 lampreys was used for the meristic analysis. The oral disc of each individual was photographed (Kodak Z740) to count the meristic characters (Fig. 2b). To standardize the procedure, the picture was taken through an acrylic plate with the oral disc always opened to its maximum amplitude. A graphical scale was used to calibrate each image. The pictures were analyzed and processed using the Image J software [34] to count the number of teeth and rows in the anterior, laterals and posterior fields of the lamprey oral disc. The adopted teeth terminology (Fig. 2b) follows that proposed by Vladykov and Follett [31]. Trunk myomeres were counted between the anterior edge of the cloacal slit and the posterior edge of the last branchial opening, following [32]. All counts and measurements were made on the left side of the body.
Figure 1. Location of the river basins from which sea lamprey individuals were collected. Formation of the three groups (testing hypothesis) based on the geographical location of the river mouth and the proximity to western Iberian oceanic areas with the representation of the seamounts and canyons that contour the three abyssal plains. Acronyms: Iberia AP - Iberia Abyssal Plain; Tagus AP – Tagus Abyssal Plain; Horsheshoe AP – Horsheshoe Abyssal Plain; T – Tore Seamount; ES – Estremadura Spur; G – Gorringe Bank.
Total mass (60.01 g) of each individual was determined using a precision balance (Kern 440-36).
To test the hypothesis of sexual dimorphism in morphometric and meristic characters ofP. marinus, the gender of all individuals was confirmed with histological slides, prepared with sections of reproductive organs according to the standard protocol of [35].
Histological slides were observed using a stereomicroscope (Leica DM 2000).
Tissue preparation and collection
Data on body total mass (TM, nearest g) and total length (TL, nearest mm) was registered for each sea lamprey.
Figure 2. Schematic representation of the morphological features recorded for the analysis of geographic variation of sea lamprey in Portugal. (a) lateral view outline with the representation of the measured morphometric characters: TL, total length; d, disc length; d-a, distance between disc and anus; a-C, tail length; B7-C, postbranchial length; B7-a, trunk length; d-D1, predorsal distance; d-eD1, distance between disc and posterior end of first dorsal fin; d-D2, distance between disc and base of second dorsal fin; D2-C, dorsal part of caudal fin length; lD1, first dorsal fin length; lD2, second dorsal fin length; D-D, distance between dorsal fins; H, body depth; d-O, preocular distance; O, eye diameter; O-B1, postocular length; Hco, head depth; d-B1, prebranchial length; B1-B7, branchial length; d- B7, head length; d-n, prenostril length; IO, interocular distance; HW, head width; (b) photograph of the oral disc with the representation of the counted meristic characters: AF, anterior field; LFR, lateral right field; LFL, lateral left field; PF, posterior field; SO, supraoral lamina; L, lingual lamina; IO, infraoral lamina; TNteeth, total number of teeth; AFteeth, number of teeth in the anterior field; LFteeth, number of teeth in the lateral field; PFteeth, number of teeth in the posterior field; TNrows, total number of rows; AFrows, number of rows in the anterior field; LFrows, number of rows in the lateral field; PFrows, number of rows in the posterior field; IOcusps, number of cusps in the infra-oral lamina).
Data on heart total mass (HTM, nearest g) and gender was reported for each sea lamprey (see previous section for gender determination). Sex ratio (male/female), heart total mass/body gutted mass ratio (HTM/BGM, expressed in percentage) and heart percentage of water loss (Hwater) were also determined.
The heart was rapidly excised and rinsed in ice-cold 0.9% NaCl solution. Heart was then sliced and frozen between the tongues of an aluminum clamp that was cooled in liquid nitrogen. The frozen tissue heart samples were stored in aluminum canisters at 280uC until laboratorial processing.
Heart tissue lipid extraction and fatty acid analysis
Pre-testing (random subsample of 8 individuals per river basin) determination of heart total lipids, neutral lipids and polar lipids revealed that more than 90 percent of the lipids present in heart tissue were polar lipids, resulting in all further analyses for fatty acid profile characterization were only done in polar lipid class. Lipid extraction was made according to the method described by Lanc¸aet al. [36]. Briefly, heart tissue total lipids were extracted using a Dionex 100 accelerated solvent extractor (ASE). To prepare for extraction, aliquots of 1 g portion of heart muscle samples were weighed on an analytical balance (Mettler AT201; Greifensee, Switzerland) and their masses were recorded to the nearest 0.01 mg. Tissue samples were then lyophilized until constant mass to determine the percentage of water loss and aliquots of heart tissue with 100 mg of dry weight were used. The total lipid sample was then extracted with a mixture of 60% chloroform and 40% methanol (Merck, Darmstadt, Germany) at 100uC and 13.8 MPa.The crude extract was then concentrated under a stream of nitrogen and vacuum and heart total lipid (HTLip, expressed in g per g of dry heart muscle) were determined.Each sample was reconstituted in 20–30 volumes of ice-cold acetone to separate neutral lipids from polar lipids Because the proportion of neutral lipids obtained were negligible, only the lower phase corresponding to polar lipids was saponified in methanolic NaOH 0.5 N at 70uC for 20 min. Fatty acids were then prepared with boron-trifluoride-methanol (14 g BF3/L CH3OH, Merk-Schuchardt, Germany) in order to give fatty methyl esters (FAME) according to the procedure of [37].
FAME were analysed by liquid-gas chromatography in a Hewlett Packard HP 6890 Series GC System according the chromatographic conditions described in [36].
The presence of C13:0 fatty acid on samples was confirmed using a GC-MS Bruker Scion 456 equipped with a BR-Swax 3060,25mm column. Conditions were as follow: Inlet tempera-ture 2250u; Inlet mode - split 20 mL/min; He 1,2 mL/min column constant flow and oven temperature range from 120uC (for 5 min) to 240uC (for 10 min) with a ramping rate of 4uC/min; Ionization source: 70 eV electron ionization; and the GC-MS operated in full scan mode from 40–450 Da. To detect the subject compound ion extraction m/z 74 the m/z 87 were made.
The unsaturation index (UI), a measure of the number of double bonds within a sample, was calculated as the sum of the percentage of each unsaturated fatty acid multiplied by the number of double bonds within that fatty acid [38].
Data analysis and interpretation: morphometric and meristic analysis
The statistical package SPSS for Windows (IBM, version 20.0) was used for data treatment and statistical analysis. Data transformations were used when appropriate.
The statistical analysis was applied following [14] which compared morphometric and meristic characters of P. marinus ammocoetes captured in several Portuguese river basins.
Briefly, analyses were performed separately for morphometric and meristic characters, and morphometric data were statistically adjusted to eliminate the influence of allometric growth as described in [14].
Outliers were detected by regression analysis of morphometric characters against total length, and by scatter plots of residual versus predicted values [39], resulting in the elimination of morphometric data for 19 lampreys (n = 18 from Group 1 and n = 1 from Group 3).
Of the 23 morphometric characters used in this analysis, 22 showed a linear relationship with total length (P,0.05). For character O, the only morphometric variable uncorrelated with total length (P.0.05), no size adjustment of the data was performed. For each of the 22 morphometric characters linearly related with total length, an analysis of covariance (ANCOVA) was employed to test for differences in allometric relationships among samples (i.e. geographical groups) and to estimate the common within-group regression slopes [39]. According to the ANCOVA analyses, within-group regression slopes were signifi-cantly different (df = 2, 201;P,0.05) for six of the morphometric characters (d-D1; H; d; hco; B1-B7; HW); and thus size adjustment was based on the common within-group slopes and was performed following a modification of the allometric formula given by [40], as described in [14].
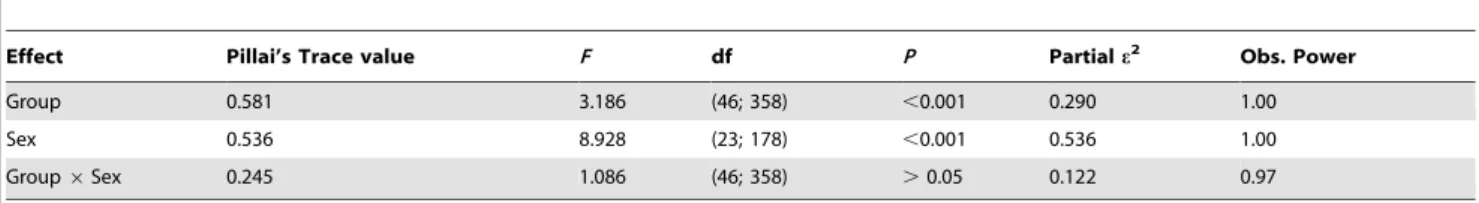
A multivariate analysis of variance (MANOVA) was used to assess the main and interaction effects of categorical variables (gender and geographical groups) on the 23 dependent morpho-metric variables. Highly significant differences (P,0.001) were found between gender and groups, but not for the interaction effect (gender 6 group; P.0.05) (Table 1). Consequently, 10 morphometric variables were removed from further analysis to eliminate the influence of sexual dimorphism among morphomet-ric characters (Table 2).
No significant relationship (P,0.05) was found between the meristic characters and total length and thus, no size adjustment was performed. Outliers were detected by the SPSS Boxplot procedure following [14], which resulted in the elimination of 13 specimens (n = 7 Group 1, n = 3 Group 2 and n = 3 Group 3).
A permutational multivariate analysis of variance (PERMA-NOVA, two-way crossed design) was used to assess the main and interaction effects of two factors (gender and geographical groups) on the meristic variables. No sexual dimorphism effect (P.0.05) nor geographical group (P.0.05) was found among the meristic characters (Table 3), and consequently meristic data was not subsequently analysed with a multiple discriminant analysis (MDA).
Morphometric data from the three groups defineda priori were compared separately by means of a MDA.
Since the groups formed a priori varied markedly in size, a stratified (river/gender) random sample from the larger group (i.e. Group 1) was performed to reduce their size to a level comparable with the smaller groups (i.e. Groups 2 and 3), following recommendations for sample sizes in MDA analysis [41]. Consequently, the MDA was run with a subsample of 36 individuals from Group 1, all individuals from Group 2 (n = 28) and from Group 3 (n = 23). The computational method used to derive the discriminant function was the stepwise method with the selection rule to maximize MahalanobisD2between groups [41], and remaining MDA related procedures followed [14].
Data analysis and interpretation: heart fatty acid profiles
The statistical package SPSS for Windows (IBM, version 20.0) was used for data treatment and statistical analysis. Data transformations were used when appropriate. Since the
distribu-tion of fatty acid percentages is binomial, an arcsine transforma-tion of fatty acid data was used prior to statistical analysis to meet assumptions of normality, independence and homocedasticity.
The integrated chromatogram values for each fatty acid were expressed as a percentage of the total sum of fatty acids identified in order to eliminate concentration effects.
Multivariate analysis of variance (MANOVA) was used to see the main interaction effects of categorical variable (gender and geographical groups) on multiple interval variables (fatty acids) and to test our hypothesis that distinct geographical groups of sea lampreys present distinct heart phospholipids fatty acid composi-tion. Significance of the MANOVA was evaluated with Wilk’s lambda. Multiple discriminant analysis (MDA) was used to identify which fatty acid contributed most to the differences in heart tissue composition among geographical groups.
Once again, for the MDA a stratified (river/gender) random sample from the larger group (i.e. Group 1) was performed to reduce their size to a level comparable with the smaller groups (i.e. Groups 2 and 3). Consequently, the MDA was run with a subsample of 36 individuals from Group 1, all individuals from Group 2 (n = 19) and from Group 3 (n = 19). Also, the number of independent variables must not exceed the smallest group size [41], and consequently, the MDA was run with a subsample of 19 fatty acids instead of the 30 fatty acids previously identified in each sample group. So, one must select few fatty acids for use in a particular analysis, generally choosing fatty acids that are expected to vary based on biological functions or, if noa priori hypotheses exist, simply have the greatest abundance in the sample set. Because, in phosphoglycerides, the most common of the phospholipids that constitute animal cell membranes seldom contain significant amounts of saturated fatty acids other than Table 1. MANOVA multivariate test with sex and geographical groups as factors, and adjusted morphometric characters as dependent variables.
Effect Pillai’s Trace value F df P Partial e2 Obs. Power
Group 0.581 3.186 (46; 358) ,0.001 0.290 1.00
Sex 0.536 8.928 (23; 178) ,0.001 0.536 1.00
Group 6 Sex 0.245 1.086 (46; 358) .0.05 0.122 0.97
doi:10.1371/journal.pone.0108110.t001
Table 2. Mean of adjusted morphometric characters used for the morphological analysis of P. marinus.
Morphometric Male Female MANOVA (F statistic; df = 1)
d 3.978 3.945 9.246*** d-a 6.449 6.455 3.667NS a-C 5.463 5.448 3.603NS B7-C 6.541 6.545 12.366** B7-a 6.133 6.145 12.195** d-D1 6.099 6.104 0.057 NS d-eD1 6.313 6.316 0.000NS d-D2 6.379 6.384 0.260NS D2-C 5.643 5.630 1.970 NS lD1 4.671 4.670 0.096 NS lD2 5.385 5.369 0.484NS D-D 3.682 3.710 2.452NS H 3.995 4.068 50.131*** d-O 4.130 4.093 31.630*** O 2.185 2.176 0.107NS O-B1 3.023 3.006 0.524 NS Hco 3.790 3.773 7.432** d-B1 4.486 4.457 25.592*** B1-B7 4.470 4.466 0.631 NS d- B7 5.165 5.149 12.228** d-n 4.010 3.972 18.027*** IO 3.857 3.832 15.328*** HW 4.000 3.990 1.912NS
Tests of Between-Subjects Effects from the MANOVA for the factor sex (presented in Table 1), are also presented. Acronyms of variables as defined in Figure 2; NS P.0.05;* P,0.05;** P,0.01; *** P,0.001.
16:0, 18:0, and to a lesser extent 20:0 [42] so all fatty acids either with chain length smaller than 10 carbons, or with chain length greater than 22 carbons were excluded; in the pool of monoun-saturated fatty acids the C14:1 and the only odd chain fatty acid were excluded and in the pool of polyunsaturated fatty acids the C18:3v3 and C18:3v6 were excluded since they were not detected in any of the groups.
The remaining procedures regarding the MDA with the fatty acids were similar to the analysis performed with the morpho-metric characters.
The Pearson correlation test was used to analyse the relation-ship between heart total mass (HTM) and heart total lipid content (HTLip) for lampreys of each geographical group.
Results
Sexual dimorphism
From the 224 adult lampreys captured, 109 were males and 115 were females. The total length (TL) and body total mass (TM) of the sampled lampreys ranged from 63.9 cm to 97.9 cm (mean TL = 86.4 cm) and from 770 g to 1806 g (mean MT= 1188 g), respectively. Significant differences were found (ANCOVA; F(1, 221)= 8.153, P,0.01) when comparing male (y = 0.0898x2.1209; r2
= 0.61;d.f. = 107;P,0.001) and female length-weight relation-ship (y = 0.0568x2.2342; r2= 0.72; d.f. = 113;P,0.001). Generally, males tend to be longer while females are heavier, and differences tend to increase with length.
Gender related differences were found in 10 of the 23 morphometric characters analysed (Table 1; MANOVA, P, 0.001). In general, males have larger cephalic regions including longer d, d-O, hco, d-B1, d-n and IO; while females have a tendency to longer and larger trunks (B7-a and H, respectively) (Table 2). No significant differences were found between genders for the analysed meristic characters (Table 3; PERMANOVA, P.0.05).
Morphometric analysis
The regressions for Z scores from discriminant functions 1 and 2 of discriminant analysis against total length were not significant (r2
= 0.011, df = 86,P = 0.340; and r2
= 0.021, df = 86,P = 0.176), indicating that size effects had been removed from the adjusted morphometric variables. Discriminant functions are statistically significant (Wilk’s lambda, P,0.001), and all pairs of groups showed statistically significant differences (df = 3, 82; P,0.05). The stepwise analysis revealed that three morphometric characters contributed significantly to the MDA (O, lD2, B1-B7). The Z scores and centroids from discriminant functions 1 and 2 were plotted against each other to develop a graphic representation of the relationship among groups (Fig. 3a). The two discriminant functions account for 59.3% and 40.7% of total variation. The
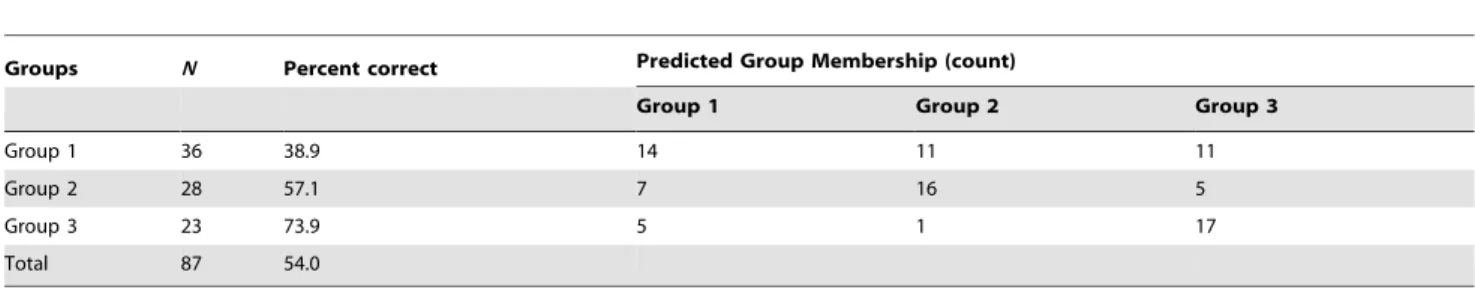
total classification rate estimated from cross-validation procedure was 54%, ranging from 38.9 to 73.9% (Table 4). Press’s Q test revealed that the classification accuracy is statistically significant better than chance (Press’s Q = 16.759, df = 1,P,0.001).
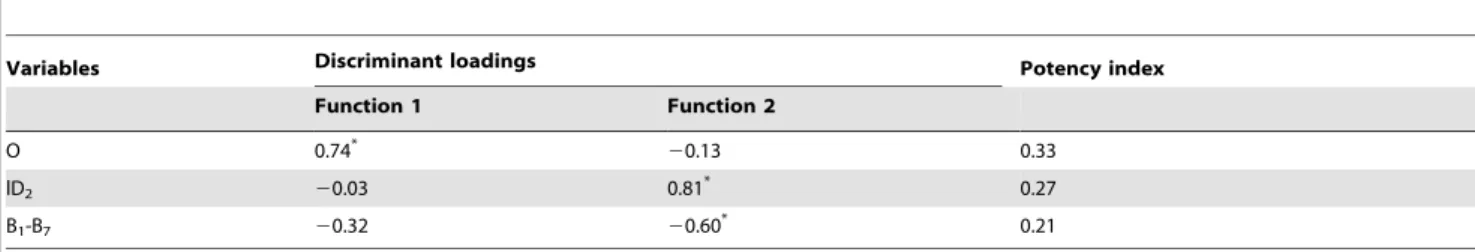
The interpretation of the plot in figure 3a indicates that Function 1 is the primary source of separation between Group 2 (river Tagus’ lampreys) and Group 3 (river Guadiana’s lampreys); whereas Function 2 discriminates Group 1 (Northern river basins’ lampreys) from the remaining. Discriminant loadings and potency index were used to assess the contributions of the three discriminant morphometric variables (Table 5). High correlations between the discriminant loadings of the variable O with the first function, and lD2 and B1-B7with the second function identified the variables with the best discriminatory power for each axis (Table 5). The character O was the variable with the highest potency index value and can be considered the most important morphometric character to distinguish adultP. marinus entering Tagus (mean O = 2.15) and Guadiana (mean O = 2.22) river basins (Table 5). Group 1 lampreys have intermediate size eyes (mean O = 2.18), longer second dorsal fins (mean 1D2= 5.39) and shorter branchial lengths (mean B1-B7= 4.46) when compared with lampreys entering rivers Tagus (1D2= 5.37; B1-B7= 4.48) and Guadiana (1D2= 5.36; B1-B7= 4.47).
Meristic analysis
No significant differences were found between meristic charac-ters of lampreys belonging to the a priori defined geographical groups (Table 3; PERMANOVA, P.0.05) and no significant interaction between gender and group was detected (Table 3; PERMANOVA, P.0.05). The AFteeth, LFteeth and PFteeth showed high variation between specimens, whereas the AFrows and LFrows did not show variation among individuals (Table 6).
Tissue fatty acid profile
Individuals of Group 2 showed significantly higher values of heart total mass (HTM) (P,0.001) than the other two groups. However, no significant differences were detected for HTM/BGM ratio among individuals of the three groups (P.0.05; Table 7). The values of the HTM/BGM ratio were 0.25% for groups 1 and 2 and 0.24% for Group 3 (Table 7).
The heart total lipid content (HTLip) revealed significant differences (P,0.001) among the individuals of the three groups with sea lampreys of Group 2 showing the lowest value (15.3%), and the individuals of Group 3 presenting the highest value (30.8%) (Table 7). For each of the three groups, no significant correlation was found between HTM and HTLip.
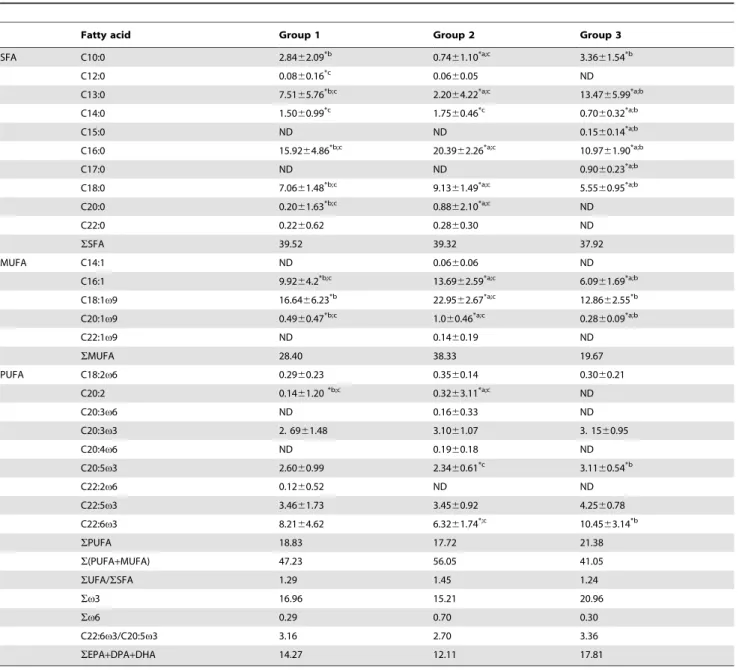
The fatty acid profile of the heart tissue phospholipids varied among individuals of the three groups (Table 8). Gender had no significant effect (MANOVA, P.0.05) in fatty acid relative Table 3. PERMANOVA results for the two-way crossed design, with geographical group and sex as factors, and meristic characters as variables.
Source Df SS MS Pseudo-F P(perm) Unique perms
Group 2 0.821 0.410 1.498 0.193 9942 Sex 1 0.569 0.569 2.078 0.124 9951 Group 6 Sex 2 0.517 0.258 0.943 0.437 9955 Residual 181 49.592 0.274 Total 186 51.493 doi:10.1371/journal.pone.0108110.t003
composition of phospholipids of heart tissue, whereas geographical groups exhibited a significant effect (MANOVA, P#0.001). The interaction gender*geographical group had no significant effect in this variable (MANOVA,P.0.05).
The predominant class of fatty acids in heart tissue was the saturated fatty acids (SFA), with percentages that ranged from 37.92% in individuals from Group 3, to 39.52% in individuals of Group 1 (Tab. 8). The major exception was recorded in sea lampreys from Group 2, where the percentage of SFA was similar to that of monounsaturated fatty acids (MUFA). In what concerns MUFA, individuals of Group 3 were characterized by the lowest values (19.67%), and individuals of Group 2 were characterized by the highest values (38.33%). Polyunsaturated fatty acid (PUFA) relative percentages varied between 17.72% (Group 2) and 21.38% (Group 3) (Table 8).
The predominant fatty acids detected were C16:0, C18:0 and C13:0 for SFA; C18:1v9 and C16:1 for MUFA; and C22:6v3 (DHA), C22:5v3 (DPA) and C20:5v3 (EPA) for PUFA. The percentage content of EPA and DHA demonstrates the domi-nance of DHA over EPA (DHA/EPA ratio) Although occurring at relative low amounts, several odd chain fatty acids like C13:0; C15:0; C17:0 and C17:1, were also present in heart tissue fatty acid profiles (Table 8). The unsaturated-to-saturated ratio (UFA/ SFA) was used as an indirect indicator of the membrane fluidity (Table 8), since it has been previously reported that membranes with high UFA/SFA ratio show a high fluidity [43]. Individuals from Group 2 presented the highest value (1.45), and individuals of Group 3 exhibited the lowest value (1.24), but no significant differences were observed (P.0.05). The unsaturation index (UI) was higher in Group 3 (132), followed by Group 1 (125) and by Group 2 (116), but no significant differences were observed (P. 0.05).
The MDA for the 19 fatty acids proved to be statistically significant and the overall corrected classification rate estimated from cross-validation procedure was 83.8% (Fig. 3b). All lampreys from Group 3 were correctly classified (100%) and not mixing with the sea lampreys from any of the other groups, reflecting a typical heart fatty acid signature for individuals of this group (Fig. 3b, Table 9). It is also interesting to note that, 89.5% and 72.2% of the individuals from groups 2 and 1, respectively, were also correctly classified (Table 9). The fatty acids that contributed to the segregation of groups were the SFA C17:0 (35.9%) and C16:0 (25%); the MUFA C18:1v9 (14.1%); and the PUFA C20:3v6 (4.7%) and C22:2v6 (3.3%). The fatty acid with the highest
potency index that contributed for the separation of the sea lamprey groups was C17:0. Press’s Q test revealed that the classification accuracy was significantly better than chance (Press’s Q = 754.735gdl = 1; P#0.001).
Discussion
Morphological variation and potential adaptation in the proposed groups
Sexual dimorphism among mature lampreys is well known and appears to be similar in all lamprey species [44]. This study data showed that male adult sea lampreys captured in the beginning of the spawning migration weight less than females, and although some additional subtle morphometric differences between genders were found, no obvious secondary sex characters were detected. Males show an increased prebranchial length and oral disc size, while females have a longer and wider trunk, similar to the findings of [45] for the Arctic lampreyLethenteron camtschaticum (Tilesius, 1811). A larger head in males is most likely related with distinctive behaviours during the spawning period, in particular nest construction and agonistic behaviour when competing for females. A stronger suctorial capacity provided by larger oral discs may be an important characteristic to maximize reproductive success among males. Similar results were described for Southern Hemisphere species of the generaGeotria and Mordacia, of which an increase in size of the male oral disc, associated with an extension in the length of the preorbital region, was observed [46], [47]. The larger trunk observed in females is most likely related with the maximization of space for the development of the gonads, thus increasing fecundity. Elongated trunk in female lampreys was also described by [48] for the European river lampreyLampetra fluviatilis L.
Morphologically, the classification rate estimated for animals from River Tagus (Group 2) was 57%, which means that most of the animals that entered this river to spawn presented similar characteristics, even though a considerable number of lampreys showed a morphological profile compatible with the other two groups. A poor discrimination rate (39%) was found for the northern lampreys pooled in Group 1 (i.e., rivers Minho, Lima, Ca´vado, Douro, Vouga and Mondego). This result indicates that specimens from this geographical region are morphologically more diverse when compared with sea lampreys entering Tagus and Guadiana basins. The wider range of abiotic scenarios like depth (see Fig. 1 for sea floor topography), observed in the oceanic area
Figure 3. Plot of the discriminantZscores and group centroids of discriminate functions 1 and 2 for the three groups of adult sea lampreys based on (a) morphometric characters and (b) fatty acid composition of heart total lipids. n - Group 1: Minho, Lima, Ca´vado, Douro, Vouga and Mondego basins; # - Group 2: Tagus; , - Group 3: Guadiana.
doi:10.1371/journal.pone.0108110.g003
Table 4. Classification results obtained with the stepwise discriminant analysis cross-validation for morphometric characters to determine the predictive accuracy level of the discriminant functions.
Groups N Percent correct Predicted Group Membership (count)
Group 1 Group 2 Group 3
Group 1 36 38.9 14 11 11 Group 2 28 57.1 7 16 5 Group 3 23 73.9 5 1 17 Total 87 54.0 N, number of individuals. doi:10.1371/journal.pone.0108110.t004
where northern lampreys occur, when compared with the other oceanic feeding areas discussed here, may lead to a higher morphological variability during the parasitic phase and, conse-quently, a lower classification rate of lampreys from Group 1. Also, this northern group may have lampreys originally from other oceanic regions, namely the Galicia Interior Basin or even the Biscay Abyssal Plain region, thus contributing to the low predicted group membership.
Three morphometric variables were considered significant in discriminating the three groups: eye length, second dorsal fin length and branchial length. The larger eye and longer branchial lengths of the Guadiana lampreys can be indicative of deeper feeding grounds, and the need for a more efficient mechanism of blood oxygenation. Comparatively, the relatively smaller eye and branchial length of the Northern lampreys may reveal shallower feeding grounds, and a less stressful demand for oxygen. Interestingly, the Northern lampreys with the lower classification rate, for both morphometric and heart fatty acid characters, was composed by individuals with longer second dorsal fins and thus, in theory, more capable for longer dispersions. The Guadiana lampreys had the highest classification rates among the three groups and the shortest second dorsal fin.
Heart total mass/body gutted mass ratio in the proposed groups
The values of HTM/BGM ratio obtained for all individuals of the three geographical groups were similar (,0.25%). This value is consistent with previous studies also with sea lamprey (,0.3%; [49]), and similar to the characteristic values obtained for other poikilothermic vertebrates (0.08%–0.30% for fish, and 0.19% for
amphibians and reptiles), but distant from the values usually determined in mammals (0.64%) [50].
In vertebrates this ratio reflects a direct relationship between the size of heart and oxygen consumption [51]. One would expect that lampreys from Group 3, with longer branchial lengths that may maximize oxygen uptake in less oxygenated habitats, would have a higher HTM/BGM ratio, but this was not the case.
Our results showed that individuals of Group 3 were characterized by the highest HTLip content. This result can be an indicator of increased rate of oxidative metabolism of fatty acids, since in cardiac muscle over 70% of energy consumed for electro-mechanical activity is covered by mitochondrial oxidation of fatty acids [52]. A study among 16 species of teleost fish revealed that glucose metabolism and fatty acid utilization increase with the increased energy demand [53]. According to this, our result suggests a higher demand for fatty acid oxidative metabolism of animals sampled in Group 3, comparatively to the individuals belonging to groups 1 and 2.
A lack of correlation between HTM and HTLip was expected because under physiological conditions, myocardial triacylglicerol stored in lipid droplets in the cytoplasm of the cardiac muscle cells is in a steady state condition, where no major alterations in the absolute amount of triacylglicerol fatty acids occur [52].
Heart tissue fatty acid profile in the proposed groups
For all three groups, heart tissue fatty acid profile showed that SFA were the most representative. In groups 1 and 2 these were followed by MUFA and then PUFA whereas in Group 3, the MUFA and PUFA order was inverted. Moreover, since cardiac skeletal muscle contains a significant content of phospholipids, C16:0, C18:0, C16:1 and C18:1v9 high relative amounts are in Table 5. Summary of discriminant loadings and potency index for morphometric and meristic variables.
Variables Discriminant loadings Potency index
Function 1 Function 2 O 0.74* 20.13 0.33 lD2 20.03 0.81 * 0.27 B1-B7 20.32 20.60* 0.21
Acronyms of variables as defined in Figure 2; * largest absolute correlation between each variable and any discriminant function. doi:10.1371/journal.pone.0108110.t005
Table 6. Summary statistics for the meristic characters analysed in the sub sample of 201 sea lamprey individuals included.
Meristic Mean SD Min. Max
Myo 73.1 1.6 68 78 TNteeth 148.6 8.0 128 170 AFteeth 39.5 3.8 29 49 LFteeth 62.4 2.9 54 69 PFteeth 37.2 2.7 31 46 TNrows 25.2 0.4 24 27 AFrows 7.0 0.0 7 7 LFrows 8.0 0.0 8 8 PFrows 9.2 0.4 8 11 IOcusps 7.5 0.7 6 10
Acronyms of variables as defined in Figure 2; SD, standard deviation; Min, minimum; Max, maximum. doi:10.1371/journal.pone.0108110.t006
accordance with the fact that those fatty acids are the most common in thesn-1 position of phospholipids [38], [54]. Omega-3 fatty acids were also present In fact, the stable genetic basis of the fatty acid composition of heart tissue phospholipids [18], [20], [24], [25] in addition to the clear tendency for certain types of fatty acids to be incorporated into the sn-1 and sn-2 positions of the structural phospholipids, restrict the ability of the acyl chains to reflect diet.
Based on that, the fatty acid pool of polar lipids is considered stable over time and studies done with two stocks of reared Atlantic cod had already demonstrated it [18].The C13:0 showed higher values than expected and the explanation for these results is not known. However, this fatty acid could be associated to the presence of microbial sources considering some authors that C13:0 could be a useful of microbial presence on detritus [55–58].
Although ectothermic animals appear to increase the mem-brane content of unsaturated fatty acids in response to colder temperatures, a clear and direct relationship between specific unsaturated fatty acids and quantitative measurements of mem-brane fluidity has not been demonstrated [54]. In fact, a given overall fluidity level can be met by various fatty acids composi-tions, and often the fluidity of cellular membranes can be adjusted by converting SFA to MUFA, while the PUFA levels remain unaltered [59]. Because our results revealed that the unsaturated/ saturated fatty acid ratio and unsaturation index were not significantly different among groups, this could mean that different fatty acid signatures were not caused by a direct effect of temperature on the phospholipids of heart tissue, but it is reasonable to believe that fatty acid profiles are phenotypic characters that must be correlated with differences in the abiotic factors that characterized different habitats and results from adaptation processes.
Physiological adaptation to environmental conditions
Fish species inhabiting areas where environmental conditions are relatively stable and constant may develop a specialization of their membranes phospholipids that allow them to adapt to the environment where they live [60]. Habitats are different in many ways (e.g. temperature, salinity, pressure), so it is reasonable to hypothesize that environmental differences may lead to adjust-ments of the expression of several genes, resulting, for instance, in distinct heart tissue fatty acid signatures. Then, considering the heart tissue fatty acid profile as a phenotypic variation, the presence of different fatty acid signatures likely indicates limited mixing among groups and may offer a practical measure for stock discrimination [18], [23]. The differences in the heart tissue fatty acid profile of individuals of the geographical groups seem to result
from the influence of environmental factors during the oceanic trophic phase of the lampreys’ life cycle and to the geographical isolation promoted by seabed topography.
If this hypothesis is correct, it is possible that the oceanic phase of the sea lamprey life cycle, following the dispersion period during the juvenile trophic migration, is represented by a much less mobile adult stage restricting the mixture of lampreys from different geographical groups. This limited dispersal in marine environment was also highlighted in a recent work by Spice et al. [61] with Pacific lamprey (Entosphenus tridentatus Gairdner in Richardson 1836) and supported by Silvaet al. [28] that suggest that at least a fraction of the sea lamprey population can reach adult size in approximately 14 months of hematophagous feeding. Moreover, part of this parasitic period can be spent feeding in rivers and estuaries before the trophic migration to the sea [62], so the marine stage might be even shorter than one year.
Marine trophic phase and target host species
Dispersal is often density-dependent in a wide variety of taxa [63]. Due to population density, dispersal may relieve pressure for resources in an ecosystem, and competition for these resources may be a selection factor for dispersal mechanisms [64].
It is likely that the absence of large pelagic fish species (inexistence of salmonids and drastic reduction of shads Alosa sp.) in the southwest and south coasts of Portugal, induces sea lamprey juveniles undergoing their marine trophic phase to target benthic fish species [65]. On the other hand, the northern Portuguese river basins, which have a higher proportion of individuals in relation to Tagus and Guadiana groups [14], [66], can prey upon pelagic fish and thus experience a wider dispersion throughout the neighbouring marine areas and, consequently, river basins. Sea lampreys from the west coast of Portugal apparently present some clues that indicate the existence of two different trophic pathways, one typical of a top predator of a marine food web with a planktonic base, and the other including both planktonic and benthonic species [65]. Since benthonic fish are usually less vagrant in the adult stage when compared with the more mobile pelagic species [67], the migrations of adult sea lampreys between feeding areas (i.e. stocks) would be attenuated, and differences in the fatty acid profile of heart most likely arise under those circumstances.
Juvenile dispersal, feeding areas and spawning migration
The three sea lamprey groups here identified are probably associated to the three isolated abyssal plains (and/or nearby continental slopes) off western Iberian Peninsula, and it is likely that they constitute three different stocks. Throughout the Table 7. Mean (6 standard deviation) heart total mass (HTM, g), heart total mass/body gutted mass ratio (HTM/BGM expressed in percentage), mean heart total lipids (HTLip, expressed in g per g of dry tissue), heart water loss (HWater, expressed as percentage) and sex ratio of sea lamprey individuals analysed.
Variables Group 1 Group 2 Group 3
HTM 2.8960.5*b 3.3460.4*a,c 2.7660.3*b HTM/BGM 0.25 0.25 0.24 HTLip 0.24*b,c 0.15*a,c 0.31*a,b HWater 73.0762.7 71.2361.9 75.3261.2
Sex Ratio (male/female) 0.48 0.46 0.68
Cases in which the relative amounts of a fatty acid are significantly different (P, 0.001) among the groups are marked with signs: *a: significantly different from Group 1; *b: significantly different from Group 2; *c significantly different from Group 3.
Table 8. Relative amounts, as percentage of sum (mean 6 sd), of fatty acids in heart tissue total lipids of sea lamprey individuals analysed.
Fatty acid Group 1 Group 2 Group 3
SFA C10:0 2.8462.09*b 0.7461.10*a;c 3.3661.54*b C12:0 0.0860.16*c 0.0660.05 ND C13:0 7.5165.76*b;c 2.2064.22*a;c 13.4765.99*a;b C14:0 1.5060.99*c 1.7560.46*c 0.7060.32*a;b C15:0 ND ND 0.1560.14*a;b C16:0 15.9264.86*b;c 20.3962.26*a;c 10.9761.90*a;b C17:0 ND ND 0.9060.23*a;b C18:0 7.0661.48*b;c 9.1361.49*a;c 5.5560.95*a;b C20:0 0.2061.63*b;c 0.8862.10*a;c ND C22:0 0.2260.62 0.2860.30 ND SSFA 39.52 39.32 37.92 MUFA C14:1 ND 0.0660.06 ND C16:1 9.9264.2*b;c 13.6962.59*a;c 6.0961.69*a;b C18:1v9 16.6466.23*b 22.9562.67*a;c 12.8662.55*b C20:1v9 0.4960.47*b;c 1.060.46*a;c 0.2860.09*a;b C22:1v9 ND 0.1460.19 ND SMUFA 28.40 38.33 19.67 PUFA C18:2v6 0.2960.23 0.3560.14 0.3060.21 C20:2 0.1461.20*b;c 0.3263.11*a;c ND C20:3v6 ND 0.1660.33 ND C20:3v3 2. 6961.48 3.1061.07 3. 1560.95 C20:4v6 ND 0.1960.18 ND C20:5v3 2.6060.99 2.3460.61*c 3.1160.54*b C22:2v6 0.1260.52 ND ND C22:5v3 3.4661.73 3.4560.92 4.2560.78 C22:6v3 8.2164.62 6.3261.74*;c 10.4563.14*b SPUFA 18.83 17.72 21.38 S(PUFA+MUFA) 47.23 56.05 41.05 SUFA/SSFA 1.29 1.45 1.24 Sv3 16.96 15.21 20.96 Sv6 0.29 0.70 0.30 C22:6v3/C20:5v3 3.16 2.70 3.36 SEPA+DPA+DHA 14.27 12.11 17.81
SFA, saturated fatty acids; MUFA, monounsaturated fatty acids; PUFA, polyunsaturated fatty acids. Cases in which the relative amounts of a fatty acid are significantly different (P, 0.001) among the groups are marked with signs: *a: significantly different from group 1; *b: significantly different from group 2; *c significantly different from group 3. Fatty acids C6:0 and C8:0 are not presented because were not detected in each one of the three groups. ND, not detected.
doi:10.1371/journal.pone.0108110.t008
Table 9. Classification results obtained with the stepwise MDA cross-validation for heart tissue fatty acids to determine the predictive accuracy level of the discriminant functions.
Number of individuals classified into group
Groups N Percent Correct North/Central Tagus Guadiana
North/Central 36 72.2 26 8 2
Tagus 19 89.5 1 17 1
Guadiana 19 100 0 0 19
Total 74 83.4 – – –
juveniles’ trophic migration it is likely that some mixture between groups occurs, particularly between the northern (Group 1) and the Tagus (Group 2) stocks, which would be in agreement with the dispersal phase of some marine fish species during the juvenile stage in the same geographical area [68]. The lack of genetic differentiation between groups (results not shown, unpublished data) corroborates this scenario: since adults present significant levels of differentiation at the morphological and physiological levels, and there is genetic mixing between groups, the juvenile migration is most likely accompanied by dispersal among basins. During the spawning migration, lampreys seem to preferentially move north, probably attracted by the exceptional freshwater flow originated in northern river basins, particularly those north of river Douro, inclusive. In fact, eight animals sampled in the northern group presented characteristics of the Tagus’ group.
The bulk of the juvenile lampreys from the isolated Guadiana river basin (Group 3) probably migrate to the feeding areas located at the Horshoe Abyssal Plain or nearby areas, which is located on the southern Iberian margin off western the Mediterranean Sea, and return to spawn in their river of origin. The impact of the Mediterranean Outflow Water (MOW) in the potential feeding area of animals entering the River Guadiana is particularly evident between 500 to 1400 m and shows higher temperatures and salinities than the North Atlantic Central Water (NACW) [69]. The unique conditions caused by the MOW influence may be responsible for the high distinct heart tissue fatty acid profile found in lampreys from group 3, as revealed by the 100% predictive accuracy level. In the oceanic zone over the continental slope, from December to February the dominant current (depth up to 1200 m) is oriented northward (Ana Teles-Machado and A´ lvaro Peliz, unpublished data). This may impel adult sea lampreys approaching the continent in the beginning of the spawning migration to the north with the prevailing current. Moreover, near the continental shelf, the dominant current is southward, and migrating sea lampreys may be once again oriented northward attracted by the odours transported from the northern rivers basins, which present higher ammocoete densities and river discharges than the Tagus or Guadiana river basins. This might explain why the North-Central group showed the occurrence of eight lampreys from the Tagus group and two from the Guadiana group.
In conclusion, the significant morphological and physiological differences found between groups are most likely the result from the influence of environmental factors to which lampreys may have been exposed during the oceanic trophic phase of the life cycle, rather than derived from a genetic basis. This would imply that the oceanic phase of the sea lamprey life cycle is composed by
a dispersion period during the juvenile migration, followed by a much less mobile adult stage, which will restrict the mixture of adult lampreys from different geographical groups, segregated by seabed topography.
Implications for conservation
The population structure put in evidence in this work have important implications in terms of management and conservation of P. marinus in Portugal, where it is considered threatened. Three stocks of this species are apparently present in Atlantic waters off country: the northern, the Tagus and the Guadiana stocks. The first includes individuals from Minho, Lima, Ca´vado, Douro, Vouga and Mondego river basins and, possibly, from North-western Spain (Galician rivers; not included in this study). A considerable number of lampreys still use the above referred basins for reproduction [66], except in River Douro, where apparently there are no suitable conditions for nest building in the available 20 km of river stretch downstream of the first obstacle [3]. The probable existence of a common stock in north-western Iberian waters reinforces the need for international joint efforts to manage this halieutic resource, commercially exploited both in Portuguese and Spanish watersheds.
Tagus and Guadiana stocks are, however, priority in conser-vation terms. The number of lampreys entering these basins, particularly in the southern Guadiana river basin, is very scarce. The existence of a lamprey stock composed mainly by sea lampreys originally from the Guadiana basin raises some concerns about the future of the species in its southern limit of distribution, mainly due to the hydric stress known to occur in this basin, and exacerbated by the potential effects of climate change.
Acknowledgments
This work was financially supported by Foundation for Science and Technology (FCT) through project PTDC/BIA-BDE/71826/2006 and also by FEDER Funds through the Operational Programme for Competitiveness Factors - COMPETE and National Funds through FCT - Foundation for Science and Technology under the Strategic Project PEst-C/AGR/UI0115/2011.
We thank our colleagues Carlos Alexandre, Sı´lvia Pedro and Filipe Roma˜o for helping with tissue sampling and preparation.
Author Contributions
Conceived and designed the experiments: MJL BQ PA. Performed the experiments: MJL MM CM ML AF BQ PA. Analyzed the data: MJL BQ PA. Contributed reagents/materials/analysis tools: MJL MM CM ML AF. Wrote the paper: MJL CM BQ PA.
References
1. Lelek A (1987) The Freshwater Fishes of Europe, Volume 9: Threatened fishes of Europe. Wiesbaden: Aula-Verlag. 343 p.
2. Renaud CB (1997) Conservation status of Northern Hemisphere lampreys (Petromyzontidae). J Appl Icthyol 13: 143–148.
3. Mateus CS, Rodrı´guez-Mun˜oz R, Quintella BR, Alves MJ, Almeida PR (2012) Lampreys of the Iberian Peninsula: distribution, population status and conservation. Endanger Species Res 16: 183–198.
4. Rogado L, Alexandrino P, Almeida PR, Alves J, Bochechas J, et al. (2005) Peixes. In: Cabral MJ, et al., editors. Livro vermelho dos vertebrados de Portugal. Lisboa: Instituto de Conservac¸a˜o da Natureza. pp. 63–114. 5. Farmer GJ (1980) Biology and physiology of feeding in adult lamprey.
Can J Fish Aquat Sci 37: 1751–1761.
6. Halliday RC (1991) Marine Distribution of the Sea Lamprey (Petromyzon marinus) in the Northwest Atlantic. Can J Fish Aquat Sci 48: 832–842. 7. Bergstedt RA, Steelye JG (1995) Evidence for lack of homing by sea lampreys.
Trans Am Fish Soc 124: 235–239.
8. Genner MJ, Hillman R, McHugh M, Hawkins SJ, Lucas MC (2012) Contrasting demographic histories of European and North American sea lamprey
(Petromyzon marinus) populations inferred from mitochondrial DNA sequence variation. Mar Freshw Res 63: 827–833.
9. Waldman J, Grundwald C, Wirgin I (2008) Sea lampreyPetromyzon marinus: an exception to the rule of homing in anadromous fishes. Biol Lett 4: 659–662. 10. Barlow GW (1961) Causes and significance of morphological variation in fishes.
Syst Zool 10: 105–117.
11. Ta˚ning AV (1952) Experimental study of meristic characters in fishes. Biol Rev Camb Philos Soc 27: 169–193.
12. Melvin GD, Dadswell MJ, McKenzie A (1992) Usefulness of meristic and morphometric characters in discriminating populations of American shad (Alosa sapidissima) (Ostreichthyes: Cluoeidae) inhabiting a marine environment. Can J Fish Aquat Sci 49: 266–280.
13. Ihssen PE, Booke HE, Casselman JM, McGlade JM, Payne NR, et al. (1981) Stock identification: materials and methods. Can J Fish Aquat Sci 38: 1838– 1855.
14. Almeida PR, Tomaz G, Andrade NO, Quintella BR (2008) Morphological analysis of geographic variation of sea lamprey ammocoetes in Portuguese river basins. Hydrobiologia 602: 47–59.
15. Begg GA, Waldman JR (1999) An holistic approach to fish stock identification. Fish Res 43: 35–44.
16. Marr JC (1957) The problem of defining and recognizing subpopulations of fishes. In: Marr JC. Contributions to the studies of subpopulations of fishes, Special Scientific Report nu 208. Washington D.C.: United States Department of Interior, Fish and Wild Life Services. pp. 1–6.
17. Saila S, Jones C (1983) Fishery Science and the Stock Concept - Final Report P.O. NA83-B-A-0078 (MS). US National Marine Fisheries Service, Northeast Fisheries Center, Woods Hole, M.A. 02543.
18. Joensen H, Steingrund P, Fjallstein I, Grahl-Nielsen O (2000) Discrimination between two reared stocks of cod (Gadus morhua) from the Faroe Islands by chemometry of the fatty acid composition in the heart tissue. Mar Biol 136 (3): 573–80.
19. Waldman JR, Grossfield J, Wirgin I (1988) Review of stock discrimination techniques for striped bass. N Am J Fish Manag 8: 410–425.
20. Joensen H, Grahl-Nielsen O (2000) Discrimination of Sebastes viviparus, Sebastes marinus and Sebastes mentella from Faroe Islands by chemometry of the fatty acid profile in the heart and gill tissues and in the skull oil. Comp Biochem Physiol Biochem Mol Biol 126: 69–79.
21. Grahl-Nielsen O (2005) Fatty acid profiles as natural marks for stock identification. In: Cadrin SX, Friedland KD, Waldman J, editors. Stock identification methods: applications in fishery science. Amsterdam: Elsevier Academic Press. pp.247–271.
22. Hishikawa D, Shindou H, Kobayashi S, Nakanishi H, Taguchi R, et al. (2008) Discovery of a lysophospholipid acyltransferase family essential for membrane asymmetry and diversity. Proc Natl Acad Sci U.S.A. 105: 2830–2835. 23. Joensen H, Grahl-Nielsen O (2004) Stock structure ofSebastes mentalla in the
North Atlantic revealed by chemometry of the fatty acid profile in heart tissue. ICES J Mar Sci 61: 113–126.
24. Grahl-Nielsen O, Averina E, Pronin N, Radnaeva L, Ka¨kela¨ R (2011) Fatty acid profile in different fish species in Lake Baikal. Aquat Biol 13: 1–10. 25. Joensen H, Grahl-Nielsen O (2001) The redfish species Sebastes viviparus,
Sebastes marinus and Sebastes mentella have different composition of their tissue fatty acids. Comp Biochem Physiol Biochem Mol Biol 129, 73–85.
26. Grahl-Nielsen O, Mjaavatten O (1992) Discrimination of striped bass stocks: a new method based on chemometry of the fatty acid profile in heart tissue. Trans Am Fish Soc 121: 307–314.
27. Grahl-Nielsen O, Ulvund KA (1990) Distinguishing populations of herring by chemometry of fatty acids. Am Fish Soc Sympos 7: 566–571.
28. Silva S, Servia MJ, Vieira-Lanero R, Barca S, Cobo F (2013) Life cycle of the sea lampreyPetromyzon marinus: duration of and growth in the marine life stage. Aq Biol 18: 59–62.
29. Beamish FWH (1980) Biology of the North American anadromous sea lamprey, Petromyzon marinus. Can J Fish Aquat Sci 37: 1924–1943.
30. Bashmachnikov I, Neves F, Nascimento A, Medeiros J, Ambar I, et al. (2014) Detailed temperature–salinity distribution in the Northeast Atlantic from ship and Argo vertical casts. Ocean Sci Discuss 11: 1473–1517, doi:10.5194/osd-11-1473-2014, 2014.
31. Vladykov VD, Follett WI (1967) The teeth of lampreys (Petromyzonidae): their terminology and use in a key to the holarctic genera. J Fish Res Board Can 24: 1067–1075.
32. Holcˇı´k J (1986) Determination criteria. In: Holcˇı´k J, editor. The freshwater fishes of Europe Vol. 1, Part I – Petromyzontiformes. Wiesbaden: Aula-Verlag. pp.24– 32.
33. Gill HS, Renaud CB, Chapleau F, Mayden RL, Potter IC (2003) Phylogeny of living parasitic lampreys (Petromyzontiformes) based on morphological data. Copeia 4 (2003): 687–703.
34. Collins TJ (2007) Image J for microscopy. BioTech 43: 25–30.
35. Bancroft J, Gamble M (2002) Theory and Practice of Histological Techniques 5th
Edition. London: Churchill Livingstone. 725 p.
36. Lanc¸a MJ, Rosado C, Machado M, Ferreira R, Alves-Pereira I, et al. (2011) Can muscle fatty acid signature be used to distinguish diets during the marine trophic phase of sea lamprey (Petromyzon marinus, L.)? Comparative Biochemistry and Physiology, Part B 159: 26–39.
37. Morrison WR, Smith LM (1964) Preparation of fatty acid methyl esters and dimethylacetals from lipids with boron fluoride-methanol. J Lipid Res 5: 600– 608.
38. Logue JA, De Vries AL, Fodor E, Cossins AR (2000) Lipid compositional correlates of temperature-adaptative interspecific differences in membrane physical structure. J Exp Biol 203: 2105–2115.
39. Schaefer KM (1991) Geographic variation in morphometric characters and gill-raker counts of Yellowfin Tuna,Thunnus albacares, from the Pacific Ocean. Fish Bull 89: 289–297.
40. Claytor RR, MacCrimmon HR (1987) Partitioning size from morphometric data: a comparison of five statistical procedures used in fisheries stock identification research. Canada: Canadian Technical Report of Fisheries and Aquatic Services nu1531, Minister of Supply and Services.
41. Hair JF, Anderson RE, Tatham RL, Black WC (1998) Multivariate Data Analysis, 5th
edition. USA: Prentice Hall. 768 p.
42. Tocher DR (2003) Metabolism and functions of lipids and fatty acids in fish. Rev Fish Sci 11: 107–184.
43. Casadei MA, Man˜as P, Niven G, Needs E, Mackey BM (2002) Role of membrane fluidity in pressure resistence ofEscherichia coli NCTC 8164. Appl Environ Microbiol 68: 5965–5972.
44. Hardisty MW, Potter IC (1971) The general biology of adult lampreys. In: Hardisty MW, Potter IC, editors. The biology of lampreys Vol. 1. London: Academic Press. pp.127–206.
45. Kucheryavyi AV, Savvaitova KA, Gruzdeva MA, Pavlov DS (2007) Sexual dimorphism and some special traits of spawning behavior of the Arctic Lamprey Lethenteron camtschaticum. J Ichthyol 47: 481–485.
46. Potter IC, Strahan R (1968) The taxonomy of the lampreys Geotria and Mordacia and their distribution in Australia. Proc Linn Soc Lond 179: 229–240. 47. Potter IC, Lanzing WJR, Strahan R (1968) Morphometric and meristic studies on populations of Australian lampreys of the genusMordacia. Zool J Linn Soc 47: 533–546.
48. Hardisty MW (1986)Lampetra fluviatilis (Linnaeus, 1758). In: Holcˇı´k J, editor. The freshwater fishes of Europe Vol 1, Part I 2 Petromyzontiformes. Wiesbaden: Aula-Verlag. pp. 249–278.
49. Claridge PN, Potter IC (1974) Heart Ratios at Different Stages in the Life Cycle of Lampreys. Acta Zool 55: 61–69.
50. Poupa A, Ostadal B (1969) Experimental cardiomegalies and cardiomegalies in free living animals. Ann N Y Acad Sci 156: 445–468.
51. Hardisty MW, Potter IC (1972) The circulatory system. In: Hardisty MW, Potter IC editors. The biology of lampreys, Vol. 2. London: Academic Press. pp.241– 259.
52. van der Vusse GJ, Van Bilsen M, Glatz JFC (2000) Cardiac fatty acid uptake and transport in health and disease. Cardiovasc Res 45: 279–293.
53. Sidell BD, Driedzic WR, Stowe DB, Johnston IA (1987) Biochemical correlations of power development and metabolic fuel preferenda in fish hearts. Physiol Zool 60: 221–232.
54. Arts MT, Kohler CC (2009) Health and condition in fish: the influence of lipids on membrane competency and immune response. In: Arts MT, Brett MT, Kainz MJ, editors. Lipids in aquatic ecosystems. New York: Springer. pp. 237– 255.
55. Kaneda T (1991) Iso- and Anteiso-Fatty Acids in Bacteria: Biosynthesis, Function, and Taxonomic Significance. Microbiol Rev 55: 288–302. 56. Mayzaud P, Chanut JP, Ackman RG (1989) Seasonal changes of the
biochemical composition of marine particulate matter with special reference to fatty acids and sterols. Mar Ecol Prog Ser 56: 189–204.
57. Lechevalier MP (1982) Lipids in bacterial taxonomy. In: Laskin AI, Lechevalier HA, editors. CRC Handbook of Microbiology. Boca Raton, Florida: CRC Press, Inc. pp.435–541.
58. Rajendran N, Suwa Y, Urushigawa Y (1993) Distribution of phospholipid ester-linked fatty acids biomarkers for bacteria in the sediment of Ise Bay. Mar Chem 42: 39–56.
59. Brooks S, Clark GT, Wright SM, Trueman RJ, Postle AD, et al. (2002) Electrospray ionization mass spectrometric analysis of lipid restructuring in the carp (Cyprinus carpio L.) during cold acclimation. J Exp Biol 205: 3989–3997. 60. Cossins AR, Prosser CL (1978) Evolutionary adaptation of membranes to
temperature. Proc Natl Acad Sci U.S.A. 75: 2040–2043.
61. Spice EK, Goodman DH, Reid SB, Docker MF (2012) Neither philopatric nor panmictic: microsatellite and mtDNA evidence suggests lack of natal homing but limits to dispersal in Pacific lamprey. Mol Ecol 21: 2916–2930.
62. Silva S, Servia MJ, Vieira-Lanero R, Cobo F (2013) Downstream migration and hematophagous feeding of newly metamorphosed sea lampreys (Petromyzon marinus Linnaeus, 1758). Hydrobiologia 700: 277–286.
63. Amarasekare P (2004) The role of density-dependent dispersal in source–sink dynamics. J Theor Biol 226: 159–168.
64. Irwin AJ, Taylor PD (2000) Evolution of dispersal in a stepping-stone population with overlapping generations. Theor Popul Biol 58: 321–328.
65. Lanc¸a MJ, Machado M, Ferreira R, Alves-Pereira I, Quintella BR, et al. (2013) Feeding strategy assessment through fatty acid profiles in muscles of adult sea lampreys from the western Iberian coast. Sci Mar 77: 281–291.
66. Quintella BR (2006) Biology and conservation of the sea lamprey (Petromyzon marinus L.). Portugal: PhD Thesis, University of Lisbon.
67. Helfman GS, Collette BB, Facey DE (1997) The diversity of fishes. Massachusetts: Blackwell Science. 528 p.
68. Tanner SE, Reis-Santos P, Vasconcelos RP, Thorrold SR, Cabral HR (2013) Population connectivity ofSolea solea and Solea senegalensis over time. J Sea Res 76: 82–88.
69. Ambar I, Serra N, Brogueira MJ, Cabec¸adas G, Abrantes F, et al. (2002) Physical, chemical and sedimentological aspects of the Mediterranean outflow off Iberia. Deep Sea Res Part II Top Stud Oceanogr 49: 4163–4177.