FACULDADE DE CIÊNCIAS
DEPARTAMENTO DE ENGENHARIA GEOGRÁFICA, GEOFÍSICA E ENERGIA
Unlocking and understanding the demand flexibility in office
buildings
Miguel Coelho Correia Vargues
Mestrado Integrado em Engenharia da Energia e do Ambiente
Dissertação orientada por:
Prof. Dr. Eng. Guilherme Carrilho da Graça
Agradecimentos
Prof. ir. Will Kling, chair of the group Electrical Energy Systems (EES) of the department of Electrical Engineering of Eindhoven University of Technology, whom without ever meeting me before, opened his office door and in a matter of minutes invited me to join the EES group for an internship the year after. His excitement and kindness will ever be in my heart. I would also like to thank PhD. Luis Hurtado and prof. Phuong Nguyen for their attention and introductory help in this master thesis.
Ao Prof. Dr. Eng. Guilherme Carrilho da Graça pela partilha do seu conhecimento, visão e experiência, e também por toda a atenção, paciência e interesse.
Ao Dr. Nuno Mateus por toda a ajuda que me deu durante toda a tese. Por toda a sua paciência e disponibilidade. E por me ter ensinado tanto sobre o tema da tese, mas sobretudo como crescer a nível profissional e pessoal. À Marta Advantaggiato deixo um Grazie Mille. À câmara municipal do Seixal pela disponibilidade em albergar e apoiar as medições desta tese.
Aos meus professores e professoras, em especial ao Prof. Miguel Centeio Brito. À Senhora Leonor Bernardes quero agradecer toda a atenção desde o meu primeiro dia nesta universidade. Aos meus e minhas colegas de curso durante todos os momentos desde o início até ao último dia desta longa caminhada, entre el@s quero deixar um especial agradecimento ao Rodrigo Amaro e Silva, Pedro Fortes Fonseca, Sara Almeida, João Cristóvão e João Bravo Dias, à Catarina Augusto, Bruno Penisga e Raquel Figueiredo.
A tod@s @s meus amig@s que partilharam comigo este percuso da tese de mestrado. Entre eles e elas, um obrigado especial à Rita Cardoso Rodrigues e João Escabelado.
À minha mãe Maria Filomena Coelho, ao meu pai João Vargues e à minha irmã Mariana Vargues por todo o apoio incondicional que sempre me deram em qualquer momento. A toda a minha família por sempre se mostrar preocupada e atenta a todos os passos que dou, deixando em especial um grande abraço ao meu tio Vivaldo Gonçalves.
The rising integration of variable, uncontrollable and hardly predictable renewable energy sources into the energy generation mix of many countries around the world has been increasing the need for solutions that could help the electric power grids maintain the supply and demand balance, at any time. In recent years, demand flexibility in buildings has been studied and presented in different forms, mainly through mathematical formulations. On a demand flexibility event, the goal is not only to change consumption towards helping the grid, but also maintain comfort uninterrupted. Therefore, the grid’s side and the users’ comfort side were two areas that had to be fully studied. Recent studies have started testing these events through simulation in different buildings and climates, but few have empirically tested them. This thesis intended to study the effect of different constructions in a more rudimentary demand flexibility event, but its main goal was to test a demand flexibility event on a real office building, during working hours and without compromising the comfort and the workability of the people in the space. From the proposed methodology of how to study and present a demand flexibility event, five units were stated and used to characterize the event. As a result, the ramp duration of the main event was 94 min and the recovery time 60 min. Both ramp-rate were the same with an increase or a decrease of 335 W/min, and 670 W of actual power decrease was reached. An extrapolation regarding the actual power decrease and the power ramp-rates determined values more close to reality around 9 kW and 4.5 kW/min, respectively. Regarding the comfort side, thermal comfort was mostly assured on average throughout the open space, with two zones being over 0.4 ºC and the average of the space being 0.1 ºC (for a very short period of time) over the operative temperature upper limit of 26 ºC. In the end a simulation of the event was done to validate the empirical results.
Keywords: Demand Flexibility; Office buildings; Indoor comfort; Building energy simulations; Energy plus; Real case study experiment.
Os combustíveis fósseis representam mais de 80% de todo o consumo de energia primária em todo o mundo. A sua utilização leva à emissão de diferentes gases para a atmosfera. Os gases de efeito de estufa são esses gases emitidos por essas fontes e ao se acomularem na atmosfera causam o efeito de estufa e contribuiem para o aquecimento global. A preocupação mundial sobre este tema tem se notado no investimento crescente em energias renováveis e/ou não poluentes. O problema está associado com a natureza de muitas destas fontes renováveis e com a sua integração, que ao serem variáveis no tempo, incontroláveis e de ainda difícil previsão, pode levar ao desiquilibrio do balanço energético. Para remediar essa situação é necessário que a rede eléctrica sofra algumas alterações por forma a torná-la mais atenta e reactiva a qualquer desiquilibro que nela ocorra. Essa busca é então de uma rede electrica mais robusta, mais inteligente na reacção a esses eventos desiquilibradores, mais eficiente, comunicativa e segura. Por forma a garantir este balanço, as redes electricas têm procurado aumentar a flexibilidade operacional através de várias soluções. Entre elas, o corte parcial da produção de energias renováveis como a energia eólica ou o economic load dispatch em centrais de reserva. A gestão do lado do consumo é outra solução que tem vindo a ser estudada por forma a resolver esses problemas crescentes do lado da produção. Entre as soluções existe a resposta de consumo (demand response), eficiência energética e mais recentemente a flexibilidade do lado do consumo (demand flexibility). Quando for possível comunicar bi-direcionalmente na rede eléctrica (solução ainda em desenvolvimento), vai ser possivel estabelecer contacto instantâneo e em tempo real entre o sistema produtor e os diferentes tipos de consumidores. A utilização dos edifícios é cada vez mais vista como uma solução integrada e muito significante, já que representam em média na europa 40% do consumo de energia final. Se o objectivo é assegurar a segurança e o controlo inteligente da rede electrica, então o estudo da flexibilidade em edifícios tem que ser uma solução prioritária. Mais especificamente, os edifícios comerciais representam 40% do consumo total nos edificios, e dentro dos edifícios comerciais, os edifícios educacionais e de escritórios representam 40% do consumo de energia. Alem destes valores, os edifícios de escritórios e os educacionais apresentam semelhanças muito significativas ao nível das fontes de consumo, organização dos espaços e utilização. Mesmo dentro destas parecenças entre estes dois grupos, dentro de cada um as semelhanças são claras, com qualquer edifício de escritório apresentar aproximadamente as mesmas caracteristicas referidas atrás. Por isso, nos últimos anos, a flexibilidade do lado do consumo (demand flexibility) em edifícios deste tipo tem sido a ser estudada e apresentada de diversas formas, habitualmente através de formulações matemáticas. Esta flexibilidade é a capacidade de um edifício alterar o seu consumo, aumentando ou dimininuindo-o, sempre que a rede electrica precisar. Através de uma comunicação instantânea, a rede conhece o estado de flexbilidade dos edifícios, escolhe os que precisa para a situação em particular e informa os edifícios escolhidos. Dependendo do tipo de flexibilidade de cada um, a sua aglomeração e gestão pode ser fulcral para este tipo que desiquilibrios que as fontes renováveis e variáveis tanto, infortutamente promovem. Porque os edifícios de escritórios têm os seus propósitos e utilizações bem definidos, este tipo de solução tem que ser estudada de uma forma completa e consciente. Por isso, num evento de flexibilidade o objectivo não é só garantir que os edifícios mudem o consumo de acordo com o que a rede precisa, mas também que mantenham os padrões de conforto para que a produtividade dos seus trabalhadores não seja afectada. Esta tese pretende estudar estes dois lados, não só a variação do consumo energético mas também o consumo dos utilizadores do espaço. Como esta solução é bastante complexa e o seu estudo ainda está muito no início, a dispersão é grande e a sua própria definição se confunde com outras soluções como o demand response. Além disso, a forma de ser apresentado ainda aparenta não estar definida. Dos estudos que existem, muitos apresentam formulações matemáticas e de programação das conumicações entre o sistema de HVAC, o edifício e a rede eléctrica. Estudos recentes começaram a testar estes eventos de demand flexibility através de simulações de differentes edifícios em diferentes climas. Resultados experimentais existem muito poucos.
problemas de desiquilibrios, nos dois lados da equação. Depois focando-se nos edifícios de escritórios e por fim nos eventos de demand flexibility. Como não existe uma definição e apresentação consensual, nesta tesa ambas são propostas. Depois disso é vez de se perceber que tipo de fontes podem ser mais flexíveis e como é que a energia é transferida dentre deste tipo de sistemas que são os edifícios. Antes dos casos de estudo, o conforto é estudado nas variáveis utilizadas para a sua medição. Num primeiro caso prático estudou-se o efeito de diferentes tipos de construções num evento bastante simples de flexibilidade do lado do consumo. O objectivo era perceber o potencial de differentes construções na flexibilidade energética de um edifício. Para isso foram utilizadas duas salas na Faculdade de Ciências da Universidade de Lisboa, uma com isolamento térmica e outra sem e foram comparadas as curvas de temperatura em ambos. Como o objectivo principal da tese era testar um evento real, num edifício real de escritórios, durante o horário de trabalho e sem comprometer o conforto ou a produtividade dos trabalhadores, foi escolhido um edifício que pudesse oferecer essas condições. O segundo caso de estudo foi feito na Camâra municipal do Seixal, num espaço aberto de escritórios. Este tipo de eventos são caracterizados por uma fase em que o edificio aumenta ou diminui o seu consumo do HVAC até que os limites de conforto sejam atingidos e nessa altura volta ao ponto em que estava de consumo no inicio do evento. Neste caso os ventiloconvectores foram desligados durante um periodo e ligados novamente. Várias variáveis foram medidas, entre elas, os consumos dos ventiloconvectores, dos equipamentos e iluminação, a temperatura do ar, das superfícies, humidade relativa e concentrações de CO2. Assim era possível depois perceber como tinha corrido
o evento. Através da proposta de metodologia de estudo e apresentação deste tipo de eventos, cinco unidades foram distinguidas e usadas para characterizar o mesmo. No evento principal, a duração da primeira parte foi de 94 min e o tempo de recuperação foi de 58 min. Tanto a taxa de subida como descida do consumo foi de 335 W/min e a quantidade máximo de potência que foi reduzida foi de 670 W. Uma extrapolação feita sobre estas duas unidades para o sistema AVAC completo determinou valores aproximados para ambas a rondar os 9 kW e os 4.5 kW/min, respectivamente. Em relação ao conforto, este foi maioritariamente assegurado durante a maior parte do evento, sendo que apenas duas zonas ultrapassaram 0.4 ºC acima do limite máximo da temperatura operative, indicada para medir o conforto térmico, e a média dessa temperatura para o espaço todo só ultrapassou, por um curto espaço de tempo, cerca de 0.1 ºC desse limite. No final foi apresentada uma simulção em EnergyPlus que valida os valores medicos experimentalmente para a temperatura interior do ar, a temperatura operativa e a concentração de CO2.
Palavras-Chave: Flexibilidade do lado do consume;, edifícios de escritórios; conforto interior; simulações energéticas em edifícios; Energy plus; Caso de estudo com parte experimental.
List of figures
Figure 1 - Buildings site energy consumption by end-use ... 23
Figure 2 - World building final energy consumption per end-use in 2010. Source IEA (2013) ... 24
Figure 3 - Consumer load mix. Source [47] ... 25
Figure 4 – Theoretical operational flexibility... 29
Figure 5 – Nominal operational flexibility ... 30
Figure 6 – Actual operational flexibility ... 31
Figure 7 – Building’s demand flexibility ... 37
Figure 8 – Effect of the time constant, τ, in the dynamic change of temperature ... 42
Figure 9 - EnergyPlus program schematic. Source [87] ... 45
Figure 10 – Illustration of a possible building, designed with Sketchup 2015 and the Legacy Open Studio plugin ... 45
Figure 11 – Demand flexibility event. Cooling load. Increasing consumption ... 47
Figure 12 – Demand flexibility event. Cooling load. Decreasing consumption. ... 47
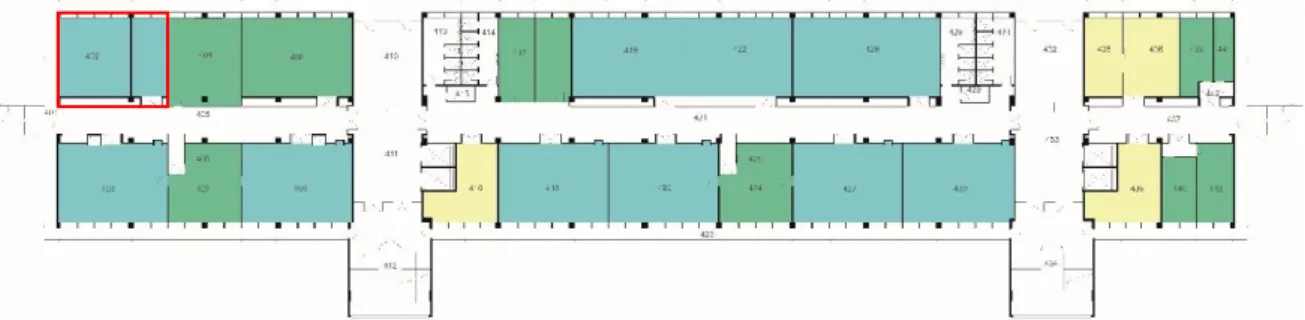
Figure 13 – Architectural plan of the fourth floor of C1 building at FCUL ... 48
Figure 14 – Sketchup design of both laboratory rooms ... 48
Figure 15 – Surface names for each surface in the facade ... 48
Figure 16 – Internal loads (lamps) positioning in each room ... 51
Figure 17 – Seixal’s City Hall ... 54
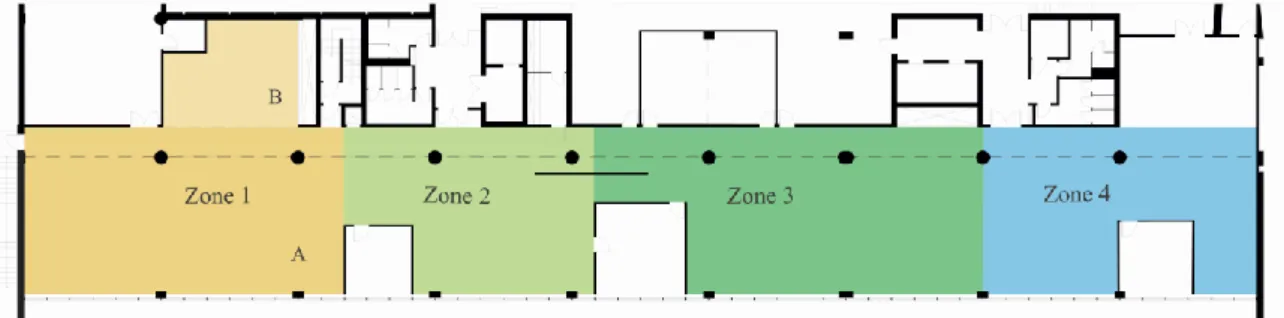
Figure 18 – Architectural plan of the north-side open space office, within whole building’s ground floor ... 54
Figure 19 – Sketchup model of the Seixal City Hall (north wing) ... 54
Figure 20 – Sketchup model of only the open space office ... 55
Figure 21 – Positioning of every type of measurement across the four zones ... 56
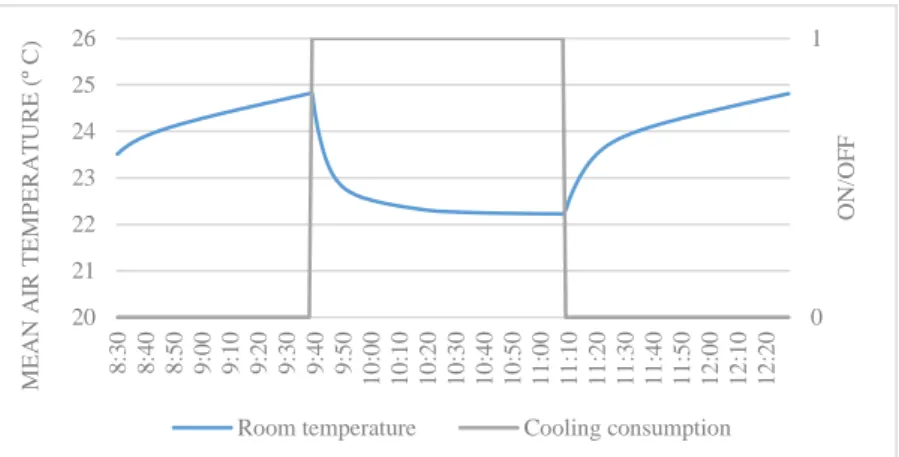
Figure 22 – Mean Air Temperature (ºC) during event for each room ... 60
Figure 23 – Fan coils consumption rate during the demand flexibility event ... 62
Figure 24 – Lighting, OE and ITCs consumption rate during the demand flexibility event with occupancy ... 62
Figure 25 – Lighting, OE and ITCs sensible heat gains density during the demand flexibility event ... 62
Figure 26 – CO2 concentration across the four zones, during the event ... 63
Figure 27 – CO2 concentration stratification at 0.7 m, 1.5 m and 2.2 m. ... 63
Figure 28 – Mean air temperature across the four zones, during the event ... 64
Figure 29 – Mean air temperature stratification at 0.7 m, 1.5 m and 2.2 m ... 64
Figure 30 – Evolution of the relative humidity during the event across the four zones ... 65
Figure 31 – Flexible fan-coils consumption in the demand flexibility event ... 67
Figure 32 – Short version of Figure 31 with DF units ... 68
Figure 33 – Figure 32with room’s average MAT. Assessing the recovery time... 68
Figure 34 – Flexible fan-coils consumption rate during the whole event, with the room’s average MAT. Complete version. ... 69
Figure 35 – Mean radiant temperature across the four zones during the event ... 72
Figure 36 – Operative temperature in each zone during the event ... 72
Figure 37 - Comparison between the consumption rate and the operative temperature during the DF event ... 73
Figure 38 – Sketchup model of only the open space office with the shading groups ... 75
Figure 39 – Mean air temperature comparison: reality vs simulation ... 78
Figure 40 – Operative temperature comparison: reality vs simulation ... 79
List of Tables
Table 1 - Range of contract types ... 26
Table 2 - Floor space and total energy consumption in commercial buildings in the US in 2003 and 2012. Source CBECS ... 27
Table 3 - Energy consumption in offices by end use. Source [56] ... 32
Table 4 – Table A.5 – Example design criteria for spaces in various types of building. Source [78] ... 44
Table 5 – Table A.1 – Categories of thermal environment. Source [78] ... 44
Table 6 – Seven-point thermal sensation scale ... 44
Table 7 – Dimensions of each openable window on each room ... 49
Table 8 – Opening area ratio with the floor area of each room ... 50
Table 9 – Internal gains per lamp in the small room. ... 50
Table 10 - Internal gains per lamp in the big room. ... 50
Table 11 – Types of measurements, measuring tools, measured variable and timestep ... 56
Table 12 – Surface temperatures recorded at three different times in 18 different areas ... 66
Table 13 – Demand Flexibility characteristic units ... 68
Table 14 - Demand Flexibility extrapolated characteristic units ... 70
Table 15 – Surface names, materials in the constructions, for the Small Room (SR) ... 89
Table 16 – Surface names, materials in the constructions, for the Small Room (BR) ... 89
Table 17 – Comparison of opposite surfaces’ U-values ... 90
Table 18 – Surface names and materials in the construction of the open space... 90
Table 19 – State-of-the-art regarding demand flexibility events... 91
List of Acronyms
IEA – International Energy Agency; RES – Renewable energy sources; S&D – Supply and demand; DSM – Demand side management; DR – Demand response;
DF – Demand flexibility; EE – Energy efficiency;
BPIE – Building Performance Institute Europe; EC – Energy conservation;
TOU tariff – Time-of-use tariff; SG – Smart grid;
HVAC – Heating, ventilation and air-conditioning; T&D lines– Transmission and distribution lines;
OECD – Organization for Economic Co-operation and Development; US or USA – United States of America;
AHU – Air handling unit;
MELs – Miscellaneous electric loads; OE - office equipment;
ME - miscellaneous equipment; BMS – Building management system;
BEMS – Building energy management system;
EIA – Energy Information Association of the United States of America; CBECS – Commercial Buildings Energy Consumption Survey;
DSF – Demand-side flexibility; CHP - Combined heat and power; COP – Coefficient of Performance; JRC – Joint Research Center;
ASHRAE – American Society of Heating, Refrigerating and Air-conditioning Engineers; BR - Big room;
SR - Small Room; NV - Natural ventilation
List of other symbols
ρ – Ramp-rate (W/min)π – Total power capacity (W) δ – Ramp duration (min) σ – Recovery time (min)
𝜋𝑚𝑎𝑥+ - Maximum (max) available power (corresponding to the 𝑃𝑚𝑎𝑥) that can be increased (+); 𝜋𝑚𝑎𝑥− - Maximum (max) available power (corresponding to the 𝑃𝑚𝑖𝑛) that can be reduced (-); 𝜌𝑚𝑎𝑥+ - Maximum (max) ramp-rate which can be increased (+);
𝜌𝑚𝑎𝑥− - Maximum (max) ramp-rate which can be decreased (-); 𝜋𝑟𝑒𝑎𝑙+ - Actual (real) available power that can be increased (+); 𝜋𝑟𝑒𝑎𝑙− - Actual (real) available power that can be decreased (-); 𝜌𝑟𝑒𝑎𝑙+ - Actual (real) ramp rate which can be increased (+); 𝜌𝑟𝑒𝑎𝑙− - Actual (real) ramp rate which can be decreased (-); 𝐺𝐼 – Internal gains (W);
𝐺𝑆 – Solar gains (W);
𝐺𝑉 – Gains due to ventilation (W); 𝐺𝐶 – Climatization gains (W); 𝑇𝑖 – Indoor air temperature ( ºC); 𝑇𝑠 – Surface temperature ( ºC);
𝑇𝑖𝑛𝑠 – Insufflated air temperature ( ºC); 𝑇𝑜𝑢𝑡 – Outdoor air temperature ( ºC); k – Thermal Conductivity (W/m.K);
𝑈𝑛 – U-value – Thermal transmittance (W/m2.K); 𝑉𝑠 – Room Volume (m3);
𝑉̇ – Air flow (m3/s);
Ach – Air changes per hour (m3/s);
MAT or 𝑇𝑎- Mean air temperature ( ºC); MRT or 𝑇𝑟- Mean radiant temperature ( ºC); Top - Operative temperature ( ºC);
RH - Relative humidity (%); PMV - Predictive mean vote;
Index
Agradecimentos ... v Abstract ... vii Resumo ... viii List of figures ... 10 List of Tables ... 11 List of Acronyms ... 12List of other symbols ... 13
1. First Chapter – Introduction ... 16
1.1. Introduction ... 16
1.2. Research objectives and scope of the research ... 19
1.3. Research Questions ... 19
1.4. Thesis outline ... 19
2. Second Chapter – Theoretical Background ... 21
2.1. The electric power system ... 21
2.2. Understanding buildings ... 23
2.2.1. Commercial buildings ... 27
2.3. Demand Flexibility ... 29
2.3.1. Loads inside offices and educational buildings ... 32
2.3.2. The thermal behavior of a building ... 37
2.3.3. Thermal comfort ... 42
2.4. Dynamic simulation- EnergyPlus ... 45
3. Third Chapter – Case studies of demand flexibility events ... 47
3.1. C1 Laboratory rooms ... 48
3.1.1. Building description ... 48
3.1.2. Measurement setup ... 49
3.2. Seixal’s City Hall – open space ... 53
3.2.1. Building description ... 53
3.2.2. Measurement setup ... 55
4. Forth Chapter – Practical Results ... 59
4.1. C1 Laboratory rooms ... 59
4.2. Seixal City Hall – open space ... 61
4.2.1. Electric power grid side ... 61
4.2.2. Thermal comfort side ... 63
5. Fifth Chapter – Analysis ... 67
5.1. Demand Flexibility units ... 67
5.2. Comfort analysis: ... 71
5.2.2. Operative temperature: ... 71
6. Sixth Chapter – Comparing EnergyPlus Models with reality ... 75
6.1. Model design in Sketchup’s Legacy open studio plugin ... 75
6.2. Simulation setup ... 76
7. Seventh Chapter – Conclusion ... 81
Bibliography ... 83 Annex 89
1. First Chapter – Introduction
1.1. Introduction
Fossil fuels account for more than 80% of the world primary energy consumption and their combustion leads to the emission of different gases to the atmosphere [1]. The Greenhouse Gases (GHG) are these emitted gases that by getting retained in the atmosphere, cause the greenhouse effect, and contribute to the global warming [2]. The anthropogenic increase of these GHG concentrations in the atmosphere are the cause (with 95%-100% certainty) of innumerous climate changes all around the globe (including the one stated before) [3]. For the past few years it is noticeable that all continents are facing diverse climate changes [3], and 2016 was an example of that, as it was the hottest year ever recorded. Throughout the past decades the world has agreed to fight against these problems, exceling some important steps towards the future: The Kyoto Protocol in 1991; the 2020 goals agreed on 2009 by the European Union (EU); among others. The later development in the world’s joint action against climate change was COP21 Paris 2015. All 195 nations attending agreed to reduce GHG emissions in order to prevent a global warming above 2ºC [4]. Even though, there’s a claim that this agreement was just based on promises and aims, and not on specific policies, it was a proof that the world acknowledges that this threat is real and global. By now, two thirds of global GHG emissions and more than 80% of total emitted CO2 result from the
energy sector [1]. Considering the natural growth on global energy demand, if no opposition is offered, the increase of fossil fuels consumption and their following emissions will be a reality. To secure a more sustainable and non-fossil fuel dependent future, new alternatives to the current energy sector must be stablished, and these alternatives must cover all areas: waste recycling, energy production from renewable and cleaner energy sources, demand-side management, energy efficiency, smart buildings and grid, etc.
Mostly after 2009, many countries have created and implemented laws and policies, which year by year increase the investments made in these areas. For example, the IEA World Energy Outlook 2014 reported that, in 2013, the European Union was responsible for 57% of the world’s subsidies to renewable energy, with a total value of EUR 52 billion. These national support policies and subsidies towards energy efficiency and renewable energies relegated the conventional power plants, as their operational hours decreased and their share on the electricity mix was reduced. These developments caused a price reduction on the whole renewable energies’ sector, resulting on the change of the wholesale electricity market. In 2013, from the total of EUR 52 billion, solar photovoltaic was responsible for over EUR 22 billion and wind power for half of it [5]. All these investments were key to make important advancements in some of the proposed goals in these protocols. An example of that is the increasing renewable energies contribution on the total gross energy generation that, until 2013, rose up to 26% on the EU-28 [6], and the renewable energies share in the global electricity supply was an estimate of 22.1% [7].
Despite the benefits associated with renewable energy sources (RES), uncertainty of supply due to the variable, hardly unpredictable, and so, uncontrollable nature of some of these resources (e.g. sun or wind), is recognized as one of the main issues of these technologies [8]. Because of their uncontrollability, their investment and integration must be fully evaluated and understood, otherwise, high shares of uncontrollable power feed-in will result in problems for the operation of the power system. In addition, there are other problems that can arise and cause a supply and demand (S&D) imbalance, such as, unpredictable variations of demand and uncontrolled supply unit failures. Therefore, the power system must increase its own operational flexibility to overcome any problem and reduce the risk of an abrupt power system collapse [8, 9].
In [10], a definition to operational flexibility of a power system is given, and stands for the technical ability of a power system unit to modulate electrical power feed-in i.e. variations on the energy supply side; and/or power out- feed i.e. variations on the energy demand side; to ensure, over time, the S&D
balance. This operational flexibility can be assured by different mechanisms in two major sides: the generation side and the demand side. On the generation side, there are two mechanisms that are currently being used to increase the supply flexibility: economic load dispatch, or RES power feed-in curtailment [8, 11]. Addfeed-ing to these two, the Energy market and battery systems also appear as solutions. Before the integration of large shares of renewable energies and their consequent hard predictability problems, the supply side would always follow the demand. Changes in the load would have to be satisfied by flexible generation. With the increase of renewable but variable generation, as the supply became less flexible, the demand sought to become more flexible. For many years, on the demand side, demand-side management (DSM) has been one of the main focus of studies in the area, because of its huge potential in helping control the S&D balance [12]. This help is based in three different tools: demand response (DR), demand flexibility (DF) (the core of this thesis) and energy efficiency (EE). The first two, in different ways, are meant to reshape the load diagram towards the grid instant requirements and the third is to reduce the magnitude of the load diagram [13].
Considering first the generation side, and before explaining the economic load dispatch, there is a characteristic that needs to be introduced. This characteristic is inherent to all energy sources, and it’s called dispatch time. This characteristic defines a source on their response time to generation calls, and it groups sources between the ones that can be consumed when it’s needed, and the ones that can only be produced (and so consumed if there are no storage solutions associated) on uncontrolled periods of the day and night. The sun, as it is only available during the day is, sometimes, “covered” by the clouds [8]. This interrupts its energy production on uncontrolled, and sometimes, hardly predictable big periods. Because of this, it is classified as non-dispatchable. On the contrary, dispatchable sources help increase the operational flexibility. The units that use these sources, can increase or decrease their power output, responding to the RES variable generation or towards demand fluctuations. The ramping up or down by these flexible generating units, e.g. conventional power plants, depends on many characteristics. These characteristics are their generating capacity, operating conditions (whether unit is just starting up or operating at a minimum load hold point) and optional technologies for reducing startup time and increasing ramp rate (usually expressed in MW/min), as mentioned in [14]. They will help the grid organize the best instant solution for a backup power reserve, avoiding excessive fatigue in the plant structure [15]. The overuse of these fast responding mechanisms on conventional power stations could result in a reduction of the expected life of such components, which were mainly designed for base load [16]. Another form of dynamic fast responding are all kinds of stationary capacities: batteries, hydro storage and pumped hydro storage, etc. For instance, in a full battery the electricity is instantaneously available. Another example is a hydro power station, in the case of the water volume being between regulated levels, its production into electricity is also seconds away from the grid generation call [17] [10]. All these examples are viable options (in different scales) for increasing the operational flexibility of the grid. Thus, the objective behind Economic load dispatch is to schedule the output power of committed generating units, in order to meet the required load demand at an optimal operating cost, while satisfying all units and system constraints, and variable characteristics. Doing so, the power system is not only reducing operating costs, but also saving energy and reducing emissions [18, 19]. As said before, this is not an innovative mechanism, as it is a traditional tool in the operation of power systems.
On another side, the RES power feed-in curtailment comes as a solution for the integration of large shares of non-dispatchable and uncontrolled power feed-in RES. This solution is to safely maximize the operational flexibility through their curtailment [17]. Meaning that by setting the power output of a, e.g. wind turbine, to a lower level, the unpredictability that is characteristic to this resource can be prevented from affecting the generation. The difference between the real power output (without curtailment) and the curtailed power output, at a specific instant, will define its provided operational flexibility. In conclusion, through a dynamic but simple, and at a really low cost process, the real-time operation of these resources will turn them more controllable and thus dispatchable [20]. However, this difference will be a power loss for the power system, reducing the generation efficiency of this source. Another, and an easy way to manage the operational flexibility for a power
grid is to have other power grids zones interconnected, and use these connections to import or export power capacity [10].
To have complete control over the power system, both sides must always be in near balance, but most importantly, the grid must always seek to increase its own operational flexibility. According to the Buildings Performance Institute Europe (BPIE) [21], “buildings currently (2009) represent almost 40% of total final energy consumption”. If a turnabout is required to ensure the safety and smart control of the grid, the focus must be in understanding how can the demand side be fully tapped. Because of this, buildings appear as a huge solution for the grid to recover the control over the power system. As mentioned before, managing the demand side is the solution to overcome the current grid’s S&D imbalances, but despite existing three tools (DR, DF and EE), the first two are the only ones that are effective. The other tool (EE) only aims to reduce consumption in total, therefore shortening the possibilities for exploring the system’s power flexibility. Nonetheless, energy efficiency measures, as renovating the electrical loads to more efficient ones (short-term action) or changing consumer behavior for a more efficient one (long-term action, energy conservation (EC)), must always be taken first into consideration in any case, in order to eradicate any energy consumption excess [22]. As a result, demand response and demand flexibility emerge, ultimately, as the main solutions to increase operational flexibility on the demand side. On the one hand, the demand response is defined as a way to reshape the load pattern, by adjusting the consumer-end use of electricity, in order to reduce the gap to the generation profiles of the power system [13]. Consumers are encouraged to change their consumption patterns by dynamic pricing (real-time changes in prices based on the current generation) or by an incentive-based program [20, 19]. In such manner, this concept is based on different approaches. In order to shift the main loads, from on-peak to off-peak periods, one approach is to set time of use (TOU) tariffs. Another way is to use smart meters, for consumers to monitor their consumption, not only to reduce their overall values overtime (strategic conservation), but also to adjust their behavior towards the grid current needs, reducing peak loads (peak shaving). On the other hand, demand flexibility is the ability of a building to react (by increasing or decreasing its energy consumption) upon instant signaled requests (surplus or shortage power) from the Smart Grid (SG), without compromising its comfort. This subject has, recently, dedicated many studies, as [21, 25, 26, 27, 28] show. In all these studies, this ability has been described as an ancillary service, but despite some studies may have simulated these events, there is still a lack of real case studies [26, 27].
Although both have the same goal - increase the operational flexibility of the power system - and may look alike, they have different premises, and so, different targets. In the case of demand response the goal is to allocate (by those programs mentioned before) any flexible load that usually is used on peak hours, for the best optimal time period (off peak hours) of the whole day ), depending on the interest of the power system [31]. Because of this, the best buildings are the residential ones, as some of their main loads are characterized as so. As the idea for demand flexibility is to be able to change consumption, at any time, either by increasing or decreasing energy, the premise is no longer to allocate loads for different periods of the day but to create a fluid and dynamic consumption. Its target is no longer residential buildings, but commercial, offices and educational buildings, as the HVAC system comes as a substantial flexible load [32]. However, its management can’t affect the comfort of its occupants or their activities in the building, protecting always both, the grid and the building’s interests. Considering the size of these buildings and that they represent a 40% share of all non-residential buildings [21], the potential agglomerated flexible consumption projects a huge help for the grid. The next chapter will explain and detail these and other characteristics that make these buildings’ flexibility an enormous help for the grid. The goal of this thesis is to test this type of event and understand its core characteristics and potentialities.
1.2. Research objectives and scope of the research
This work focuses on the understanding of how the building’s energy systems can interact and behave when the goal is the optimization of the building’s operation, while offering support to the grid. In order to optimize this interaction, there is a need to turn buildings, grids and their communications smarter. To achieve this, the BEMS must be synchronized with all the control systems: the HVAC system; the self-produced energy control system; and all the loads. The flexibility of each building to react to signals sent from the grid, by increasing or reducing their consumption, would have a huge effect when considered the share of energy consumption that the built environment is responsible for. This responsibility shift by the buildings, from passive into active consumers, will be rewarded on how flexible and supportive of the grid the buildings are. With the increase of variable and uncontrollable renewable energy sources penetration, the demand flexibility appears as one of many solutions to undertake this problem. Although this topic is starting to attract greater and greater researching interest, most of these studies only present simulations to demand flexibility events. This thesis tries to go a step further by testing an event on a real office building in real office working hours, without compromising the thermal comfort of its users.
1.3. Research Questions
The aforementioned raises the following question, which is center to this research work.
How can buildings offer demand flexibility to the electric power grid without compromising the comfort and activities of their users?
Furthermore, the following sub questions can be formulated as well: 1. Which types of buildings offer the most flexibility potential?
2. How can these buildings turn from passive consumers into active consumers? 3. What is the effect of the building’s construction on its flexibility potential? 4. How can these events be tested in a real-time case study?
5. How can comfort be assured while on a demand flexibility event?
1.4. Thesis outline
In the second chapter, the problem is exposed and the different ways to solve it are presented throughout the course of the first subtopic. On the second topic, the proposed solution is presented in all its components. Additionally, the simulation software, EnergyPlus is briefly introduced. In the third chapter, it’s time to understand its potential in a real-time office environment. First, a case study on two rooms with different insulation characteristics (a poorly insulated room and a highly insulated one), will test how air temperature changes during a very rudimental demand flexibility event. This will serve as an introductory example to the real case study done in the Seixal’s city hall. In the fourth chapter, the practical results of both experiments will be presented with a brief explanation of the main components in study in the events.
In the fifth chapter, a deeper look will be given regarding the second experiment, where the two sides of a DF event: the users’ comfort side and the electric power grid side; will be analyzed. The event itself will be studied in the proposed nomenclature and concept explained in the second chapter. On the sixth chapter, the results of the second case study will be compared to a simulation made in EnergyPlus. It will be studied its simulation ability in this kind of events and which types of inputs are required for the simulations. On the last chapter, the conclusions assessed in the whole thesis and proved in the case study will be presented, as well as possible future research work.
2. Second Chapter – Theoretical Background
2.1. The electric power system
The electric power system connects the sources of electricity to the consumers and operates in a constant readjustment, always seeking for the supply and demand balance. There are three main parts that constitute it: the power generation, transmission and distribution lines. The power generation is responsible for producing electricity from different sources (coal, gas, sun, wind, water, etc.) based on different processes (pressure, heat, light, mechanic, etc.). The transmission lines transport bulk quantities of power from the generation, at very high voltages, through very large distances to electric substations. These substations are usually located near big demand centers and are responsible for bridging the transmission lines to the distribution lines. The electricity passes through transformers, stepping down its voltage and is then distributed to every group of consumers at their required voltage. Local low voltage power stations are therefore connected to the distribution lines [33]. The transmission and distribution lines system are commonly defined as the electric power grid, as all the lines form an electrical web. Even though the last two parts are structural in the management of the power system, they have lower importance in this work. A much relevant infrastructure is the control center and it is a fundamental piece of the grid, as it’s responsible for everything that happens in it. This part has many functions: control both the supply and the demand, and prevent any imbalances; optimize energy production costs and reduce environmental consequences; ensure energy supply whenever is requested; and assure electrical quality standards (like constant frequency, voltage between demanded limits, high reliability) [33]. In the 1970s, the term system security appeared as being the ability of these control centers to endure any instantaneous anomaly in the system (disturbances and/or contingencies). This search for a more reliable control system changed them to become more decentralized and flexible. Undoubtedly, any component can fail, and just because of this, the grid must always be able to overcome these situations [11]. Besides component’s unpredictable issues, the demand also changes over the course of the day, month and year. Even though the load diagram can have a predictable shape, it is never possible to predict the exact demand or even that its shape will be the same every day. As detailed before, there are different options for increasing the operational flexibility. The management of all these solutions in respect of their cost and benefits in order to face any problem will reflect the quality of the system and its reliability. As the world seeks for renewable ways to produce energy that won’t release GHG, the shares of renewable sources increase. Globally, in 2014, wind and solar broke, individually, their annual capacity installation records. Hydropower total new capacity was even topped, in 2014, by both of these sources [7].Both represented 90% of 2014 total non-hydropower renewable additions prefacing now 83% of global renewable (non-hydropower) installed capacity [7]. Globally, in the European Union or even in the BRICS (Brazil, Russia, India, China and South Africa), the two biggest hydropower renewable sources are, so, wind power and solar power [7]. This increase of non-dispatchable power market share will demand a higher operational flexibility from the grid, and this means a huge renovation in the way how power systems operate.
The traditional way of operating has been to always follow the demand. This is accomplished by understanding and controlling the supply. Now, with more and more variable and hardly predictable generation, the goal has changed. Now the grid must understand better the demand, to be able to control it. This is accomplished by first developing a smarter power system and using it as a platform to apply DSM mechanisms [1]. This smart power system is what it’s called a smart grid. A smart grid is a modern power system with communication and automation skills. The power and information bi-directional system will connect, monitor and help control every component, from power sources to singular electric appliances. By doing so, the SG will be able to: understand better consumer behaviors; reduce generation costs; accommodate higher (variable) renewable shares; enhance energy markets; and increase the overall system’s efficiency and reliability [31, 32]. In order to implement a SG, two aspects must be developed: smart infrastructures and smart technologies.
Current electric transmission and distribution lines (T&D lines) are aging all over OECD Europe and OECD North America [36]. As these lines need to be always updated, replacing them without any SG-based-philosophy update (despite their higher initial cost) would be a non-smart move by these governments, as higher future savings are foreseen [31, 33, 34]. Until now, the only sensing and control made on the power grid was on substations and control centers. These infrastructural updates would turn T&D lines automated, and so, able to read and control themselves at any point. These changes include: automated fault location and restoration (for an automated reaction to instant circuit failures e.g. blackout); dynamically adjusting distribution controls to accommodate variability, power ramping and bidirectional power flow (enabling more renewable energies integration); sensing and optimizing the need for Volt-Ampere Reactive power, frequency control, etc. [35].
More than just revolutionizing the grid infrastructures, new and smarter technologies must be created and implemented in every other component of the power system. As a result, the importance of demand-side management strategies grows, projecting huge changes in every part of the demand. In the US, in 2010, buildings represented 41% of total primary energy consumption, and 7% of the world primary energy consumption. From those 41%, 54% was consumed by residential buildings and 46% by non-residential (or commercial) buildings [38]. Though, considering primary energy consumption shares alone is not conclusive enough. Electricity consumption is the one that must be considered because it’s the source the power system is meant to transport. Thus, in the US, in 2010, buildings were responsible for consuming 74% of total electricity consumption (39% due to residential buildings and 35% due to non-residential buildings) [38]. Because of these shares, buildings in the US represent a huge potential help for the grid, as any change in them can result in huge changes in the overall consumption values, and so in the S&D balance. In 2012, in the EU-28, the buildings energy consumption was about 40%, and their electricity consumption accounted for 55% [39]. From the built floor space, in 2012, 76% were residential buildings and 24% were non-residential. Even though residential buildings floor space was higher, 66% of that was of single family houses, and more area doesn’t mean more energy consumption [39]. To completely understand the full potential of both groups of buildings, the energy consumption must be calculated per square meter (energy intensity), and in this case, non-residential buildings consumed 40% more energy (for all end-uses) than residential buildings in 2009 [21] and 54% more in 2012 [39]. Regarding only the electricity consumption in 2010, residential buildings consumed 29.71% and non-residential buildings consumed 29.41% [40]. This is another proof buildings can have a huge impact in the S&D balance, if they follow the revolution that is going to occur in the power system.
Therefore, when tackling either one of these kinds of buildings, the same two questions must be asked: how can the smart grid take advantage of these types of buildings? And what has to change in them, for them to harness their full potential? First these buildings must be studied and understood, and only then the first question can be answered. The second question will be answered along with the first one, suggesting technologies that must be developed. In the end, one of the main questions of this thesis “how to turn buildings from passive consumers into active consumers?” will also be answered. After this full analysis, the target buildings of this thesis will be exposed, as well as the proposed mechanism to ensure their help to the smart grid.
2.2. Understanding buildings
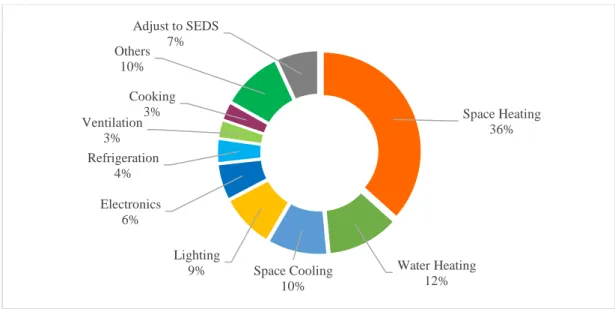
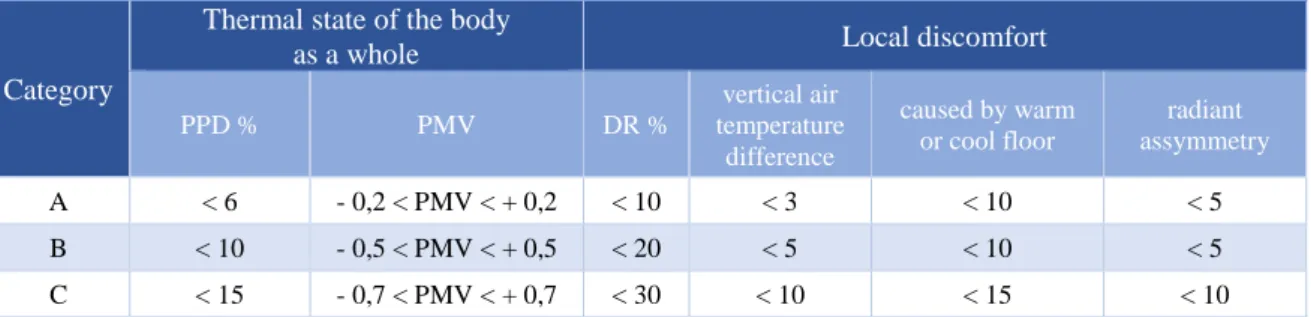
Buildings differ from each other on the specific construction characteristics, if it’s residential or commercial, the purpose/type of that building (household, office, shop, hospital, etc.), the primary and final energy sources, the types of loads inside that building and the users that live and/or work in it. However, to understand their potential to help the grid, some characteristics are more relevant than others. Loads are certainly a very important part of a building with its consumption being the target for any possible help to the grid. Briefly, their description will start with the HVAC systems. These systems cover all combinations of three different subsystems: heating (H), ventilation (V) and cooling (AC). They can be as simple as an oil heater in a residential home, to be as complex as the air conditioning systems found in a space shuttle. Another example is an air handling unit (AHU) found in airports, or in industrial or commercial buildings. The size and features of these systems are, consequently, based on the specific requirements of the building [41]. The water heating systems can be either integrated in a HVAC system, taking advantage of the heat losses of this system to heat the water, or even use the same energy sources as the HVAC system to heat it. A boiler that uses e.g. natural gas; or a solar panel that uses the sun’s energy, are both examples of simpler water heating systems. Following, appliances are all devices that need electricity to function [42]. Examples are: electronic devices e.g. information technology and communication devices (ITCs); refrigerators; washing machines; alarm clocks; ATMS; medical equipment; etc. These devices can also be referred, in other literatures, and later on in this thesis, as miscellaneous electric loads (or MELs) [40, 41]. Figure 1 shows the different end-uses in buildings in the US and their respective share, in 2010. As the figure shows, HVAC, water heating made up more than 60% of building’s site energy consumption, with lighting representing only 9% [38].
Figure 1 - Buildings site energy consumption by end-use
Space Heating 36% Water Heating 12% Space Cooling 10% Lighting 9% Electronics 6% Refrigeration 4% Ventilation 3% Cooking 3% Others 10% Adjust to SEDS 7%
Figure 2 - World building final energy consumption per end-use in 2010. Source IEA (2013)
In the same year, on a report made by IPCC [45] (Figure 2), space and water heating were responsible for huge impacts in the world’s final energy consumption. It is reasonable to assume that, because countries that are in the temperate-snow zone of the globe are more developed [46] they can afford higher comfort expenses. The second largest end-use in residential and commercial buildings were, as it is expected, cooking and other (ITCs equipment, etc.), respectively. Finally, and since residential buildings are in a large part used for sleeping or are empty during the day, the lighting does not represent a huge share of the total energy consumption. On the contrary, commercial buildings have a respective lighting share much higher.
To search for a solution for the electric system, only end-uses that require electricity to function are part of that solution. Even though not every end-use is sourced by electricity, they can be, and so the range of loads is wide. Consequently, each one of these loads will be characterized in terms of flexibility of use. What this means is that every load has specific characteristics, in terms of period of usage, availability, if they can be shutdown/turned on instantly, etc. This characterization will group loads into different categories. Consumers will have different combinations of loads, creating different consumer load mixes. The predominant type of load will then define the consumer load mix type. As consumers change habbits, activities or appliances, their load mix will also vary, and the predominant type may also change. According to the report [47], there are 5 types of loads:
1. Storable load; 2. Shiftable load; 3. Curtailable load; 4. Base load; 5. Self-generation.
Firstly, the load must be classified either as storable or non-storable. In this case, if the load can either charge e.g. a room, by thermal inertia (e.g. using heating system to heat a room), or a thermochemical battery (e.g. an electric car can be charged by itself), and only release its energy when it’s needed, then the load is classified as storable. If not, then the load must be classified in her ability to be shiftable or not. In other words, if the consumer is able to change the period of the day when is using this load, without being affected by this change (e.g. shifting the time of the day when the washing machine is working), then that load is shiftable. If not, then the next step is to evaluate if the load is curtailable or not. Even though, as mentioned before, the curtailment of RES power feed-in is to reduce the power output of a, e.g. wind turbine, here, a curtailable load is the one that can be turned off completely and instantaneously. Examples of this are in some cases, a television, some lights, or a printer in an office. In the case of not being a curtailable load, it is defined as a base load. In this case, the load cannot be storable, shiftable nor curtailable because it is a core load, as e.g. burglary alarm, some light, any automatic load, temperature sensors or even an automatic door or light, an
Appliances 9% Cooking 29% Space Heating 32% Water Heating 24% Space Cooling 2% Lighting 4% Residential 24.3 PWh Commercial 8.42 PWh
escalator or an elevator. Finally, a device is a self-generator if it can produce energy as a supplier and use it as a backup power (if it’s dispatchable). The figure below (Figure 3) resumes all these types of loads. After assessing every load for their type, a consumer load mix can be identified. Later on, when analyzing residential and commercial buildings seperately, examples will be made to fully understand this concept and their load environment [47].
Figure 3 - Consumer load mix. Source [47]
While the supply becomes more uncontrollable and inflexible, the solution has been to invest in expensive backup generating capacity with expensive generating fees [8]. Learning and understanding the demand, buildings specially, will help the power system protect itself from future imbalances. After understanding buildings in general, and before studying how commercial buildings can help, it is crucial to completely grasp how residential buildings are also expected to help and the reasons they are not enough for this concept change. As they are not the point of this thesis their study will be brief. Nevertheless, their complexity, in terms of consumer load mix, demand response programs and consumers themselves will be addressed, as well as problems and barriers to their success, as active consumers.
Demand-side Management is defined as a way to reshape the load diagram, by adjusting the consumer-end use of electricity, in order to reduce the gap to the generation profiles of the power system [12]. This concept is based on different approaches, with the main one being demand response. The idea behind demand response is to promote changes (through incentive based programs/contracts) in the electric consumption of end-use customers, towards fixing S&D imbalances [48]. To capitalize the residential building stock, a set of contracts must exist to satisfy every kind of costumer. Here, in Table 1, five types will be presented. Some of those contracts will be price based (use a tariff for electricity to trigger the consumption on different periods), volume based (constrain the load through a consumption cap/floor) or control based (where the grid has total/partial control over consumption) [47]. In the future, in a smart grid, all consumers will be notified on building energy management system (BEMS) devices, through internet signals or even through the T&D lines. Those signals will be able send coded information to the device and, depending on the contract, can even activate or deactivate different loads. Additionally, the signal volatility can be low (static) or high (dynamic). This characteristic of the signal defines the frequency of the signal (not to be confused with utility frequency). In the case of a static contract, the signals are more spaced from each other and can be notified with longer notice. In a dynamic contract, the signal demands quick changes and through small periods, reflecting the changes on the electricity trading market. There are other characteristics that are shown below (Table 1) that will define the financial compensation. These characteristics translate the type of risk (price risk or volume risk), the complexity for costumers and their autonomy and privacy. The complexity level is determined by the difficulties of learning and understanding the concepts of signal volatility, each appliance’s consumption impact, their best management, etc.; The autonomy loss extends for the fact that with, for instance, a direct load control contract, some loads may be controlled by the grid, affecting a lot the lives of the consumers. The privacy loss means that the clients may be forced to record their
consumption and release, freely, any detail about their habits and their consumer load mix [47]. Table 1 below shows five contracts and their features:
Table 1 - Range of contract types
Even though, on a direct load control contract, the consumer doesn’t need to know about signal volatility (and so the complexity appears as none), the contract will be much more legally complex because of the privacy and autonomy issues that come with, both consumer and service provider rights [47].
All these problematic features cause high resistance and discomfort to non-educated consumers (in the energy sector), but are the only way for the service provider to ensure the desired demand response. Depending on the current system conditions and the best solution for the grid, that regarding contract will potentiate higher financial compensations. Although costumers would of course select the best contract for themselves, many times this compensation system may not even be that attractive for the common consumer. This can be from being merely unknown or confusing, to being too risky, intrusive and/or complex. Apart from these problems, there are others that also have to be made clear: contracts that preview a loss of privacy (even limited) require metering devices with data recording abilities, increasing the costs for the costumers [47]; these energy related matters are not common knowledge, and so there is an absolute need for consumer education; the little help that households singularly represent (in terms of total power); and a possible difficult growth to all households or to a considerable percentage of them. Concluding, even though there is a huge potential regarding demand response programs in residential buildings, there is still a long way for them to reach a slightly reasonable use.
Signal form Signal volatility Price risk Volume risk Complexity Autonomy/ Privacy loss Financial compensation Time of use pricing Price
based Static Low None Low None Limited
Dynamic pricing
Price
based Dynamic High None High None High potential
Fixed load capping
Volume
based Static None Low High Limited Limited
Dynamic load capping
Volume
based Dynamic None High High Limited High potential
Direct load control
Control
based Predefined None None None High
Limited/ High potential
2.2.1. Commercial buildings
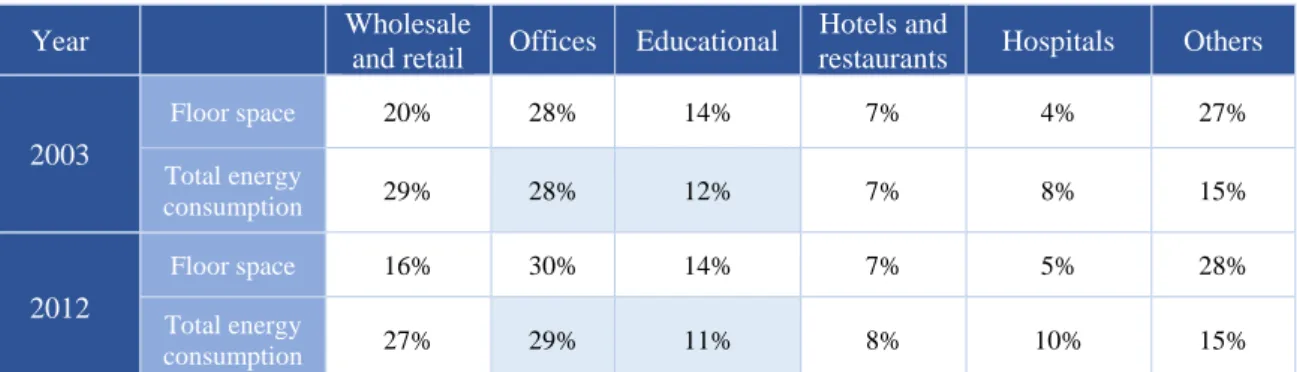
Inside the non-residential sector, variety is huge, as they represent all other categories of buildings from hospitals, schools, shops, offices, government buildings, service buildings, malls, sport centers, hotels, restaurants, etc. All these types form a heterogeneous mix, but for an easier characterization, instead of doing it individually, they can be grouped together. Even though this separation can be done in many different ways, this work will follow the one presented in the Buildings Performance Institute Europe (BPIE) survey [21]. While the separation in groups is based in the BPIE survey, both the floor space and its correspondent energy consumption percentages are extracted from both (2003 and 2012) Commercial Buildings Energy Consumption Survey (CBECS) from the US Energy Information Administration (EIA) [35, 48]. This data is all resumed in the next table (Table 2). The first group is constituted with all kinds of retail and wholesale shops (e.g. food and non-food shops, gas stations, malls, hair dressers, congress buildings, laundries, mechanics, etc.) and is defined by a complete mix of characteristics such as size, construction type, purpose, activities, and energy consumption. Because of these imparities, it is hard to find a common way to manage their demand. In 2003, they represented 20% of the whole non-residential floor space and 20% of the total energy consumption of non-residential buildings. Their total energy consumption decreased to 27% in 2012 as their floor space also decreased to 16%. In the second largest group, all office buildings, call centers, administrative and municipal buildings are included and they represented 28% of total area of non-residential buildings (29% in 2012). On the contrary to the first group: the type of loads; their weight in the building’s energy consumption mix; and the building’s load diagram are very alike between office buildings. Another aspect of these buildings is that their heating and cooling demands are similar to residential buildings (except offices usually have less hours of consumption comparably). When in 2003 they represented 28% of total energy consumption (in non-residential buildings), in 2012 their consumption rose to 29%. Another group of buildings is the one that aggregates all educational buildings, from libraries to research labs, universities and schools (all kinds). These buildings have similar load patterns to office buildings, as they are most active during the same time periods. On that same survey, they accounted for 14% of all floor space of non-residential buildings and toped 11% of total consumed energy in 2012, less 1% than in 2003 (12%). Moreover, restaurants, cafés, pubs, discos, and hotels represented, in 2003, 7% of total floor area of commercial buildings (the same in 2012) and make another category. In 2003, in the US, these buildings in consumed around 7% of total non-residential buildings energy consumption. In 2012 it was 8%. With 4% of total floor space, in 2003, there are all medical buildings: with continuous usage patterns, such as, public and private hospitals; and 24h care centers, etc. In 2003 in the US these buildings consumed 8% of total and 10% in 2012. These buildings are characterized by their very low priority to reduce or smart manage their consumption, as their priority is to focus on the patients. The last category represents all other buildings, from warehouses, garage buildings, garden and agricultural buildings, empty lots, etc. Even though the last category is the second biggest (27% in 2003 and 28% in 2012), it groups completely different buildings with unique characteristics (unique loads and specific working hours) and little influence separately, making them hard to manage. As it shows below in Table 3, they represented the same energy consumption in 2003 and 2012 of 15%.
Year Wholesale
and retail Offices Educational
Hotels and
restaurants Hospitals Others
2003 Floor space 20% 28% 14% 7% 4% 27% Total energy consumption 29% 28% 12% 7% 8% 15% 2012 Floor space 16% 30% 14% 7% 5% 28% Total energy consumption 27% 29% 11% 8% 10% 15%
As stated before, the energy density (kWh/m2) in commercial buildings in the EU was, in 2012, 55%
higher than in households (286 kWh/m2 to 185 kWh/m2) [39]. Regarding only the electricity
consumption in 2010, residential buildings consumed 29.71% and non-residential buildings consumed 29.41% (39% and 35% respectively in the US in the same year) [37, 35]. Despite existing demand response programs for residential buildings, there are some arguments that prove that a bigger impact can be achieved by creating programs targeting commercial buildings [50]. For starters, these buildings are usually used by Small and Medium Enterprises (SMEs), large businesses, government entities, or organizations of any kind, etc. and a common ground for these entities is their interest in reducing costs and increasing revenue stream. Another aspect is that, more than 30% of commercial buildings in the US have any kind of BEMS, which can communicate with the grid and be helpful towards it in real time. Even buildings without these systems are usually more familiarized (than the average residential user) with outsourcing/contracting experts or teams of experts for those matters. Specialized contracts/programs that take advantage of their demand and can be financially rewarding to commercial building users, appearing as a win-win situation for both the grid and the building. Residential users, on the other hand, might not understand the value of their help, might not know how to apply, and which benefits there are for both the grid and them. The challenges grow even more as residents may not even understand any of the contracts presented before for simple reasons of lack of information, poor education, lack of skills/knowledge to execute the contracts or even to select the appropriate contract [47]. Demand flexibility appears as an alternative solution to demand response, for its premise of very fast demand response programs, turning commercial buildings from passive into active consumers [50, 23, 7].
2.3. Demand Flexibility
As stated before, demand flexibility is a building’s capability to react (by increasing or decreasing its energy consumption) upon instant signaled requests (surplus or shortage power) from the smart grid, without compromising the comfort or the activity of its users[51, 52, 53]. On different studies a similar definition has been made for a building’s ancillary service, as its ability to react to the smart grid requests to alter the consumption without affecting the comfort of its users [21, 53, 25]. The term flexibility evolves from the real and predictable need from the grid to accommodate different variations in the system [8, 17]. This chapter will capture all the components of this concept for its complete understanding as a whole. There is little literature regarding this topic, as it’s still a very recent one and so, although following it, some of the definitions and the way the DF event is presented graphically are proposed as a new way of approach.
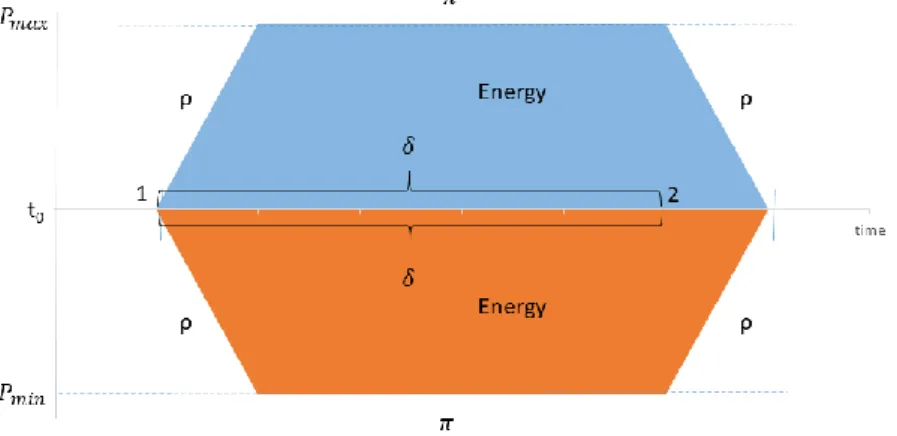
By now, the grid has already flexibility profiles for each supplier, defining their instant state and characteristics towards helping the grid, as it was introduced before as operational flexibility. These profiles have four main characteristics that help the grid decide which supplier offers the best solution for the problem aimed to fix. These characteristics are illustrated in
Figure 4
and are the total power production capacity, the power ramp-rate, the ramp duration and the cost. Considering an initial time t0, the total power production capacity (MW), π, is the maximum power that this supplier can increaseor decrease from the power generation that it was at t0. The power ramp-rate (MW/min), ρ, is the rate
at which this supplier can increase or decrease its power to the required level. The ramp duration (min), δ, is the time during which the supplier can produce energy or reduce its generation at that requested power (between points 2 and 1). The cost (€/MWh) is the price paid by the grid for that amount of energy produced. Although the available energy produced by this dispatchable supplier is the area inside the trapeze [8, 54], after point 2 the supplier is already decreasing its supply to the power at which it started at t0, and so it doesn’t count anymore as help to the grid.
Figure 4 – Theoretical operational flexibility
As it’s shown in Figure 4, each supplier of operational flexibility can be described with only three characteristics (if the price is excluded). Although, depending on the specific situation, they can have different meanings. For the grid to know the nominal operational flexibility (Figure 5), these first six indexes must be created:
𝜋𝑚𝑎𝑥+ - This represents the maximum (max) available power (corresponding to the 𝑃𝑚𝑎𝑥) that can be increased (+) by the supplier;
𝜋𝑚𝑎𝑥− - This represents the maximum (max) available power (corresponding to the 𝑃𝑚𝑖𝑛) that can be reduced (-) by the supplier;
𝜌𝑚𝑎𝑥+ - This represents the maximum (max) ramp-rate in which the supplier can increase (+) from 0 to the 𝜋𝑚𝑎𝑥+ or from the 𝜋𝑚𝑎𝑥− to 0;
𝜌𝑚𝑎𝑥− - This represents the maximum (max) ramp-rate in which the supplier can decrease (-) from the 𝜋𝑚𝑎𝑥+ to 0 or from 0 to the 𝜋𝑚𝑎𝑥− ;
𝛿+ - This represents the ramp duration on the case the supplier increases (+) its power generation; 𝛿− - This represents the ramp duration on the case the supplier decreases (-) its power generation.
Figure 5 – Nominal operational flexibility
Nevertheless, for different reasons, the actual operational flexibility may be lower than the nominal operation point. Figure 6, represents two separate scenarios. A scenario where the supplier decreases its generation (the first yellow region) from the value at t0, bringing it back to the power value at t0 .
And a scenario where the supplier increases its generation (the second yellow region) from point 3 until is requested to reduce its generation and comeback to the initial value at 3. Because of all these situations, a representation (through the next four indexes) must be done (Figure 6) for the grid to know what the actual flexibility is.
𝜋𝑟𝑒𝑎𝑙+ - This represents the actual (real) available power that can be increased (+) at that time; 𝜋𝑟𝑒𝑎𝑙− - This represents the actual (real) available power that can be decreased (-) at that time; 𝜌𝑟𝑒𝑎𝑙+ - This represents the actual (real) ramp rate in which the supplier can increase (+) from 0 to 𝜋𝑟𝑒𝑎𝑙+ or from 𝜋𝑟𝑒𝑎𝑙− to 0;
𝜌𝑟𝑒𝑎𝑙− - This represents the actual (real) ramp rate in which the supplier can decrease (-) from 𝜋𝑟𝑒𝑎𝑙 + to 0 or from 0 to 𝜋𝑟𝑒𝑎𝑙− .
Again, the ramp duration, is only defined as the real time, having just that the same two meanings from before: on a power decrease scenario is 𝛿−;on a power increase scenario is 𝛿+. Its value can be computed, depending on the event, subtracting the time between points 2 and 1, or between points 4 and 3, respectively. The amount of actual/real energy being diverted to the grid is represented by the area in yellow in Figure 6. The white line represents how the supplier would behave, decreasing in the first yellow trapeze, and increasing its power generation, on the second yellow trapeze.

![Figure 9 - EnergyPlus program schematic. Source [87]](https://thumb-eu.123doks.com/thumbv2/123dok_br/15653488.1059257/45.892.194.727.567.807/figure-energyplus-program-schematic-source.webp)