UNIVERSIDADE DE LISBOA
FACULDADE DE CIÊNCIAS
DEPARTAMENTO DE FISICA
NON-DESTRUCTIVE CHARACTERIZATION OF ARTWORKS IN
PAPER SUPPORT USING SPECTROSCOPIC TECHNIQUES
ALDA SOFIA PESSANHA DE SOUSA MORENO
DOUTORAMENTO EM FÍSICA
UNIVERSIDADE DE LISBOA
FACULDADE DE CIÊNCIAS
DEPARTAMENTO DE FISICA
NON-DESTRUCTIVE CHARACTERIZATION OF ARTWORKS IN
PAPER SUPPORT USING SPECTROSCOPIC TECHNIQUES
ALDA SOFIA PESSANHA DE SOUSA MORENO
Tese orientada pela Prof.ª Doutora Maria Luisa de Carvalho Dias de Sousa Leonardo especialmente elaborada para a obtenção do grau de doutor em Física
DOUTORAMENTO EM FÍSICA
Nothing is impossible, the word itself says I’m possible!
i
ACKNOWLEDGMENTS
I offer my deepest appreciation to my supervisor, Professor Maria Luísa Carvalho, for the relentless effort in providing me the best working conditions, learning opportunities and financial support. Moreover, I would like to emphasize her commitment in the establishment of a healthy and caring working environment for me and all co-workers.
I would like to acknowledge the support of the Portuguese Foundation for Science and Technology (FCT) with the PhD grant SFRH/BD/60778/2009.
I would also like to acknowledge several Portuguese institutions for allowing the access to the artworks investigated in the different case studies:
- Museu Nacional de Arte Antiga, namely director Paulo Henriques and Curator Conceição B. De Sousa;
- Museu Nacional Soares dos Reis, namely director Maria João Vasconcelos, curator Paula Carneiro and technical assistant Maria do Carmo Campos;
- Museo Oriente, namely director Manuela Oliveira Martins, curator Joana Fonseca and conservator Fernando Duarte;
- Salvarte atelier, namely Marina Afonso and Rita Horta e Costa, as well the owners of the screens kept at this atelier.
- Banco de Portugal, namely Stella Pereira and Filomena Marçal, who are responsible for the artworks kept at this institution.
Furthermore, I would like to highlight the contribution of all the co-authors of the publications that came as a result of this research project, namely, Marta Manso, Ana Guilherme, Teresa I. Madeira, Agnès le Gac, Mauro Guerra, Jean Luc Bruneel, Stephane Longelin, Adriana Ferreira, Francisca Figueira, Sara Valadas, Marina Afonso, Ana Clara Rocha, Maria José Oliveira, Isabel Ribeiro, Ingelise Nielsen, Milene Gil, Maria Isabel Cabaço and Marcel Besnard.
ii
The work here presented was profoundly influenced by the knowledge and technical expertise shared with different researchers of extraordinary value:
- Professor Ignasi Queralt from Instituto de Ciencias de la Tierra Jaume Almera (CSIC) in Barcelona;
- Professor Alex Von Bohlen from Institute for Analytical Sciences (ISAS) in Dormunt;
- Doctor Marcel Besnard from Institut des Sciences Moléculaires (CNRS) in Bordeaux;
- Professor Isabel Cabaço from Centro de Física Atómica da Universidade de Lisboa (CFAUL) in Lisbon;
- Professor Luis Peralta from Laboratório de Instrumentação e Física Experimental de Partículas (LIP) in Lisbon;
- Eng. Isabel Ribeiro from Laboratório José Figueiredo (IMC) in Lisboa.
For the amazing working environment and out of office activities, I would to thank all my friends and colleagues from Centro de Física Atómica, Marta Manso, Ana Guilherme, Diana Guimarães, Ana Cavaco, Teresa I. Madeira, Mauro Guerra, Jorge Sampaio, Pedro Custódio, Tânia Almeida and Gonçalo Picado. Moreover, I would like to acknowledge the help of Ana Guilherme and Mauro Guerra in the revision of the thesis.
On a more personal level I would like to thank my friends, most of whom I met in kindergarden, namely Patricia Calvinho, Rita Barregão, Ana Marta Ribeiro, Vanessa Nunes, Andreia Pedregal and Telma Espírito Santo, for cheering me in my investigation as much as offering me excuses to get out of the office!
More importantly, I would like to thank my family: my parents, Mário Sousa and Vladimira Pessanha, for being a constant source of encouragement and support throughout my life; my brother, Mário (Mairinho) Sousa, the sweetest babysitter one could find; and my husband Ricardo Moreno, for providing the soundtrack of my days; I would also like to evoke the loving memory of my grandparents and the hopeful vision of my daughter, Eva.
iii
List of publications resulting from this work
S Pessanha, M Guerra, S Longelin, A Le Gac, M Manso, M L Carvalho, Determination of gold leaf thickness in a Renaissance illumination using a non-destructive approach DOI: 10.1002/xrs.2518
S Pessanha, A LeGac, T I.Madeira, M L Carvalho Elemental analysis by portable Ag and Rh x-ray sources of a Namban folding screen Nucl Inst Meth Phys Research B 309 (2013) 254-259
S Pessanha, A. Le Gac, T. I. Madeira, M. Manso, M. L. Carvalho Characterization of a Namban folding screen from the Edo period by means of EDXRF, SEM-EDS and Raman spectroscopy X-Ray Spectrom. 42 (2013) 128–133
S Pessanha, M. Manso and M. L. Carvalho, Application of spectroscopic techniques to the study of illuminated manuscripts: a survey, Spectrochim acta B 71–72 (2012) 54–61
S Pessanha, A LeGac, T I Madeira, J-L Bruneel, M L Carvalho, Evaluation of the intervention of a folding screen belonging to the Momoyama period by Raman spectroscopy using different wavelengths¸ J Raman spectrosc 43 (2012) 1699– 1706
A Ferreira, F Figueira, S Pessanha, I Nielsen and M.L. Carvalho, Study of air induced paper discolorations by FTIR, XRF and SEM, App Spectrosc 64 (2010) 149-153
S Pessanha, M L Carvalho, M I Cabaço, S Valadas, J-L Bruneel, M Besnard, M I Ribeiro, Characterization of two pairs of 16th century Nambam folding screens by Raman, EDXRF and FTIR spectroscopies, J Raman Spectrosc, 41 (2010) 1220-1226
M. Manso, S. Pessanha, F. Figueira, S. Valadas, A. Guilherme, M. Afonso, A. C. Rocha, M. J. Oliveira, I. Ribeiro, M. L. Carvalho, Characterisation of foxing stains in eighteenth to nineteenth century drawings using non-destructive techniques, Anal Bioanal Chem (2009) 395:2029–2036
iv
Table of contents
Acknowledgements……….…….i
List of publications resulting from this work………...…………..iii
Table of contents………..…………..iv
Resumo………..………..1
Abstract………...………....4
1. Chapter I – state of the art………..6
1.1.X-ray Fluorescence………...………..7
1.2.Raman spectroscopy………...………...11
2. Chapter II – X-ray Fluorescence………...………...14
2.1.Basic principles of X-ray Fluorescence………15
2.2.Interaction of X-rays with matter……….18
2.2.1. Attenuation of X-rays………..………..18
2.2.2. Reflection of X-rays………..………23
2.3. Portable spectrometers……….25
2.4. Production of X-rays………....25
2.4.1. X-ray tubes………26
2.4.2. Collimation and focusing………..27
2.5. Detection of X-rays………..29
2.6. Spectrum evaluation……….32
2.7.Quantification procedure………...33
2.8. Portable equipments used in this work……….36
3. Chapter III – Raman spectroscopy………...38
3.1. Basic principles of Raman spectroscopy……….39
3.2. Raman instrumentation………....41
3.2.1. The confocal Raman microscope………....44
3.3. Raman confocal microscopes used in this work………..45
4. Chapter IV – µ-XRF in the study of paper discolorations………...46
4.1. Experimental………...47
4.1.1. µ-XRF equipment……….……47
4.1.2. Detection limits………47
4.1.3. Quantification procedure………..48
4.2. Characterization of foxing stains in 18th-19th century drawings………...49
4.2.1. Introduction………...………..49
v
4.2.3. Results………...…52
4.3. Study of air induced paper discolorations by µ-EDXRF……….55
4.3.1. Introduction………...……55
4.3.2. Specimen description………....……55
4.3.3. Results……….….….…57
5. Chapter V – Material characterization of Namban folding screens……….………59
5.1.Experimental……….60
5.1.1. X-ray Fluorescence………...…60
5.1.2. Raman spectroscopy………..…61
5.2. Introduction………...………..……61
5.3.The Namban folding screens at Museu Nacional de Arte Antiga……….63
5.3.1. Specimen description………63
5.3.2. Results………..……….65
5.4.The Namban folding screens at Museu Nacional Soares dos Reis………...71
5.4.1. Specimen description………71
5.4.2. Results………..….72
5.5.The Namban folding screens at Museu Oriente…………..………..81
5.5.1. Specimen description………....81
5.5.2. Results………...84
5.6.The two paneled screen from a private collection – the boat scene……….89
5.6.1. Specimen description………89
5.6.2. Results………...…90
5.7.The two paneled screen from a private collection – the parasol scene ………...….94
5.7.1. Specimen description………94
5.7.2. Results………..….95
6. Chapter VI – Determination of gold leaf thickness……….101
6.1. Experimental………..102
6.1.1. X-ray Fluorescence………..………...102
6.2.Introduction………104
6.3. The gilding of Manueline charter of Murça…………..……….105
6.3.1. Specimen description………..………105
6.3.2. Methodology ………..………107
6.3.3. Results………..………...………109
6.4.The gilding of Namban folding screens…………..………...….112
6.4.1. Specimen description………112
6.4.2. Methodology ………113
6.4.3. Results………...………115
7. Conclusions and outlook………116
8. Bibliography………...………120
1
RESUMO
A aplicação de técnicas analíticas, originalmente desenvolvidas para o campo das ciências de materiais, ao estudo de objectos de arte e arqueologia proporciona aos historiadores de arte e conservadores a possibilidade de obter informações acerca dos materiais de modo a responder às questões do onde, quando e por quem cada peça foi produzida. Considerações acerca do estilo, combinadas com avaliações da estética e estudo de arquivo podem, normalmente, providenciar uma resposta, no entanto, estilos podem ser copiados em épocas e lugares diferentes dos originais. Assim, a investigação da composição química dos materiais utilizados é fundamental para determinar proveniências e explorar tecnologias de produção. Por outro lado, a caracterização material de Herança Cultural é fundamental para projectos de conservação de modo a diferenciar partes originais de repintes e de modo a compreender que materias podem ser utilizados.
O trabalho aqui apresentado pretende demonstrar a eficácia da técnica de fluorescência de raios-x (do inglês XRF) com equipamentos portáteis, por vezes complementada com espectroscopia Raman, na obtenção de respostas a questões de caracterização, conservação e autenticação de obras de arte em suporte de papel e pergaminho.
O trabalho inicia com a apresentação do estado da arte no que respeita à utilização de XRF portátil e espectroscopia Raman em estudos semelhantes. Apesar da adequação desta técnicas estar já comprovada, constantes desenvolvimentos tecnológicos proporcionam novas potencialidades. Segue-se uma descrição, mais detalhada para o XRF e mais sucinta para o Raman, dos princípios que físicos que sustentam técnicas utilizadas. A primeira técnica usa radiação X para ionizar os níveis mais internos dos átomos da amostra que emitem, consequentemente, radiação caraterística desse átomo e permite uma análise elementar qualitativa e quantitativa. A espectroscopia Raman baseia-se na difusão de radiação monocromática quando irradiada sobre uma amostra. Desta interação resultam alterações nos níveis vibracionais das moleculas que podem ser detectados e as molécula identificadas.
Os resultados são apresentados sob a forma de casos de estudo que pretendem dar resposta a questões em três tópicos principais: a aplicação de µ-XRF ao estudo de descolorações em documentos e desenhos em papel; o estudo dos pigmentos utilizados em biombos de papel estilo Namban de modo a caracterizar os materiais utilizados, datar intervenções de restauro
2
bem como autenticar as peças; por último, o estabelecimento de metodologias para determinar/avaliar a espessura da folha de ouro aplicada em douramentos de peças de arte em suporte papel e pergaminho.
O estudo de manchas e descolorações em papel surgiu da necessidade, por parte de conservadoras e restauradoras da área de papel, de avaliar possíveis alterações na composição química de papel e manchas. Para tal escolheram-se dois dos tipos de mancha que mais infestam as bibliotecas e arquivos portugueses, as manchas de foxing e as manchas induzidas pelo contacto com o ar. Foi efectuada análise quantitativa e comparada a composição elementar da zona com e sem mancha e determinado um aumento de potássio na região manchada para ambas tipologias de descoloração.
O estudo dos biombos Namban também partiu da abordagem da curadora da área de mobiliário e artes orientais do Museu Nacional de Arte Antiga (MNAA), em Lisboa, que procurava informações acerca dos materiais e técnicas artísticas utilizadas nos dois pares de biombos Namban (Sécs. XVI e XVII) a propósito da exposição “Encompassing the Globe – Portugal e o Mundo nos séculos XVI e XVII”. De modo a prosseguir estudos sobre este tipo de peças de arte e obter um maior corpus de estudo, procurámos aceder a todos os biombos Namban ou tipo Namban existentes em colecções portuguesas, públicas ou privadas. Nesse sentido surgiu a oportunidade de estudar dois biombos que se encontravam em ateliers de restauro de modo a ficarem preparados para serem enviados para uma exposição: “Giappone. Terra di incanti - Di linea e di colore” (Japão. Terra de encantos – da linha e da cor) no Museo degli Argenti no Pitti Palace em Florença (Italia). Tivemos também acesso ao par de biombos da colecção do Museu Nacional Soares dos Reis (MNSR), no Porto. Estes biombos haviam sido recentemente recuperados no National Research Institute for Cultural Properties em Tóquio e dessa intervenção havia indícios de um primeiro restauro (sobre a qual não havia registos) e cujos materiais resolvemos investigar. Como não podia deixar de ser, o Museu Oriente (MO), em Lisboa, também possui um biombo Namban em suporte papel, ao qual nos foi concedido acesso. A particularidade deste biombo, adquirido sem par, é o facto de ser mais recente do que os biombos dos outros dois museus e de se tratar de uma cópia e ampliação das cenas retratadas num dos biombos do MNAA.
3
Através a análise material destas peças pôde-se determinar a paleta usada pelos artistas da escola Kano durante os periodos Momoyama (1573-1603) e Edo (1603-1868): malaquite, azurite, indigo, vermelhão, vermelhor de chumbo, branco de conchas e negro de carvão. Nalguns biombos, descobriram-se materiais que só foram sintetizados na segunda metade do Séc. XIX e mesmo Séc. XX e que correspondem a restauros efectuados posteriormente. Esses materiais são. Por exemplo, amarelo e laranja de crómio, litopona ou vermelho de cádmio.
Um dos aspectos que torna estes biombos de um beleza extraordinária é o facto de possuírem um fundo coberto com folha de ouro. No entanto, e visto tratarem-se de amostras de espessura intermédia aplicadas sobre um suporte desconhecido, a análise quantitativa das folhas de ouro seria bastante incerta. A aplicação de métodos de quantificação (bem estabelecidos por XRF), quer por parâmetros fundamentais quer por comparação com padrão implicaria o conhecimento rigoroso da estrutura das camadas que compõem a amostra, bem como a existência de amostras padrão certificadas com as mesmas caraterísticas. No entanto, a caracterização da folha de ouro pode passar também pela análise qualitativa e pela determinação da espessura da folha de ouro. Nesse sentido, foi estabelecida uma metodologia, completamente não destrutiva, para determinação da espessura da folha de ouro em obras de arte em suporte papel e pergaminho, baseada nos diferentes coeficientes de atenuação das diferentes riscas dos elementos. Determinou-se deste modo uma espessura de cerca de 1.6 μm para a folha de ouro utilizada no douramento do foral Manuelino de Murça, e inferiu-se que dos biomos estudados o que teria a folha de ouro menos espessa seria o biombo pertencente ao Museu Oriente.
O aspecto mais importante deste trabalho é o facto de todas as análises de fluorescência de raios-X terem sido efectuadas in situ, nos museus ou ateliers de restauro e apenas quando necessário terem sido recolhidas amostras para análise complementar por espectroscopia Raman. Deste modo, os dois critérios mais importantes a cumprir em análises em Herança Cultural foram mantidos: as peças não foram danificadas nem retiradas do seu ambiente especificamente controlado.
Palavras-chave: XRF portátil; Raman confocal; pigmentos; autenticação; espessura de camadas
4
ABSTRACT
The work here presented aims at demonstrating the efficacy of X-ray fluorescence (XRF) with portable setups, sometimes complemented by Raman spectroscopy in providing answers for characterization, conservation and authentication issues related with artworks in paper and parchment support.
The work begins with a short section regarding the state of the art on the use of portable XRF and Raman spectroscopy in the study of artworks in paper and parchment support. The suitability of the techniques has already been greatly established, however constant improvements from the technological point of view, grant different capabilities.
The work is presented as a group of case studies with the intention of providing answers in three major topics: the application of µ-XRF to the study of discolorations in paper documents and drawings, the study of the pigments used in Namban paper folding screens to accomplish their characterization, dating and authentication and the establishment of methodologies for determining/evaluating the thickness of gold leaf used for gilding.
In some of these case studies we were approached by conservators who had specific demands and then we pursued similar artworks to improve the corpus of study.
The most remarkable aspect of these studies is that all XRF analyses were performed in situ and when there was need for complementary information micro-samples were collected for Raman analysis. This way, the main goals in Cultural Heritage studies were obtained: the artworks were not damaged nor removed from their original location.
5
CHAPTER I –
6
1. State of the art
The application of analytical techniques, originally developed in the field of materials science, to objects of art and archaeology gives the art historians and archaeologists the possibility to gain information about the material composition of such objects and prepares answers to the questions of where, when or by whom such an artifact was made [1]. Stylistic considerations combined with aesthetic evaluations and comprehensive archive studies can commonly provide an answer. However, styles were sometimes copied at locations and times completely different from those of their origin. Hence, investigations of the physical properties and chemical composition of the pieces are useful and increasingly applied to allocate an object to a particular historic or prehistoric context, to determine the correctness of the provenance or to explore the technology used for the manufacturing [2-4]. Furthermore, scientific investigations are also valuable and in some cases indispensable for conservation projects in order to differentiate the original parts of an object from later additions, former restoration works, and to understand what materials can and cannot be used.
Material analysis for Cultural Heritage is almost as old as the scientific documentation of objects of art and archaeology. It was Martin H. Klaproth (1743-1817) who reported in 1795 the chemical composition of Roman coins, ancient alloys and glass based upon gravimetric analyses and newly developed chemical recipes for the separation of Cu, Pb and Sn and their quantitative determination. For his studies large amounts of sample material had to be dissolve in nitric acid, a procedure unacceptable nowadays! At the beginning of the 20th century, microchemical techniques and spot tests were developed which reduced the amount of sample [2]. The thriving development of electronics in recent decades has brought new analytical instruments which, opened new horizons with respect to the material characterization of artworks, namely artworks on paper and parchment support: (XRF) X-Ray Fluorescence in different configurations [5, 6], (SEM-EDS) Scanning Electron Microscopy coupled with Energy Dispersive Spectrometry [7], (PIXE) Particle Induced X-ray Emission [8], (XANES) X-Ray Absorption Near Edge spectroscopy [9], Raman spectroscopy [10], (FTIR) Fourier Transform Infrared Spectroscopy [11],
7
(NMR) nuclear magnetic resonance spectroscopy [10] , (GFAAS) Graphite Furnace Atomic Absorption Spectroscopy [12], etc.
Depending on the information required, one might use a combination of truly non-invasive techniques (i.e. those which do not require a sample to be removed from the object, and which leave the object in essentially the same state before and after analysis), non-destructive techniques (i.e. a sample or complete object can be re-analyzed with the same or other technique, for further examination) and micro-destructive techniques (i.e. those which consume or damage a few picoliters of material). The distinction between these techniques and types of analyses is of particular importance in the Cultural Heritage field. Nevertheless research scientists generally use the term ‘‘non-destructive’’ for any of the above-mentioned analysis methods. In all cases, however, the goal is the maximization of information and the minimization of the consumed volume [13].
Amongst the previously mentioned techniques XRF and Raman spectroscopy, particularly combined together, are the most suitable techniques for, non-destructive, material characterization in Cultural Heritage studies, particularly for artworks in paper and parchment support.
1.1. X-ray fluorescence
In the field of Cultural Heritage, numerous objects cannot be moved from their original location due to physical constraints or because they are simply too valuable. Regarding artworks in paper or parchment support the need of portability is even greater because of the delicate state of conservation of some of the pieces that cannot leave the dedicated environment of the museums/archives. In order to study such pieces, portable energy dispersive X-ray fluorescence spectrometers, that allow in situ analysis, were developed and rapidly became a widely used piece of equipment. Piorek [14], Cesareo et al [15] and more recently Bosco [16] reported the history of the development of portable XRF spectrometer: The first-generation instruments appeared in the 60s, which used radioisotopes and targeted at single element detection such as sulfur in oil. An instrument with several filters was also developed in order to detect several elements one after another. The second-generation portable analyzer, which was an energy dispersive instrument, was
8
developed for geological prospecting in the mid-70s. This instrument used a proportional detector and had to be calibrated using paper and pencil. In the 80s, the third-generation portable energy dispersive spectrometers with a semiconductor detector were developed, in which microprocessors originated the first use of fundamental parameter method. In the 90s, miniaturization of the instrument has been accelerated due to the development of personal computers, detectors, and batteries. Thus the fourth-generation portable spectrometers appeared. On the other hand, the miniaturization of the X-ray tube has been achieved by insulating the tube with resin or ceramic instead of insulating oil. The development of digital signal processor (DSP) also contributed to miniaturization of portable XRF spectrometers. The development of low-power x-ray tubes allowed the instrument to be used safely without any shielding. The main characteristics of these tubes are air cooling, low weight and stability. On the other hand, several types of non-cryogenic, miniaturized detectors are in constant improvement [17]. However, many light elements require advanced instrumentation which often limits practical work to atomic numbers above 13 (Al). Furthermore, only L-lines rather than the K-lines of high atomic number elements (~above 50- Sn) can be measured. That is the cost of portability! There are of course, several degrees of portability, ranging from one of the equipments used by Čechác et al [18] with an annular radionuclide source and a Si(Li) detector cooled with liquid nitrogen, to the ultra-compact, handheld equipment, used by Chaplin et al [19]. There are also equipments that combine different techniques, like the PRAXIS™ (trans)portable equipment used by Van der Snickt [20], where a Raman probe is combined with the EDXRF system using a polycapillary X-ray lens to collimate the beam and a SDD detector cooled by Peltier effect; and the portable equipment combining XRD/XRF that Duran et al. [3, 21] used for the characterization of illuminated manuscripts. This equipment is composed by an air-cooled iMOXS-MFR™ x-ray tube with Cu anode and maximum power of 30 W [22] and a Si-drift detector (Röntec GmbH). A polycapillary half-lens at x-ray tube’s end provides a 4 mm diameter parallel x-ray beam. Most of these equipments are laboratory made, and there are several research groups that dedicate to the implementation and improvement of such systems. An example is the equipment used by Ferrero et al [6] to study the inks on 17th century paper engravings by means of portable EDXRF. The spectrometer combines an x-ray tube from Scientific Instruments, model P/N XRG35 with
9
W anode (max. 0.3 mA and 35 kV) and an Al collimator provides X-ray spots of 5 mm diameter on the sample. The detector is an Amptek™ Si-PIN. The evaluation was made by comparing the peak areas of elements in the ink and in the paper. The same group performed a study on the inks of another paper engraving, now from the 16th century, this time using a EDXRF system with two detectors [23]. This equipment is composed by an X-ray tube (EIS S.r.l.) with Pd anode (max 35 kV, 1 mA) and provides a collimated beam of 2 mm of diameter. The first detector is a Si-PIN detector (Röntec Inc.) and the second one is a high efficiency CdTe detector (Amptek Inc.) The combination of these two detectors makes it possible to detect low and high energy photons, with the high resolution Si-PIN and the high efficiency CdTe detector. Manso et al [24] used a portable equipment to study illuminated manuscripts from the 16th century, stored in the Portuguese National Archive. The portable EDXRF spectrometer was used in situ for inks, pigments and parchment characterization. The spectrometer consists on an Eclipse II Amptek X-Ray tube with an Ag anode. The radiation is collimated by a Ta collimator allowing a 5 mm diameter beam on the sample. The detector is an Amptek XR-100CR™ Si PIN with energy resolution is 190 eV at 5.9 keV and the acquisition system is Amptek PMCA. The angle between the incident and emitted beam is 90° and the sample was positioned at the focal point of two laser beams. An equipment made with the same components but with 30º geometry and a polycapillary collimator on the detector window was used by Cesareo and Brunetti [25] to study 19th century stamps. They considered that in stamp only a negligible amount of radiation interacts with the sample, so a linear relationship is established between the quantity of element (µg/cm2) and the XRF counts. This way, they evaluated the elemental composition of the paper and the pigments used in the collection of stamps.
Artworks in paper or parchment support constitute the simplest stratigraphies, sometimes only one or two layers over the support, however it is important to distinguish information coming from different layers. Čechác et al. [18] studied the Kα/Kβ and Lα/Lβ ratios of characteristic X-rays of the pigment layers in model samples created to simulate illuminated manuscripts. The principle of this technique lays in the different absorption coefficients for the Kα and Kβ lines (and also for the Mα, Lα and Lβ lines). If an element is deposited on a surface, the emitted X-rays are only slightly affected by absorption in the specimen. On the other hand if an element is present at some depth in a bottom layer of the
10
specimen, its characteristic radiation has to penetrate through an upper layer and the characteristic X-ray fluxes are significantly changed. The Kα/Kβ ratio is usually reduced, because the attenuation coefficient for a Kα line is higher than for Kβ. The ratio can be increased only if another element with an absorption edge between the two lines is present in the specimen. This technique was applied to a set of Bohemian books dating back to the 14th and the 15th centuries.
The studies mentioned so far were performed using laboratory made equipments, however there are commercial portable and handheld equipments available for similar applications. For instance, Trentelman et al [26] used the Bruker Tracer III-V™ handheld spectrometer [27] (Re anode, operated at 40 kV, 2 µA, Ti/Al filter) to analyze of 15th century illuminated manuscripts by Jean Bourdichon, and the ARTAX800™ XRF spectrometer also by Bruker to perform line and area scans on other artworks from the same author [28]. Also an ARTAX spectrometer was used by Miguel et al [29] to study the pigments in an 12th century illuminated manuscript, and by Burgio et al to study 16th-18th century Islamic manuscripts [30] and of modern pigments on purportedly medieval miniatures by the ‘Spanish Forger’ [31] both in situ at the Victoria and Albert museum in London. Aceto et al [32] used the Assing Lithos3000™ [33] to study the pigment-caused degradation in a 9th century Italian manuscript. This commercial system utilizes a small-focus Mo x-ray tube and a Si-drift detector. Quantitative analyses were also performed using Lithos3000 3.2 dedicated software with matrix correction and light elements evaluation. A few years later Aceto [34] used both Thermo Scientific® NITON spectrometer XL3T-900 GOLDD™ model [35], equipped with Ag tube (max. 50 kV, 100 µA, 2W) and large area SDD detector, and the ARTAX200 equipped with Mo tube (max. 50 kV, 0.7 mA, 30 W), SDD detector, to study two 6th century Byzantine manuscripts. Bruni et al [36] also used the Lithos 3000 as part of the multianalytical study of a painted and drawn parchment of the late 15th century, or the beginning of the 16th, partly attributed to Andrea Mantegna. In this work authors made use of a Zr filter to monochromatize the radiation coming from the x-ray tube.
The main advantage of this technique, especially when using portable equipment and performing analysis in situ, is the complete non-invasiveness of the method. However, the harmful power of x-rays is known so it is often asked by the conservators and curators the
11
degree of non-destructiveness of the technique. It is a fact that absorption of radiation by an atom bound to other atoms may alter its chemical state permanently, that when dealing with sensitive materials like paper, the object can become darker, brittle and even decompose mechanically [37]. In the case of x-rays , the probability that the primary interaction of a photon causes permanent destruction is very low, however the large number of secondary (fluorescent) photons and electrons emitted during the relaxation process has altogether a considerable destructive potential. In order to evaluate this effect, Mantler and Schreiner [38] irradiated paper samples for up to 4 hours with a XRF spectrometer using maximum power (30 kV and 100 mA). A faint yellow became visible after 15 minutes, after 1 hour cracks were clearly visible and after 4 hours the specimen broke apart at the attempt to remove it from the sample holder. These results show that precautions must be made, namely the use of a much lower intensity and shorter exposition times, when analyzing delicate specimens such as paper or parchment artworks.
1.2. Raman spectroscopy
It is argued that Raman spectroscopy is the most excellent technique for, single-handedly, studying and identifying inorganic solids, especially when they are in heterogeneous mixtures at a micrometer scale [39-41]. Raman spectroscopy probes molecular and crystal lattice vibrations and therefore is sensitive to the composition, bonding, chemical environment, phase and crystalline structure of the sample material. It is a fingerprinting technique and materials are identified by comparing their characteristic vibrational spectra with those in databases [42-44].
Robin J H Clark and his co-workers have been great promoters of the application of Raman Spectroscopy to the study of Cultural Heritage, in particular illuminated manuscripts with over 15 publications. These publications comprise review articles on the application and developments of Raman spectroscopy [41, 45-49] and case studies where Raman microscopy alone [39, (50-53] or in combination with other techniques [19), 30, 54, 55] could characterize an artist’s palette or even detect forgeries [31, 56]. These case studies focused mainly in pigment characterization and included the inedited analysis of the King
12
George III copy of the Gutenberg bible, the study of several European Medieval manuscripts, as well as of Persian, and of Islamic origin.
The characteristics of the Raman technique that make it so well qualified for the analysis of these materials include its molecular specificity, non-destructiveness, applicability to samples of large or non-uniform shape and relative immunity to interference. If we couple a standard optical microscope to a Raman spectrometer, we obtain high magnification visualization of a sample and Raman analysis with a microscopic spot. In a typical set-up, a microscope is coupled to a spectrometer with an intensified diode array or Charge-Coupled device (CCD) detector. Laser radiation is brought to a focus on each grain via the microscope objective (up to x100). The Raman scattering by the sample retraces the path of the incident beam, being collected by the same objective and directed to the monochromator and then to the detector [39]. Raman microscopy has been used to investigate pigments in artworks on paper support either by collecting micro-samples [5], [57-60] or by placing the manuscript directly under the microscope [29, 30, 52, 59, 60]. Eremin et al. [11] collected samples from Tosa Mitsunobu’s “The tale of Genji” to study the used pigments with a Keiser Hololab 5000R [63] spectrometer (lasers 514 nm and 785 nm). More recently [64] they used the Senterra [65] Raman microscope from Bruker® (532, 633 and 785 nm) to study samples removed from 18th to 20th century Thai manuscripts, and found the first evidences of the use of copper citrate as pigment.
Chaplin [56] used a Renishaw System 1000 Raman spectrometer (632.8 nm and 515 nm laser sources) to make the distinction between original 1847 and 1858–1862, forged and reproduction postage stamps of Mauritius. Bicchieri et al [66] used the Renishaw in-Via reflex Raman microscope [67] (785 nm laser) to study the inks in an 18th century Italian manuscript without sampling.
Spatial resolution can be further improved by use of confocal geometries. Traditional Confocal Raman microscopes make use of a pinhole aperture placed in front of the spectrograph entrance slit. The Raman light is focused onto the pinhole and the diverging beam after the pinhole is then refocused onto the entrance slit of the spectrograph. Different pinhole apertures can be used to control the degree of confocality, while the entrance slit is used to control the spectral resolution of the spectrometer. Raman microscopes with confocal geometry have been applied to the study of pigments in illuminated manuscripts
13
by Magistro et al [68], Bicchieri et al [69] and Deneckere et al [70]. Aceto et al [57] used a Confocal Raman microscope to characterize the inks that had undergone severe degradation process in a 9th century Italian manuscript. Manso et al [24] used XploRA Raman microscope [71] from Horiba® (532, 638 and 785 nm) to study the samples of pigments and inks used in the Manueline foral charter of the town of Sintra. More recently Shi et al [72] used same equipment to study the pigments used in three paper currencies issued under the reign of the Chinese Ming and Qing Emperors between 15th and 19th centuries.
In the past years, the appearance of compact, portable Raman equipments with probe heads that are connected to the excitation laser source and base Raman analyzer by fiber optic cables, made possible the in situ use of Raman spectroscopy in the study of Cultural Heritage. P. Vandenabeele et al compared different spectroscopic aspects of such existing instruments, as spectral resolution, wavelength calibration, laser cut-off and general spectral quality to evaluate their suitability for this purpose [73]. These equipments have been also employed in the study of pigments in illuminated manuscripts especially when the value of the codices does not allow the moving from museums or libraries, or that when sampling, even gentle micro-sampling cannot be performed [36, 52, 70, 74, 75]. Bersani et al [40] used two portable equipments, the micro-Raman apparatus of Horiba Jobin-Yvon, model HE (632.8 nm) and the Renishaw RP10 compact spectrometer (514.5 nm) to study five medieval illuminated manuscripts in situ at the Biblioteca Palatina in Parma. In spain, Castro et al used the Renishaw RA100 System [76] coupled to a micro-probe (785 nm laser) to study the paper and the pigments used in two colored maps [7], [10] and modern wallpapers [77, 78].
14
CHAPTER II – X-RAY
FLUORESCENCE
15
2. X-RAY FLUORESCENCE
2.1. BASIC PRINCIPLES OF X-RAY FLUORESCENCE
The principle of XRF technique is the use of excitation radiation to produce ionization in the inner shells of the atoms present in a sample due to photoelectric absorption.
If a photon with energy larger than the binding energy of an inner electron interacts with this bound electron, part of its energy can be absorbed and the electron is ejected. A vacancy is then created in one of the fully occupied inner shells and an electron from an outer shell will fill the vacancy and might cause the emission of an X-ray photon [79, 80] (Fig. 2.1). The newly created vacancy in the outer shell can be filled in turn by an electron still farther out, and another X-ray photon can be emitted. This process repeat and series of photons will be emitted until a free electron ultimately replaces an outermost valence electron so that the atom has finally returned to the ground state.
Fig. 2.1. – Schematics of X-ray fluorescence phenomenon. [81]
Alternatively, an excited atom may return to a state of lower energy by ejecting one electron from a less tightly bound state. The nonradiative transition is called Auger effect. The probability of the Auger effect increases with a decrease in the difference of the corresponding energy states, and it is the highest for low Z elements [79]. If the vacancy is filled by an electron from a higher sub-shell from the same shell, the transition is called Coster-Kronig.
16
An important consequence of the Auger effect is that the actual number of X-ray photons produced from an atom is less than expected. The probability that a vacancy in an atomic shell or subshell is filled through a radiative transition is called fluorescence yield (), and could be defined as the ratio of the useful X-ray photons arising from a certain shell to the total number of ionized atoms. Figure 2.2 represents the fluorescence and auger electron yields as function of the atomic number of the emitter. The fluorescence yield is very low for low Z elements and this one of the reasons why X-ray spectrometric techniques are less sensitive for lighter elements. Conversely the Auger yield can be defined as the ratio of non radiative transition and the total number of ionized atoms
Fig. 2.2. – Fluorescence ( ___ ) and Auger electron (- - - -) yields as function of the atomic number (Z) [80].
Although not every electron is permitted to fill an inner vacancy, there are a lot of allowed transitions according to the selection rules of quantum theory:
l = ±1; j = 0, ±1 [79]
Where l is the azimuthal quantum number and j the total angular momentum.
The most important allowed transitions yielding X-ray characteristic emission are shown in Figure 2.3. The two most used notations the two most used notations for representing the characteristic X-rays are also exemplified, the “Siegbahn notation”, developed by Manne Siegbahn, and the IUPAC (International Union of Pure and Applied Chemistry) notation.
17
Fig. 2.3. – Commonly used terminology and energy levels of X-ray lines. [81]
Moseley´s law can be used to determine energy of an X-ray characteristic line, E:
(2.1) [80]
Where Z is the atomic number of the corresponding element, k is a constant for a particular spectral series and is a screening constant for the repulsion correction due to other electrons in the atom.
18
2.2. INTERACTION OF X-RAYS WITH MATTER
2.2.1. Attenuation of X-rays
If an X-ray beam of intensity I0 hits layer of material of thickness x:
Fig. 2.4. Schematic representation of the attenuation of X-rays through a material.
The attenuation of the intensity of the beam is described by the Lambert-Beer law,
[ ( ) ] (eq. 2.2)
Where (cm-1) is the linear attenuation coefficient and (cm2/g) is the mass-attenuation coefficient for material of density (g/cm3). The intensity exponentially depends on the thickness of the layer. The mass attenuation coefficient (/ ) is a quantity that depends on the composition of the material and the energy of the X-ray photons.
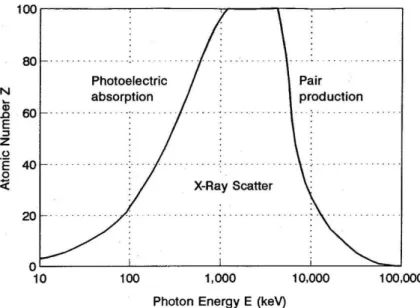
The attenuation of X-rays is caused by the interaction of the photons with the electrons, inner or outer, or even with the nuclei. It results from three effects: photoelectric absorption, X-ray scatter and pair production. As indicated in Fig. 2.5, pair production does not occur for E < 1 MeV so this phenomenon is not relevant for X-ray spectroscopy [80].
19
Fig. 2.5 –Predominant effects for the attenuation of X-rays [80].
For the used energies in X-ray Fluorescence the most important effect for X-ray attenuation is photoelectric effect. Photoelectric effect occurs when an electron of an inner shell is expelled by an incoming photon of sufficient energy. The primary photon is completely annihilated while a secondary photon is emitted after the electronic rearrangement and the X-ray fluorescence phenomenon occurs (as described in section 2.1). The kinetic energy of the characteristic photon (Eph) can be obtained as the difference of the binding energies of
the initial, Ei, and final, Ef, shells. For example, the energy of the K shell would
correspond to the difference of the binding energies for the K and L3 shells:
Photoelectric absorption is evaluated numerically by a specific mass absorption coefficient (/ ), the sum of all possible expulsions of electrons from the various atomic shells K, L, M, etc..
(
) (
)
(
)
(
)
(eq. 2.4) (80)
The different additive parts can be further split up according to the corresponding subshells. Figure 2.6 shows the plot of mass absorption coefficient (/ ) versus the photon energy and corresponding absorption edges energies.
20
Fig. 2.6. Photoelectric mass absorption coefficient ( ) for Mo as function of energy. [80]
The second component of X-ray attenuation is caused by the scattering of X-ray photons though two possible processes:
- Rayleigh scattering (coherent scattering) - a process by which photons are scattered by bound atomic electrons and in which the atom is neither ionized nor excited. The incident photons are scattered with unchanged frequency and with a definite phase relation between the incoming and scattered waves. Rayleigh scattering occurs mostly at the low energies and for high-Z materials. [79]
- Compton scattering (incoherent scattering) – is the interaction of a photon with a loosely bound outer electron, leading to a change of direction and loss of energy of the incident photon. The electron is also ejected in a different direction: (Fig. 2.7).
21
The loss of energy a photon experiments in Compton scattering results from the conservation of total energy and total momentum at the collision. A photon with the energy,
E, is deflected into another direction with energy, E’, when deflected by an angle, , while
the electron takes off the residual part of energy ΔE=E-E’. The fraction E’/E can be calculated according to:
(eq. 2.5)
Where, Ee, is the rest energy of an electron (511 keV).
The intensity of the scattered radiation shows a dependence on the initial energy, E, and the deflection angle, , as shown in Figure 2.8.
Fig. 2.7.Normalized fraction of scattered intensity (Compton scatter) as a function of the angle of deflection, [80].
The minimum for the scattered intensity is achieved for a deflection around 90º-100º. For that reason a 90º geometric arrangement of the X-ray tube, sample and detector is generally chosen to minimize inelastic scatter into the detector. Similar results were recently obtained by Guerra et al. [82] by comparing the Compton and Rayleigh scattering of the tube
22
radiation for different materials and different geometries for symmetrical in-plane spectrometers in the 1-30 keV range.
Even under the best geometrical conditions, and from a practical perspective, the sample matrix is the main responsible for the diffusion effects, and for the total amount of scattered radiation by Compton and Rayleigh effects. Pessanha et al. [83] compared these effects for different mean Z samples and obtained that for light matrices, the predominant effect is Compton scattering, while for heavy matrices the Rayleigh effect takes the lead.
These effects have to be added to photoelectric mass absorption (/ ) leading to the total mass attenuation coefficient (eq. 2.2):
(
) (
) (
)
(eq. 2.6) [80]
Where
(
)
is the mass-scatter coefficient, which takes into account both scattering effects.The mass attenuation coefficient (/ ) is proportional to the total photon interactions cross-section per atom according to:
A NA
(eq. 2.7) [84]
Where is the sum of the cross-sections for all the elementary scattering and absorption processes (barns/atom= 10−24 cm2/atom), A is the atomic weight (g mol-1) and NA the
Avogadro number (6.022x10²³ atom mol-1).
If the absorber is a chemical compound or mixture, its mass attenuation coefficient follows an additive law so that values can readily be calculated from values of the individual elements if the elemental composition is known:
(
) ∑
(
)
(eq. 2.8) [84]Where the values of wi are the mass fractions of the different elements present in the
23
2.2.2. Reflection of X-rays
When radiation passes from a medium to another of different physical density, i.e. different refractive indices it will be deflected from its original direction, as can be seen in Fig. 2.8:
Fig. 2.8. Incident, reflected and refracted beams at the interface of two media.
The glancing angles of the incident beam and the reflected beam are equal (1=*1) and the
glancing angles of the incident beam and the refracted beam follow Snell´s law:
2 2 1
1cos n cos
n (eq. 2.9)
Where n1, n2 are the refractive indices of medium 1 and 2, respectively.
For X-rays, any medium is optically less dense than vacuum (n’<nvac=1) so the refractive
index for all materials is smaller than unity by only a small decrement, and can be written as a complex quantity:
i
n1 (eq. 2.10) [80]
Where, 1-, represents the real part of the refractive index, and the imaginary, , is a measure of the attenuation. The variation of the decrement, , with the X-ray energy, for energies above the absorption edge of the material, is given by:
2 2 A Z r N e A (eq. 2.11)
Where NA is the Avogadro’s number, re is the classical electron radius (2.818x10⁻¹³ cm), is the density (g cm-3), Z and A (g mol-1) are, respectively, the atomic and the mass number of the element and, , the wavelength of the primary beam.
The imaginary component can be expressed by: 4 (eq. 2.12)
24
Values of remain very small throughout the X-rays region, being generally in the order of 10-6, with the consequence that radiation is weakly refracted by any material. Taking into account that for X-rays, any medium is optically less dense than vacuum the refracted beam is deflected towards the boundary plane (see Fig. 2.8). If the angle of refraction, 2, becomes 0º, the refracted beam will emerge tangentially to the boundary surface. The angle of incidence is then called critical, crit, and, according to equation 2.9 is given by:
2
coscrit n (eq. 2.13) [80]
For angles lower than the critical angle, crit, no beam enters into the second medium, the incident beam is completely reflected back into the first medium and total reflection occurs. Since crit is very small its cosine can be approximated by:
2 1 cos 2 crit crit (eq. 2.14)
Equation 2.15 together with equation 2.12 gives the approximation:
A Z E crit 65 . 1 (eq. 2.15)
For low-medium atomic number elements, A≈2Z so we can write
E crit 17 . 1 (eq. 2.16)
Where the energy, E, is given in KeV and the density, , in g.cm-3 in order to get the critical angle in degrees. Again, this equation is only valid for photon energies above the absorption edges of the material. The angles are typically in the range of 0.1º-1º, for example, for glass the critical angle for an incident energy of 17.44 keV (Mo Kα) is 0.098º [80]. The reflectivity of a material is the intensity ratio of the reflected and incident beam and depends on the energy of the beam. The reflectivity is below 0.1% for glancing angles of 1º and more and rises up to 100% around the critical angle. For glass, at an incident energy of 17.44 keV and at the critical angle, the reflectivity is 93.4%.
25
2.3. Portable spectrometers
X-ray Fluorescence (XRF) portable spectrometers are becoming very popular for the in situ analysis of elements. This is mainly because XRF is a nondestructive, multielemental technique that is extremely well suited for the analysis of any material, mainly in the field of Cultural Heritage [2, 85]. An XRF spectrometer consists of an X-ray excitation source, an x-ray detector with electronics and a pulse-height analyzer. Recent technological developments have resulted in small, low-power, dedicated X-ray tubes, thermoelectrically cooled x-ray detectors and small pulse-height analyzers. Therefore, completely portable XRF spectrometers are available that can be taken outside the laboratory and brought to the artwork.
2.4. Production of x-rays
The method used in this work to produce X-rays is to use an X-ray tube.
In an X-ray tube, a beam of electrons emitted by the filament are accelerated by a strong electric field and directed to a target (anode). Electrons impinging on the target material interact with the electrons of the atoms, and if they have kinetic energy greater than the binding energy of an orbital electron, the bound electron may be ejected from the atom. By returning to the ground state, characteristic radiation of the element of the target is emitted. Furthermore, electrons are decelerated due to the Coulomb field of the nucleus. Deceleration implies that kinetic energy is lost, one of the ways in which the electron losses energy is by emitting a photon with the same energy as the lost kinetic energy. This process is called Bremsstrahlung and if a large number of electrons interact with a target material, the resulting Bremsstrahlung radiation consists of photons with a continuum of energies from zero to a maximum value equal to the initial electron kinetic energy [84].
If an X-ray tube is operated at a voltage, V0máx, all electrons get the final maximum energy, Emáx, according to:
26
The intensity distribution of the continuum bremsstrahlung can be described by ( )
(eq. 2.18) [80]
Where N(E)dE is the number of photon with energies between E and E+dE; k is a constant;
i is the tube current; and Z is the atomic number of the target material.
This formula, illustrated by Fig. 2.9, shows that the number of photons is inversely related to the energy E of these photons, decreasing to zero when E approximates Emáx given by the
anode voltage.
Fig. 2.9. Spectrum emitted from a Mo anode X-ray tube operated at 60 kV.
2.4.1. X-ray tubes
There are different types of X-ray tubes according to the specific application. The most important physical parameters to characterize an X-ray tube are the maximum high voltage and current, and the anode material. From equation 2.18 we can see that the strongest continuous radiation can be obtained from anode materials of high atomic number, however the conversion of the high voltage electrons into X-rays is a very inefficient process and the majority of the energy appears as heat. Under these conditions it is vital that the anode is a good heat conductor. X-ray tube windows are normally made of Beryllium (Be) because of their high transmission for low energy X-rays, but Be is a poor conductor so if a window is too thin it can lead to fracture. Because the amount of electron backscatter increases with
27
the atomic number of the anode, window heating problems are more critical for higher atomic number anodes. This way, a compromise has to be considered when choosing the thickness of the Be window for a specific anode [86].
In the last few years, small-sized X-ray tubes have been produced expressly for EDXRF analysis. Manufacturers include Oxford Instruments® [87], Amptek® [81], Varian® [88] and Moxtek® [89]. They are characterized by various anode materials (W [90], Mo [91], Rh [92], Ag [60], Cu [93], etc.), high voltage up to 50 kV and current up 2 mA so that just regular air cooling or cooling with a simple fan is needed [15].
According to the position of the anode and consequently the Be window we can differentiate reflection and transmission target and side-window or end-window X-ray tubes respectively (Fig. 2.10). In a side-window tube the angle between the target surface and the normal to the window (anode angle) can amount to 15–25º. As for end-window tubes usually have transmission targets thin enough (about 2 µm) to allow X-rays to pass through the target and X-rays are emitted in the same direction as the electrons are moving.
Fig. 2.10. – a) Side-window and b) end-window X-ray tubes [94]
2.4.2. Collimation and focusing
Normally the X-rays exit the tube with a conical angular distribution of 100º-150º so a collimation is needed to reduce the beam size to a desired value and position. The simplest way to do this is to intercept the X-ray beam with a collimator, i.e., a shield absorbing the incident photons, except those crossing a hole of proper diameter in the shield itself [84]. The drawback of this method is the loss of beam intensity, the smaller the size of the hole, the higher the loss of intensity. To overcome this limitation, capillary and polycapillary lenses can be used to focus the beam. X rays striking the interior of hollow channels at grazing incidence are guided along the channel by total reflection (Fig. 2.11a) (section
28
2.2.2.). Focusing or collecting effects come from the overlap of the beams from thousands of capillary channels, rather than from the action within a single tube (Fig. 2.11b). As for single capillaries, x rays can be transmitted down a curved hollow tube as long as the tube is small enough and bent gently enough to keep the angles of incidence less than the critical angle for total reflection (Fig 2.11b). One side of each capillary of the bundle is pointing to the X-ray source and the other side is pointing to the focus area (Fig. 2.11c).
Fig. 2.11. –a) X-rays traveling in a bent capillary tube. The ray entering close to the center of curvature strikes at a larger angle b) Cross-sectional scanning electron micrograph of a polycapillary optic.
c) Sketch of the interior channels of polycapillary optic.
The reflection of x rays, which are reflected down the length of the capillary, is governed by the critical angle, which is approximately 1.5 mrad or 0.1° at 20 keV and is inversely proportional to photon energy (eq. 2.16). Together with the increased absorption of X-rays in the lower energy region, these two phenomena make up a band pass feature. By selecting the capillary dimension properly we are able to design capillaries for different requested beam sizes and anode material.
29
2.5. Detection of X-rays
A detector is an instrument that yields information about the radiation crossing it, characterized by the types of radiation that it is able to detect, by its structural characteristics such as area, thickness, composition, entrance window, and by several working parameters such as energy resolution, sensitivity, efficiency and time resolution [95]. The most common X-ray detectors used for portable spectrometers are semiconductor detectors, namely Si-PIN and Si-drift detectors (SDD), available from different manufacturers, Amptek [81], Vortex [96], Ketek [97], etc.
In a Si-PIN photodiode there are two planar contacts, the anode and the cathode, with a uniform electric field between them. An X-ray interacts at some location, ionizing the Si atoms and producing electron-hole pairs. The electric field sweeps the carriers to their respective contacts, causing a transient current pulse to flow through the diode (Fig. 2.12a). On the other hand, in the drift diode the planar cathode is maintained but the anode is very small and surrounded by a series of electrodes. The SDD is cylindrically symmetric, so the anode is a small circle and the drift electrodes are annular. These electrodes are biased so as to create an electric field which guides the electrons through the detector, where they are collected at the anode (Fig.2.12b). In both cases the pulses are amplified and classified with a pulse-height analyzer that produces a spectrum [84].
Fig. 2.12. – Sketch illustrating the operation of a) conventional photodiode b) drift diode detector. [81]
Since the average energy to create an electron-hole pair is well defined (ε=3.76 eV at 77K for Si) the total number of charges is directly proportional to the energy of the incident photon, and the frequency of such events is proportional to the photon´s intensity.
30
One of the most important parameters of a detection system (detector plus amplifier and multichannel analyzer) is the energy resolution, which measures the capacity of the system to distinguish between photons very close in energy. The energy resolution of the detector alone is also called intrinsic and depends on the statistical spread in the number of events, i. e., the number of pairs produced in a semiconductor detector by a photon with a given energy.
The energy resolution is normally expressed as the full width of the peak at half maximum height (FWHM) of the measured distribution. The larger the FWHM, the more difficult will be to identify of peaks corresponding to photons of close energies. The measured distribution can be described by means of a Gaussian function, whose expression is given by:
[ ( ) ] (eq. 2.19) [95]
Where σ is the standard deviation, N0 is the peak area and E0 is the peak centroid. The
FWHM is related to the σ as:
FWHM = 2,35σ (eq. 2.20)
The contribution of statistical fluctuations in the conversion process of the photon energy into charge carriers is unavoidable. This statistical resolution is generally characterized by a variance (σE2) proportional to the number of carriers generated in the detector. For a given
conversion factor, ε, from energy to number of carriers, the standard deviation of carriers is
√ , the resolution:
(eq. 2.21)
In semiconductor detectors the variance of the generated charge is smaller than the predicted by Poisson statistics. This deviation is taken into account by introducing the Fano factor as follows:
̅. (eq. 22)
Where F is the Fano factor and ̅ is the average number of carriers. This results in a resolution of:
31
In the early 90’s the average resolution of a portable, thermoelectrically cooled detector was 850 eV. The 200 eV FWHM barrier was broke in 1996 by the Amptek Si-PIN detector further selected to the Mars Pathfinder mission [17], and nowadays, manufacturers promise a resolution of 145 eV for Si-PIN and 125 eV for Si-drift detectors [81].
In order to characterize a detection system, it is also important to determine the fraction of the total number of photons emitted by the source, which actually interact in the detector volume and are completely absorbed, the detection efficiency. A first limitation to the detection efficiency arises from the limited active area of the detector and from the distance with respect to the source (geometrical efficiency). Moreover, the specific absorption coefficient of the detector material at a given photon energy and its thickness limit the number of photons which are actually absorbed (intrinsic efficiency). Finally, events that deposit only part of their energy in the detector do not contribute to the full energy peak in the spectrum (photopeak efficiency). [95] Fig. 2.13 shows the efficiency/transmission curves for the Amptek super SDD detector with Si thickness of 500 µm. We can see that the efficiency is over 90% between 3 and 5 keV and nearly 100% between 5 and 10 keV, then decreasing to 40% for 20 keV.
32
Another important parameter characterizing a detector is its sensitivity, corresponding to the capability to produce a usable pulse for a given type of radiation and energy. This parameter depends on the following factors: the detector cross-section and the detector volume which determine the probability that the incident radiation will convert its energy into the detector; the detector window, that will absorb part of the incident radiation setting the lower limit of the energy that can be detected; the intrinsic detector noise that will determine the minimum amount of pulse producing an usable signal. [84]
2.6. Spectrum evaluation
To evaluate an X-ray spectrum it is necessary to understand all the phenomena that contribute to the final appearance of the spectrum. This includes not only the two main features, characteristic lines and background, but also a number of spectral artifacts.
The natural width of characteristic radiation of a particular X-ray line has a Lorentz distribution. Peak profiles observed with a semiconductor detector are the convolution of this Lorentz distribution with the nearly Gaussian detector response function, giving rise to what is known as a Voigt profile. Since the Lorentz width of K and L shell lines, is of the order of only 10 eV for elements with Z<50, whereas the width of the detector response function is of the order of 160 eV, a Gaussian function is an adequate first-order approximation of the line profile [98].
When the photoelectric events occur deep inside the detector, the characteristic detector material X-rays are reabsorbed and contribute to the full energy peak. However, for events which occur near the surface, there is a significant probability that the characteristic X-ray escapes and the corresponding amount of energy is lost from the signal. In the case of Si detectors, the escape peak will have the energy of the original peak minus 1.74 keV. Incomplete charge collection occurs when some of the electron-hole pairs are not swept to the electrical contacts, resulting in a charge signal measured lower than expected and, consequently, in an energy measurement lower than the energy of the incident X-ray and a tailing in the low energy side of the peak in the spectrum. These artifacts could be reduced by preventing the incident radiation from interacting in the periphery of the detector by means of collimation [79].

![Fig. 2.13. Efficiency/transmission curves for the Amptek super SDD detector. [81]](https://thumb-eu.123doks.com/thumbv2/123dok_br/15179443.1015752/41.918.255.665.641.964/fig-efficiency-transmission-curves-amptek-super-sdd-detector.webp)